Chateau Nursing and Rehabilitation Center
Nursing Home, Memory Care, Nursing Care & Palliative Care · DuPage County, IL
CMS overall rating Info CMS (the Centers for Medicare & Medicaid Services) is the federal agency that rates nursing home quality. Its Overall Rating runs from 1 to 5 stars, combining health inspections, staffing, and quality measures, with inspections weighted most heavily.

Chateau Nursing and Rehabilitation Center

Nursing Home, Memory Care, Nursing Care & Palliative Care · DuPage County, IL
CMS overall rating Info CMS (the Centers for Medicare & Medicaid Services) is the federal agency that rates nursing home quality. Its Overall Rating runs from 1 to 5 stars, combining health inspections, staffing, and quality measures, with inspections weighted most heavily.
Calculator: See prices in your area
Chateau Nursing and Rehabilitation Center accepts Medicare, Medicaid, and private pay.

Overview of Chateau Nursing and Rehabilitation Center

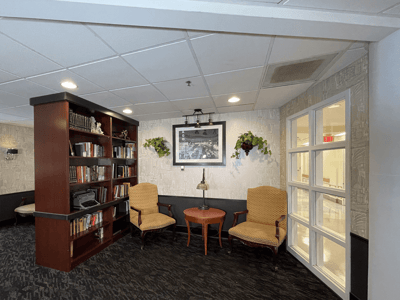
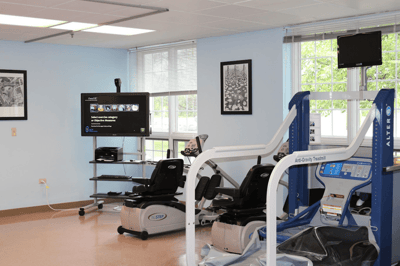
Live a fulfilling lifestyle while maintaining your maximum potential in Chateau Nursing and Rehabilitation Center, a vibrant and welcoming community in Willowbrook, IL, offering exceptional care. Their team is highly skilled in providing residents with skilled nursing care and various rehabilitation services, helping residents maintain their overall functioning. Residents here are given pain management services and access to physical, speech, and occupational services for a comfortable and pain-free healing journey.

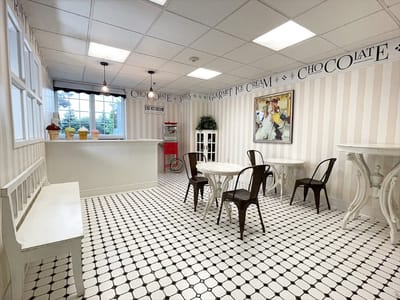
Countless leisure and recreational activities are also available to ensure residents stay active and well-connected. With housekeeping services provided regularly, residents can focus on living their best lives while enjoying the comfort of their safe and well-organized living environment. Here, residents are given all the comfort and support they need to maintain their well-being and continue enjoying the golden years they deserve.

(630) 323-6380

Quality ratings

Measured by Centers for Medicare & Medicaid Services (CMS)

Overall rating Info The Overall CMS Rating combines results from health inspections, staffing levels and quality measures. Health inspections carry the most weight. Staffing and quality scores can increase or decrease the final rating based on performance compared to state and national standards.
▲ 19.0% Above IL avg. ▲ 19.0% Above IL avg.IL average: 2.5Click the badge to see the full State ranking.Click here to see the full State ranking.
Health Inspection Info Based on the results of the facility's three most recent standard inspections and any complaint investigations. CMS reviews the number, scope, and severity of deficiencies, with more recent findings weighted more heavily.
▲ 44.1% Above IL avg. ▲ 44.1% Above IL avg.IL average: 2.8Click the badge to see the full State ranking.Click here to see the full State ranking.
Staffing Info Measures average nursing staff hours per resident per day, including Registered Nurses (RNs) and total nursing staff. Ratings are adjusted based on the level of care residents require and are compared to state and national benchmarks.
▼ 53.2% Below IL avg. ▼ 53.2% Below IL avg.IL average: 2.1Click the badge to see the full State ranking.Click here to see the full State ranking.
Quality Measures Info Based on clinical and physical health indicators reported to CMS, such as hospital readmissions, falls, pressure ulcers, and improvements in mobility. These measures reflect how well residents' health needs are being managed.
▲ 6.6% Above IL avg. ▲ 6.6% Above IL avg.IL average: 2.8Click the badge to see the full State ranking.Click here to see the full State ranking.

Staffing hours breakdown

Info Daily nursing hours per resident by staff type, reported to CMS. Higher is generally better — compare this facility to state and national averages to see where staffing stands.

Hours per resident per day — compared to Illinois state averages

Total nursing care / resident Info This home is ranked 129th out of 172 homes in Illinois for nurse hours. Total adjusted nursing hours per resident per day, combining RN, LPN, and aide time. CMS adjusts this for case-mix so facilities can be fairly compared.
2h 29m per day
Rank #129 / 172Nurse hours — State benchmarkedThis home is ranked 129th out of 172 homes in Illinois. Shows adjusted nurse hours per resident per day benchmarked to the Illinois average, with a ranking across 172 Illinois facilities. More hours mean more direct care. The national average is about 3.5 hrs; below 3.0 is a red flag.Ranking totals vary by category as each rank only includes facilities that report data for that metric. Homes missing that data point aren't included in the ranking.Click the rank badge to see the full State ranking.Click here to see the full State ranking.
This facility Illinois avg (3h 6m per day)
vs Illinois avg
-20%

5 of 6 metrics below state avg

Standout metric LPN / LVN is +23% above state avg
Staff typeHours / Day / Residentvs state avg
Registered Nurse (RN) Info RNs hold the highest nursing license and can assess residents, interpret test results, and direct care plans. More RN hours per day often signals stronger clinical oversight and faster response to health changes. 34m per day ▼ 23% State avg: 44m per day · National avg: 41m per day
LPN / LVN Info Licensed Practical Nurses (LPNs) or Licensed Vocational Nurses (LVNs) deliver routine hands-on care — medication administration, wound dressing, and monitoring vital signs. They work under RN supervision and make up a large share of daily bedside care. 47m per day ▲ 23% State avg: 38m per day · National avg: 52m per day
Nurse Aide Info Certified Nurse Aides (CNAs) provide the most direct day-to-day assistance: bathing, dressing, feeding, and mobility. Nurse aide hours are typically the largest staffing category and directly affect residents' quality of life. 1h 55m per day ▼ 10% State avg: 2h 8m per day · National avg: 2h 21m per day
Weekend Total Nursing Info Combined nursing hours (RN + LPN + Nurse Aide) per resident per day on weekends. Staffing often drops on weekends — this figure reveals whether the facility maintains adequate coverage outside of weekday hours. 2h 56m per day ▼ 5% State avg: 3h 5m per day · National avg: 3h 26m per day
Physical Therapist Info Hours per resident per day provided by licensed Physical Therapists (PTs) or PT Assistants. PT services help residents recover mobility after injury or illness and are especially important for post-acute (short-stay) rehabilitation. 1m per day ▼ 58% State avg: 3m per day · National avg: 4m per day
Weekend RN Info Registered nurse hours specifically on weekends. Facilities sometimes reduce RN presence on Saturdays and Sundays — a low weekend RN figure compared to weekday hours can indicate reduced clinical oversight when most administrative staff are absent. 29m per day ▼ 14% State avg: 34m per day · National avg: 29m per day

Capacity and availability

This home usually has availability

Higher occupancy than the Illinois average: 69.3%
Occupancy rate
74.6% Rank #103 / 204Occupancy rate — State benchmarkedThis home is ranked 103rd out of 204 homes in Illinois. Shows this facility's occupancy rate versus the Illinois average, with its Statewide rank out of 204. Higher occupancy signals strong local demand and financial stability.Ranking totals vary by category as each rank only includes facilities that report data for that metric. Homes missing that data point aren't included in the ranking.Click the rank badge to see the full State ranking.Click here to see the full State ranking.
Avg. Length of Stay
332 days
Bed community size
150-bed community Rank #51 / 426Bed count — State benchmarkedThis home is ranked 51st out of 426 homes in Illinois. Shows this facility's certified or reported bed count compared to other Illinois facilities. Larger communities may offer more amenities, programs, and on-site services for residents and families.Ranking totals vary by category as each rank only includes facilities that report data for that metric. Homes missing that data point aren't included in the ranking.Click the rank badge to see the full State ranking.Click here to see the full State ranking.
A larger shared setting that may offer more common spaces and organized community services.
Walk Score
Walk Score: 28 / 100 Rank #509 / 648Walk Score — State benchmarkedThis home is ranked 509th out of 648 homes in Illinois. Shows how walkable this facility's neighborhood is compared to the average Walk Score across Illinois facilities. Higher scores benefit residents, families, and staff.Ranking totals vary by category as each rank only includes facilities that report data for that metric. Homes missing that data point aren't included in the ranking.Click the rank badge to see the full State ranking.Click here to see the full State ranking.
Somewhat walkable. A few nearby services may be reachable on foot, but most trips require transportation.

About this community

Therapy & Rehabilitation

1 service
Rehabilitation Services

Additional Services

1 service
Specialized Services

Amenities & Lifestyle

Outdoor Patio Area
Ice Cream Parlor
Cinema Room & Library
Laundry Services
Salon And Barber Shop
Housekeeping Services
Religious Programs
Leisure & Social Activities

Contact Chateau Nursing and Rehabilitation Center

Staffing Data

Reporting period: October 1 – December 31, 2025 (Q4 2025). Source: CMS Payroll-Based Journal report.

Total staff 177
Employees 148
Contractors 29
Staff to resident ratio 1.51 : 1
16% fewer staff per resident than Illinois average
Illinois average ratio: 1.80 : 1 Illinois average ratio: 1.80 : 1See full Illinois ranking
Avg staff/day 63
Average shift 7.7 hours
0% compared with Illinois average
Illinois average: 7.6 hours Illinois average shift: 7.6 hoursSee full Illinois ranking
Total staff hours (quarter) 44,740

Nursing staff breakdown

Q4 2025 · Oct 1 – Dec 31 More info This data comes from the CMS Payroll-Based Journal report covering October 1 – December 31, 2025.
Registered Nurse

Manages medical care and health needs.

RN Staff Info 20 total: 19 full-time employees and 1 contractor. 20
Average shift length Info Average shift length. Calculated as total hours divided by days worked and average staff per day. 9 hours
Licensed Practical Nurse

Assists with medical care and medications.

LPN Staff Info 28 total: 26 full-time employees and 2 contractors. 28
Average shift length Info Average shift length. Calculated as total hours divided by days worked and average staff per day. 7.9 hours
Certified Nursing Assistant

Helps with daily care and mobility.

CNA Staff Info 88 total: 87 full-time employees and 1 contractor. 88
Average shift length Info Average shift length. Calculated as total hours divided by days worked and average staff per day. 7.8 hours

Contractor staffing

Q4 2025 · Oct 1 – Dec 31 More info This data comes from the CMS Payroll-Based Journal report covering October 1 – December 31, 2025.

Total hours from contractors

6.7%

2,995 contractor hours this quarter

Occupational Therapy Aide: 5 Physical Therapy Aide: 5 Physical Therapy Assistant: 4 Speech Language Pathologist: 3 Licensed Practical Nurse: 2 Qualified Social Worker: 2 Clinical Nurse Specialist: 2 Registered Nurse: 1 Medical Director: 1 Certified Nursing Assistant: 1 Respiratory Therapy Technician: 1 Mental Health Service Worker: 1 Occupational Therapy Assistant: 1

Staff by category

Q4 2025 · Oct 1 – Dec 31 More info This data comes from the CMS Payroll-Based Journal report covering October 1 – December 31, 2025.
Certified Nursing Assistant8718822,04292100%7.8
Licensed Practical Nurse262288,13792100%7.9
Registered Nurse191206,00792100%9
Other Dietary Services Staff8082,68392100%6.7
Speech Language Pathologist0338747480%7.2
Physical Therapy Aide0558596470%7.7
RN Director of Nursing2028326874%8
Dental Services Staff1014806065%8
Mental Health Service Worker1124725863%8
Dietitian2024085155%8
Administrator1014055459%7.5
Nurse Practitioner1014055459%7.5
Physical Therapy Assistant0443165459%5.8
Qualified Social Worker0222614246%5.9
Respiratory Therapy Technician0112434246%5.8
Occupational Therapy Aide0551944751%3.4
Clinical Nurse Specialist02266910%7.3
Occupational Therapy Assistant0113533%11.5
Medical Director0112233%7.3
88 Certified Nursing Assistant
% of Days 100%
28 Licensed Practical Nurse
% of Days 100%
20 Registered Nurse
% of Days 100%
8 Other Dietary Services Staff
% of Days 100%
3 Speech Language Pathologist
% of Days 80%
5 Physical Therapy Aide
% of Days 70%
2 RN Director of Nursing
% of Days 74%
1 Dental Services Staff
% of Days 65%
2 Mental Health Service Worker
% of Days 63%
2 Dietitian
% of Days 55%
1 Administrator
% of Days 59%
1 Nurse Practitioner
% of Days 59%
4 Physical Therapy Assistant
% of Days 59%
2 Qualified Social Worker
% of Days 46%
1 Respiratory Therapy Technician
% of Days 46%
5 Occupational Therapy Aide
% of Days 51%
2 Clinical Nurse Specialist
% of Days 10%
1 Occupational Therapy Assistant
% of Days 3%
1 Medical Director
% of Days 3%

Penalties and fines

Includes penalties issued in 2025

Federal penalties imposed by CMS for regulatory violations, including civil money penalties (fines) and denials of payment for new Medicare/Medicaid admissions.

Source: CMS Penalties Database (Data as of Jan 2026)

Total fines amount $38K Rank #76 / 173Federal fines — State benchmarkedThis home is ranked 76th out of 173 homes in Illinois. Shows this facility's cumulative CMS federal fine dollars versus the Illinois average among facilities with fines, and where it ranks among 173 facilities in the pool. Lower total dollars mean a better rank.Ranking totals vary by category as each rank only includes facilities that report data for that metric. Homes missing that data point aren't included in the ranking.Click the rank badge to see the full State ranking.Click here to see the full State ranking.
73% lower than Illinois average

Illinois average: $143K

Number of fines 2
33% fewer fines than Illinois average

Illinois average: 3.0

Payment Denials Info Serious action where Medicare and/or Medicaid temporarily stops payments for new residents until issues are fixed. 0
100% fewer payment denials than Illinois average

Illinois average: 1.1

Fines amount comparison
This facility $38K
Illinois average $143K
Penalty History

Penalties are imposed by CMS for violations of federal nursing home regulations.

1 penalty in the past 3 years

Mar 13, 2025 · $16K

Civil Money Penalty Info Fines imposed for noncompliance, which can be assessed per day or per instance of violation. Mar 13, 2025
$16K

Last updated: Jan 2026

Quality of care over time

These measures show how residents usually do over time at this home, based on health outcomes and preventive care.

High-risk clinical events score Info A composite score based on pressure ulcers, falls with injury, weight loss, walking ability decline, and activities of daily living decline. 12.0
24% worse than Illinois average

Illinois average: 9.7

Functional decline score Info A composite score based on activities of daily living decline, walking ability decline, and incontinence. 20.4
10% worse than Illinois average

Illinois average: 18.6

Long-stay resident measures
Below average Illinois avg: 3.6 Info CMS star rating based on long-stay quality measure performance. 5 stars = significantly above average, 1 star = significantly below average.
Need for Help with Daily Activities Increased Info Percent of long-stay residents whose need for help with daily activities has increased 21.8%
41% worse than Illinois average

Illinois average: 15.5%

Walking Ability Worsened Info Percent of long-stay residents whose ability to move independently worsened 17.8%
In line with Illinois average

Illinois average: 18.4%

Low Risk Residents with Bowel/Bladder Incontinence Info Percent of low risk long-stay residents who lose control of their bowels or bladder 21.8%
In line with Illinois average

Illinois average: 21.6%

Falls with Major Injury Info Percent of long-stay residents experiencing one or more falls with major injury 5.0%
49% worse than Illinois average

Illinois average: 3.4%

High Risk Residents with Pressure Ulcers Info Percent of long-stay high risk residents with pressure ulcers 9.4%
78% worse than Illinois average

Illinois average: 5.3%

Urinary Tract Infection Info Percent of long-stay residents with a urinary tract infection 1.4%
22% better than Illinois average

Illinois average: 1.8%

Lost Too Much Weight Info Percent of long-stay residents who lose too much weight 6.4%
In line with Illinois average

Illinois average: 6.5%

Depressive Symptoms Info Percent of long-stay residents who have depressive symptoms 97.8%
103% worse than Illinois average

Illinois average: 48.1%

Antipsychotic Use Info Percent of long-stay residents who received an antipsychotic medication 15.5%
23% better than Illinois average

Illinois average: 20.2%

Pneumococcal Vaccine Info Percent of long-stay residents assessed and appropriately given the pneumococcal vaccine 98.0%
10% better than Illinois average

Illinois average: 89.2%

Influenza Vaccine Info Percent of long-stay residents assessed and appropriately given the seasonal influenza vaccine 86.1%
6% worse than Illinois average

Illinois average: 91.6%

Hospitalizations per 1,000 days Info Number of hospitalizations per 1,000 long-stay resident days. 2.84
39% worse than Illinois average

Illinois average: 2.05

ED visits per 1,000 days Info Number of outpatient emergency department visits per 1,000 long-stay resident days. 2.54
13% worse than Illinois average

Illinois average: 2.25

Short-stay resident measures
Significantly below average Illinois avg: 2.3 Info CMS star rating based on short-stay quality measure performance. 5 stars = much above average, 1 star = much below average.
Pneumococcal Vaccine Info Percent of short-stay residents assessed and appropriately given the pneumococcal vaccine 87.4%
28% better than Illinois average

Illinois average: 68.3%

Antipsychotic medication increase Info Percent of short-stay residents who newly received an antipsychotic medication 3.3%
43% worse than Illinois average

Illinois average: 2.3%

Influenza Vaccine Info Percent of short-stay residents assessed and appropriately given the seasonal influenza vaccine 84.0%
33% better than Illinois average

Illinois average: 63.0%

Re-hospitalized after SNF stay Info Percentage of short-stay residents who were re-hospitalized after their nursing home admission. 19.4%
26% better than Illinois average

Illinois average: 26.2%

Emergency department visits Info Percentage of short-stay residents who had an outpatient emergency department visit. 11.2%
20% better than Illinois average

Illinois average: 14.0%

Falls with major injury Info Percentage of SNF residents who experience falls with major injury during their stay. 0.0%
100% better than Illinois average

Illinois average: 0.8%

Ability to care for self at discharge Info Percentage of residents at or above expected ability to care for themselves at discharge. 42.9%
20% worse than Illinois average

Illinois average: 53.7%

Successful return to home or community Info Rate of successful return to home or community from a skilled nursing facility. 45.6%
10% worse than Illinois average

Illinois average: 50.6%

Breakdown by payment type

Medicare

28% of new residents, usually for short-term rehab.

Typical stay 2 - 3 months

Private pay

18% of new residents, often for short stays.

Typical stay 3 - 4 months

Medicaid

54% of new residents, often for long-term daily care.

Typical stay 8 - 9 months

Facility Characteristics

Source: CMS Long-Term Care Facility Characteristics (Data as of Jan 2026)

Total residents 117
Medicare
9
7.7% of residents
Medicaid
96
82.1% of residents
Private pay or other
12
10.3% of residents
Programs & Services
Residents Group

Residents meet regularly to discuss policies, care quality, and activities

Active Resident Council

Organized group of residents that meets regularly to discuss facility policies, quality of life, and activities.

Finances and operations

Based on CMS SNF Cost Report for fiscal year ending in 12/2023.

Privately-owned community
Operated by a single business entity.
Net patient revenue Info Net patient revenue — what the home actually collects for resident care, after contractual allowances, bad debt and discounts are subtracted from its gross charges (CMS cost report, Worksheet G-3). It covers resident care only; money the home earns from other sources is shown separately as "Other income."
$12.1M
Net patient income Info Net patient income: net patient revenue minus the home's total operating expenses. A positive figure means it earns more from resident care than it spends to deliver it; a negative figure means the opposite. It excludes non-operating "other income."
-$1.9M
Privately-owned community Operated by a single business entity.
Net patient revenue Info Net patient revenue — what the home actually collects for resident care, after contractual allowances, bad debt and discounts are subtracted from its gross charges (CMS cost report, Worksheet G-3). It covers resident care only; money the home earns from other sources is shown separately as "Other income."
$12.1M Rank #90 / 171Revenue — State benchmarkedThis home is ranked 90th out of 171 homes in Illinois. Shows this facility's annual revenue compared to the Illinois average. Higher revenue generally means more resources for staffing and capital — read alongside Payroll %.Ranking totals vary by category as each rank only includes facilities that report data for that metric. Homes missing that data point aren't included in the ranking.Click the rank badge to see the full State ranking.Click here to see the full State ranking.
Net patient income Info Net patient income: net patient revenue minus the home's total operating expenses. A positive figure means it earns more from resident care than it spends to deliver it; a negative figure means the opposite. It excludes non-operating "other income."
-$1.9M
Other income Info Money the home earns outside of resident care — such as investments, grants, rentals and other non-operating sources (CMS cost report, Worksheet G-3). It is tracked separately from net patient revenue: it is not part of that figure, and it is not included in net patient income.
$798.5K
Payroll costs Info Staff salaries plus wage-related costs — benefits such as payroll taxes, health insurance and retirement — from the home's own accounting records (CMS cost report, Worksheet A). Contract or agency labor is counted separately, under other operating costs. Rank #52 / 171Payroll — State benchmarkedThis home is ranked 52nd out of 171 homes in Illinois. Shows total annual staff payroll benchmarked to the Illinois average. Higher payroll investment relative to peers often signals better staffing and less reliance on cheaper contract labor.Ranking totals vary by category as each rank only includes facilities that report data for that metric. Homes missing that data point aren't included in the ranking.Click the rank badge to see the full State ranking.Click here to see the full State ranking.
$7.4M 61.4% of net patient revenue Info Payroll as a share of revenue: staff salaries and wage-related benefits divided by net patient revenue. A higher figure means more of each revenue dollar goes to staff pay. Rank #26 / 171Payroll % — State benchmarkedThis home is ranked 26th out of 171 homes in Illinois. Shows payroll as a percentage of revenue versus the Illinois average. Well-run Illinois facilities typically land around 54–67% — the top third Statewide. Below 25% may signal understaffing or heavy agency use — read with Staffing ratings.Ranking totals vary by category as each rank only includes facilities that report data for that metric. Homes missing that data point aren't included in the ranking.Click the rank badge to see the full State ranking.Click here to see the full State ranking.
Other operating costs Info Everything it costs to run the home apart from payroll — food, utilities, supplies, maintenance, contract labor and administration. Calculated as total operating expense minus payroll (staff salaries and wage-related benefits).
$6.6M
Total costs Info The home's total operating expense for the year — all the costs of running it, salaries included (CMS cost report, Worksheet G-3).
$14.0M

What does this home offer?

Housing options icon

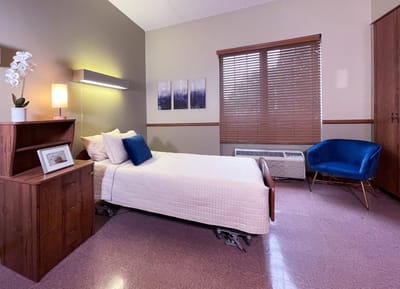
Housing Options: Private / Semi-Private Rooms

Building type icon
Building type icon

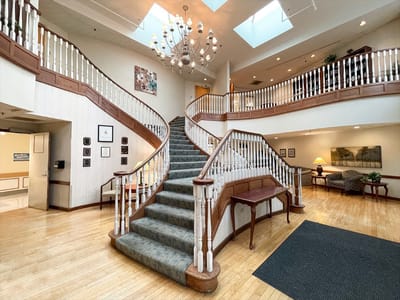
Building Type: 2-story
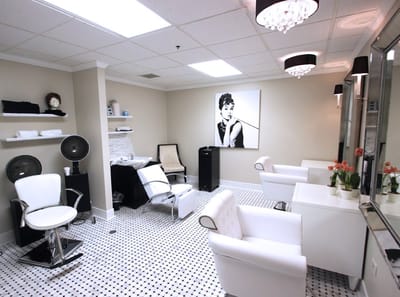
Beauty services icon

Beauty Services

Housekeeping icon
Housekeeping icon

Housekeeping Services

Recreational activities icon

Recreational Activities

Exercise program icon

Exercise Programs

Who this home usually serves

TYPE OF STAY

Mostly long-term care residents

Most residents stay for extended periods and receive ongoing daily care.

Most new residents arrive under Medicaid (54% of admissions), and a typical Medicaid stay runs around 8 - 9 months.

Admissions
237 total

Coverage residents most often arrive under.

Medicare 28%
Private pay 18%
Medicaid 54%
Discharges
123 total

Coverage residents most often leave under.

Medicare 32%
Private pay 29%
Medicaid 39%

Places of interest near Chateau Nursing and Rehabilitation Center

Address 7.7 miles from city center Info Estimated distance in miles from Willowbrook's city center to Chateau Nursing and Rehabilitation Center's address, calculated via Google Maps.

Calculate Travel Distance to Chateau Nursing and Rehabilitation Center

Add your location

Address

Compare Nursing Home around Dupage County

The information below is reported by the Illinois Department of Public Health, Office of Health Care Regulation.

5 facilities compared · CMS & IL Dept. of Health data

Burgess Square Healthcare & Rehab Centre
NH
Westmont
203
Facility 203
IL AVG 86
Rank #26 / 426
57.4%
Facility 57.4%
IL AVG 69.3%
Rank #162 / 204
-17%
4.52
Facility 4.52
IL AVG 3.10
Rank #32 / 172
+52%+46%
$0
Facility $0
IL AVG $151.3k
Rank #1 / 173
23
Facility 23
IL AVG 36.8
Rank #54 / 172
3.8
Facility 3.8
IL AVG 3.7
Rank #103 / 172
1125-
58
Facility 58
IL AVG 51
Rank #253 / 648
Michael Hensley
$21.5M
Facility $21.5M
IL AVG $12.2M
Rank #27 / 171
$12.0M
Facility $12.0M
IL AVG $4.8M
Rank #19 / 171
55.8%
Facility 55.8%
IL AVG 44.3%
Rank #98 / 171
145219
Covenant Living at Windsor Park
NH
AL
IL
MC
RC
Carol Stream
72
Facility 72
IL AVG 86
Rank #209 / 426
95.8%
Facility 95.8%
IL AVG 69.3%
Rank #22 / 204
+38%
4.21
Facility 4.21
IL AVG 3.10
Rank #37 / 172
+29%+36%
$50.5k
Facility $50.5k
IL AVG $151.3k
Rank #106 / 173
18
Facility 18
IL AVG 36.8
Rank #34 / 172
3.6
Facility 3.6
IL AVG 3.7
Rank #91 / 172
265-
26
Facility 26
IL AVG 51
Rank #523 / 648
Covenant Living At Windsor Park
$10.7M
Facility $10.7M
IL AVG $12.2M
Rank #76 / 171
$6.0M
Facility $6.0M
IL AVG $4.8M
Rank #72 / 171
56.1%
Facility 56.1%
IL AVG 44.3%
Rank #75 / 171
145606
Chateau Nursing and Rehabilitation Center
NH
MC
NC
PC
Willowbrook
150
Facility 150
IL AVG 86
Rank #51 / 426
74.6%
Facility 74.6%
IL AVG 69.3%
Rank #103 / 204
+8%
2.48
Facility 2.48
IL AVG 3.10
Rank #129 / 172
-20%-20%
$10.5k
Facility $10.5k
IL AVG $151.3k
Rank #76 / 173
35
Facility 35
IL AVG 36.8
Rank #99 / 172
3.9
Facility 3.9
IL AVG 3.7
Rank #117 / 172
2125-
28
Facility 28
IL AVG 51
Rank #509 / 648
Rothner Health Ventures G II, LLC
$12.1M
Facility $12.1M
IL AVG $12.2M
Rank #90 / 171
$7.4M
Facility $7.4M
IL AVG $4.8M
Rank #52 / 171
61.4%
Facility 61.4%
IL AVG 44.3%
Rank #26 / 171
145614
Westmont Manor Health and Rehab Center
NH
HC
NC
RC
Westmont
149
Facility 149
IL AVG 86
Rank #53 / 426
54.7%
Facility 54.7%
IL AVG 69.3%
Rank #170 / 204
-21%
2.86
Facility 2.86
IL AVG 3.10
Rank #83 / 172
-23%-8%
$92.0k
Facility $92.0k
IL AVG $151.3k
Rank #124 / 173
52
Facility 52
IL AVG 36.8
Rank #133 / 172
3.7
Facility 3.7
IL AVG 3.7
Rank #98 / 172
392-
58
Facility 58
IL AVG 51
Rank #253 / 648
Ronald Nunziato
$9.2M
Facility $9.2M
IL AVG $12.2M
Rank #117 / 171
$6.2M
Facility $6.2M
IL AVG $4.8M
Rank #80 / 171
67.9%
Facility 67.9%
IL AVG 44.3%
Rank #18 / 171
145338
West Suburban Nursing and Rehabilitation Center
NH
MC
Bloomingdale
259
Facility 259
IL AVG 86
Rank #7 / 426
67.2%
Facility 67.2%
IL AVG 69.3%
Rank #130 / 204
-3%
2.32
Facility 2.32
IL AVG 3.10
Rank #146 / 172
+31%-25%
$0
Facility $0
IL AVG $151.3k
Rank #1 / 173
35
Facility 35
IL AVG 36.8
Rank #99 / 172
4.4
Facility 4.4
IL AVG 3.7
Rank #135 / 172
2205-
60
Facility 60
IL AVG 51
Rank #233 / 648
A & F Realty LLC
$16.5M
Facility $16.5M
IL AVG $12.2M
Rank #66 / 171
$8.8M
Facility $8.8M
IL AVG $4.8M
Rank #62 / 171
53.2%
Facility 53.2%
IL AVG 44.3%
Rank #85 / 171
145333

Financial Assistance for
Nursing Home in Illinois

Chateau Nursing and Rehabilitation Center is located in Willowbrook, Illinois.
Here are the financial assistance programs available to residents in Illinois.

Get Financial aid guidance

Community Care Program

Illinois CCP

Age 60+
General Illinois resident, at risk of nursing home placement.
Income Limits (2025) ~$1,215/month individual
Asset Limits $17,500 individual, excludes home, car
IL

High demand in urban areas; waitlists possible.

Benefits
In-home care (3-5 hours/day) Adult day services ($65/day) Emergency home response systems ($30/month)

Illinois Respite Program

IL Respite (via NFCSP)

Age Caregiver of someone 60+ (or with dementia)
General Illinois resident.
Income Limits No strict limit; prioritizes low-income.
Asset Limits Not applicable.
IL

Limited slots; urban/rural balance.

Benefits
In-home respite (4-6 hours/day) Adult day care (~$65/day) Short-term facility care (up to 5 days)

Supportive Living Program (SLP)

Illinois Medicaid Supportive Living Program

Age 65+ or 22-64 with disability
General Illinois resident, Medicaid-eligible, needs moderate assistance (not nursing home-level).
Income Limits (2025) ~$2,829/month (300% FBR, individual); QIT allowed.
Asset Limits $2,000 (individual), $3,000 (couple) (excludes home, car).
IL

~200 SLP sites statewide; room/board not covered.

Benefits
Personal care (5-7 hours/day, e.g., bathing, mobility) Meals Housekeeping Medication management Respite (~240 hours/year)

Persons Who Are Elderly Waiver

Illinois Medicaid Elderly Waiver

Age 65+
General Illinois resident, Medicaid-eligible, nursing home-level care need.
Income Limits (2025) ~$2,829/month 300% FBR, individual
Asset Limits $2,000 (individual), $3,000 (couple).
IL

Part of HealthChoice Illinois; consumer-directed options available.

Benefits
Personal care (5-7 hours/day, e.g., dressing, eating) Homemaker Adult day care (~$60/day) Respite (240 hours/year) Home mods ($1,000 avg.)

Medicare Savings Program (MSP)

Illinois Medicare Savings Program

Age 65+ or disabled
General Illinois resident, Medicare Part A/B.
Income Limits (2025) ~$2,510/month (QMB), ~$3,380/month (SLMB), ~$3,598/month (QI)—individual.
Asset Limits $9,430 (individual), $14,130 (couple).
IL

Three tiers; no waitlist.

Benefits
Covers Part B premiums ($174.70/month) Deductibles ($240/year) Copays (~20%)

Optional State Supplementation (OSS)

Illinois Optional State Supplementation

Age 65+ or disabled
General Illinois resident, in approved facility, SSI recipient or low-income.
Income Limits (2025) ~$1,004/month including SSI
Asset Limits $2,000 (individual), $3,000 (couple).
IL

~$50-$500/month based on facility type.

Benefits
Cash (~$50-$500/month) for room/board in personal care homes or SLFs

VA Aid and Attendance (A&A) and Housebound Benefits

Illinois VA Aid and Attendance/Housebound

Age 65+ or disabled veteran/spouse
General Illinois resident, wartime service, need for ADL help (A&A) or homebound.
Income Limits (2025) Net income < ~$1,984/month (veteran with dependent, A&A); pension offsets income.
Asset Limits ~$155,356 net worth limit
IL

High veteran demand in urban/rural areas.

Benefits
Cash (~$1,433-$2,642/month veteran, ~$951-$1,318 spouse) for care costs (e.g., in-home, assisted living)

Frequently Asked Questions about Chateau Nursing and Rehabilitation Center

Is Chateau Nursing and Rehabilitation Center in a walkable area?

Chateau Nursing and Rehabilitation Center has a walk score of 28. Somewhat walkable. A few nearby services may be reachable on foot, but most trips require transportation.

What is the occupancy rate at Chateau Nursing and Rehabilitation Center?

Chateau Nursing and Rehabilitation Center's occupancy is 74.6%.

Are there photos of Chateau Nursing and Rehabilitation Center?

Yes — there are 8 photos of Chateau Nursing and Rehabilitation Center in the photo gallery on this page.

What is the address of Chateau Nursing and Rehabilitation Center?

Chateau Nursing and Rehabilitation Center is located at 7050 S Madison St, Willowbrook, IL 60527.

What is the phone number of Chateau Nursing and Rehabilitation Center?

(630) 323-6380 will put you in contact with the team at Chateau Nursing and Rehabilitation Center.

Is Chateau Nursing and Rehabilitation Center Medicare or Medicaid certified?

Yes — Chateau Nursing and Rehabilitation Center is a CMS-certified provider of Medicare and Medicaid.

Guides for Better Senior Living

Care Cost Calculator: See Prices in Your Area

Nursing Home Data Explorer

Don’t Wait Too Long: 7 Red Flag Signs Your Parent Needs Assisted Living Now

The True Cost of Assisted Living in 2025 – And How Families Are Paying For It

Understanding Senior Living Costs: Pricing Models, Discounts & Financial Assistance