Total health inspections
2
Kentucky average 2.9
Last Health inspection on Aug 2024

We arrange tours, appointments, and even moving support so you don’t have to
Thank you for your interest!
Our team will be in touch shortly to help with next steps.


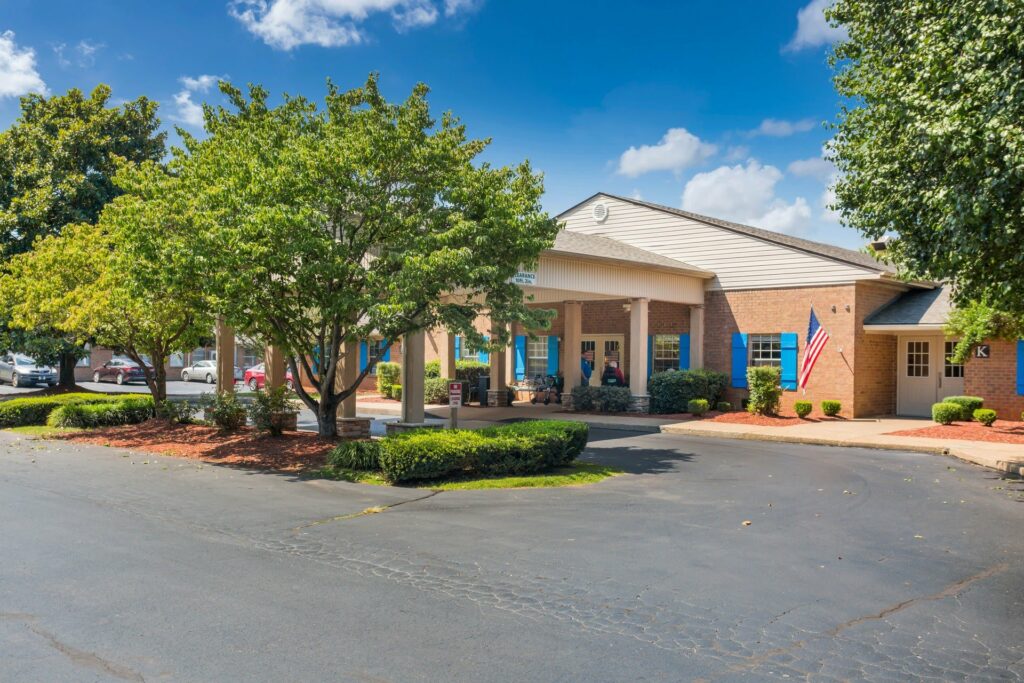
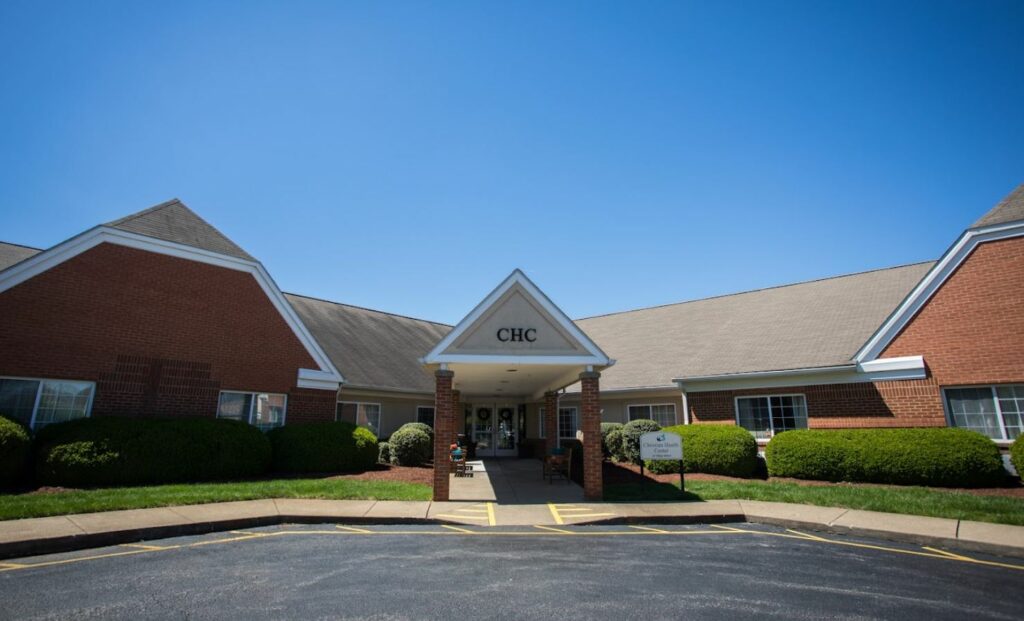
Christian Health Center of Bowling Green is a home that exemplifies southern elegance while providing exceptional nursing home care. Within this warm and inviting atmosphere, residents receive premier medical services in a setting reminiscent of a cherished home. Offering skilled nursing, personal care, and rehabilitation services, this community is dedicated to meeting the unique needs of each resident. With a team of highly skilled and compassionate therapists, they deliver tailored nursing home activities to promote well-being and engagement.
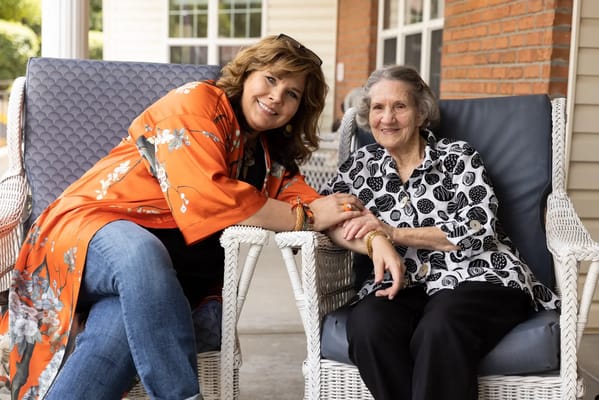
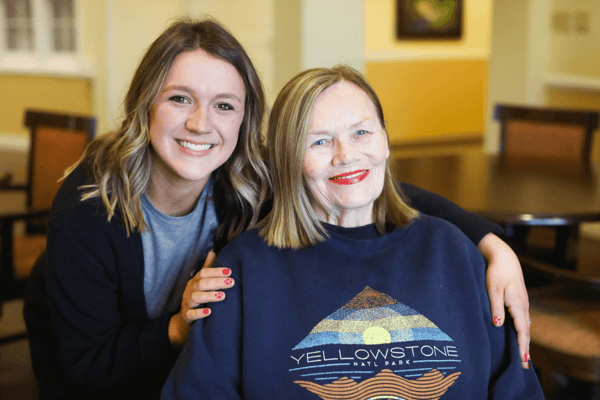
In this serene environment, residents find solace and relaxation while benefiting from a wide range of nursing home activities designed to enrich their lives. From educational classes to recreational pursuits, there are abundant avenues for staying active and engaged. Additionally, Christian Health Center of Bowling Green offers an array of amenities such as an on-site hair salon and a lovely group dining room, fostering a sense of community and connection. With a secured facility available 24 hours a day, residents can enjoy peace of mind, knowing that their safety and security are of utmost importance.
May offer a more intimate, personalized care environment.
Occupancy is moderate, suggesting balanced demand.
Most residents typically stay for a few weeks or months before returning home or moving on.
48% of new residents, usually for short-term rehab.
28% of new residents, often for short stays.
24% of new residents, often for long-term daily care.
Housing Options: Private Rooms / Semi-Private Rooms
Building Type: Single-story
Transportation Services
Fitness and Recreation
Kentucky average 2.9
Last Health inspection on Aug 2024
Kentucky average 13.5
Kentucky average 4.4
Health citations are formal notices following inspections when they fail to comply with safety and care standards.
All 2 citations resulted from standard inspections.
Kentucky average: 1.1
Kentucky average: 0.6
Data sourced from CMS Health Deficiencies reports. Citation severity codes range from A (least serious) to L (most serious). Immediate Jeopardy (J-L) citations indicate situations where the facility's noncompliance has placed residents at risk of death or serious harm.
Assisted Living A licensed, long-term care setting for seniors or individuals with disabilities who need help with daily activities — like bathing, dressing, and medication management — but not 24-hour skilled nursing. Offers housing, meals, and around-the-clock support while aiming to maximize resident independence.
Independent Living Lifestyle-focused communities for older adults offering dining, activities, and transportation with minimal personal care. Best for active, independent seniors who want community without medical support.
Memory Care Secured, specialized care for people living with Alzheimer's or dementia. Staff trained in cognitive impairment, with higher staff-to-resident ratios and an environment designed to reduce confusion and wandering risk.
Nursing Home Licensed facility providing 24/7 skilled nursing care for residents with complex, ongoing medical needs. Staffed by RNs, LPNs, and CNAs. Inspected and star-rated annually by CMS. Accepts Medicare (short-term rehab) and Medicaid (long-term care).
Assisted Living A licensed, long-term care setting for seniors or individuals with disabilities who need help with daily activities — like bathing, dressing, and medication management — but not 24-hour skilled nursing. Offers housing, meals, and around-the-clock support while aiming to maximize resident independence.
Assisted Living A licensed, long-term care setting for seniors or individuals with disabilities who need help with daily activities — like bathing, dressing, and medication management — but not 24-hour skilled nursing. Offers housing, meals, and around-the-clock support while aiming to maximize resident independence.
Independent Living Lifestyle-focused communities for older adults offering dining, activities, and transportation with minimal personal care. Best for active, independent seniors who want community without medical support.
Nursing Home Licensed facility providing 24/7 skilled nursing care for residents with complex, ongoing medical needs. Staffed by RNs, LPNs, and CNAs. Inspected and star-rated annually by CMS. Accepts Medicare (short-term rehab) and Medicaid (long-term care).
![]() 1.9 miles from city center — 0.48 miles to nearest hospital (Southern Kentucky Rehabilitation Hospital)
1.9 miles from city center — 0.48 miles to nearest hospital (Southern Kentucky Rehabilitation Hospital)
Add your location
This data corresponds to Q2 2025 and is based on CMS Payroll-Based Journal.
Kentucky average ratio: 1.75:1
Kentucky average: 8.5 hours
Manages medical care and health needs.
This role is partially covered by contractors.
Assists with medical care and medications.
This role is partially covered by contractors.
Helps with daily care and mobility.
This role is partially covered by contractors.
Total hours from contractors
3,485 contractor hours this quarter
| Certified Nursing Assistant | 57 | 1 | 58 | 10,984 | 91 | 100% | 7.8 |
| Licensed Practical Nurse | 4 | 27 | 31 | 1,694 | 85 | 93% | 9.4 |
| RN Director of Nursing | 3 | 0 | 3 | 1,250 | 72 | 79% | 8.2 |
| Registered Nurse | 9 | 1 | 10 | 1,241 | 83 | 91% | 10 |
| Medication Aide/Technician | 3 | 0 | 3 | 925 | 84 | 92% | 10.8 |
| Speech Language Pathologist | 0 | 3 | 3 | 666 | 73 | 80% | 5 |
| Physical Therapy Aide | 0 | 2 | 2 | 583 | 70 | 77% | 5.2 |
| Dietitian | 1 | 0 | 1 | 532 | 68 | 75% | 7.8 |
| Qualified Social Worker | 0 | 4 | 4 | 500 | 63 | 69% | 6 |
| Respiratory Therapy Technician | 0 | 1 | 1 | 402 | 60 | 66% | 6.7 |
| Physical Therapy Assistant | 0 | 2 | 2 | 372 | 64 | 70% | 5.6 |
| Nurse Practitioner | 1 | 0 | 1 | 358 | 56 | 62% | 6.4 |
| Administrator | 1 | 0 | 1 | 274 | 57 | 63% | 4.8 |
| Other Physician | 0 | 2 | 2 | 113 | 9 | 10% | 12.5 |
| Nurse Aide in Training | 2 | 0 | 2 | 96 | 14 | 15% | 6.8 |
| Occupational Therapy Aide | 0 | 3 | 3 | 87 | 13 | 14% | 6.7 |
| Occupational Therapy Assistant | 0 | 1 | 1 | 31 | 8 | 9% | 3.9 |
| Medical Director | 0 | 1 | 1 | 30 | 13 | 14% | 2.3 |
Source: CMS Long-Term Care Facility Characteristics (Data as of Jan 2026)
Residents meet regularly to discuss policies, care quality, and activities
State-approved Nurse Aide Training and Competency Evaluation Program on-site
Part of a Continuing Care Retirement Community offering multiple care levels
Organized group of residents that meets regularly to discuss facility policies, quality of life, and activities.
Data sourced from CMS Long-Term Care Facility Characteristics quarterly report. Payer mix reflects the current resident census by primary payment source.
These measures show how residents usually do over time at this home, based on health outcomes and preventive care.
Kentucky average: 10.5
Kentucky average: 18.9
Kentucky average: 16.8%
Kentucky average: 20.5%
Kentucky average: 3.8%
Kentucky average: 5.8%
Kentucky average: 1.9%
Kentucky average: 6.8%
Kentucky average: 14.3%
Kentucky average: 15.6%
Kentucky average: 93.9%
Kentucky average: 96.2%
Kentucky average: 83.7%
Kentucky average: 1.9%
Kentucky average: 83.6%
Quality measures are calculated from Minimum Data Set (MDS) assessments. For most measures, lower percentages indicate better care quality.
Historical financial and operational data for Christian Health Center of Bowling Green based on CMS SNF Cost Reports.
Loading trend charts...
Care Cost Calculator: See Prices in Your Area
Nursing Home Data Explorer
Don’t Wait Too Long: 7 Red Flag Signs Your Parent Needs Assisted Living Now
The True Cost of Assisted Living in 2025 – And How Families Are Paying For It
Understanding Senior Living Costs: Pricing Models, Discounts & Financial Assistance

Touring a community? Use this expert-backed checklist to stay organized, ask the right questions, and find the perfect fit.
We'll send you a PDF version of the touring checklist.