


Total staff
134
Employees
85
Contractors
49
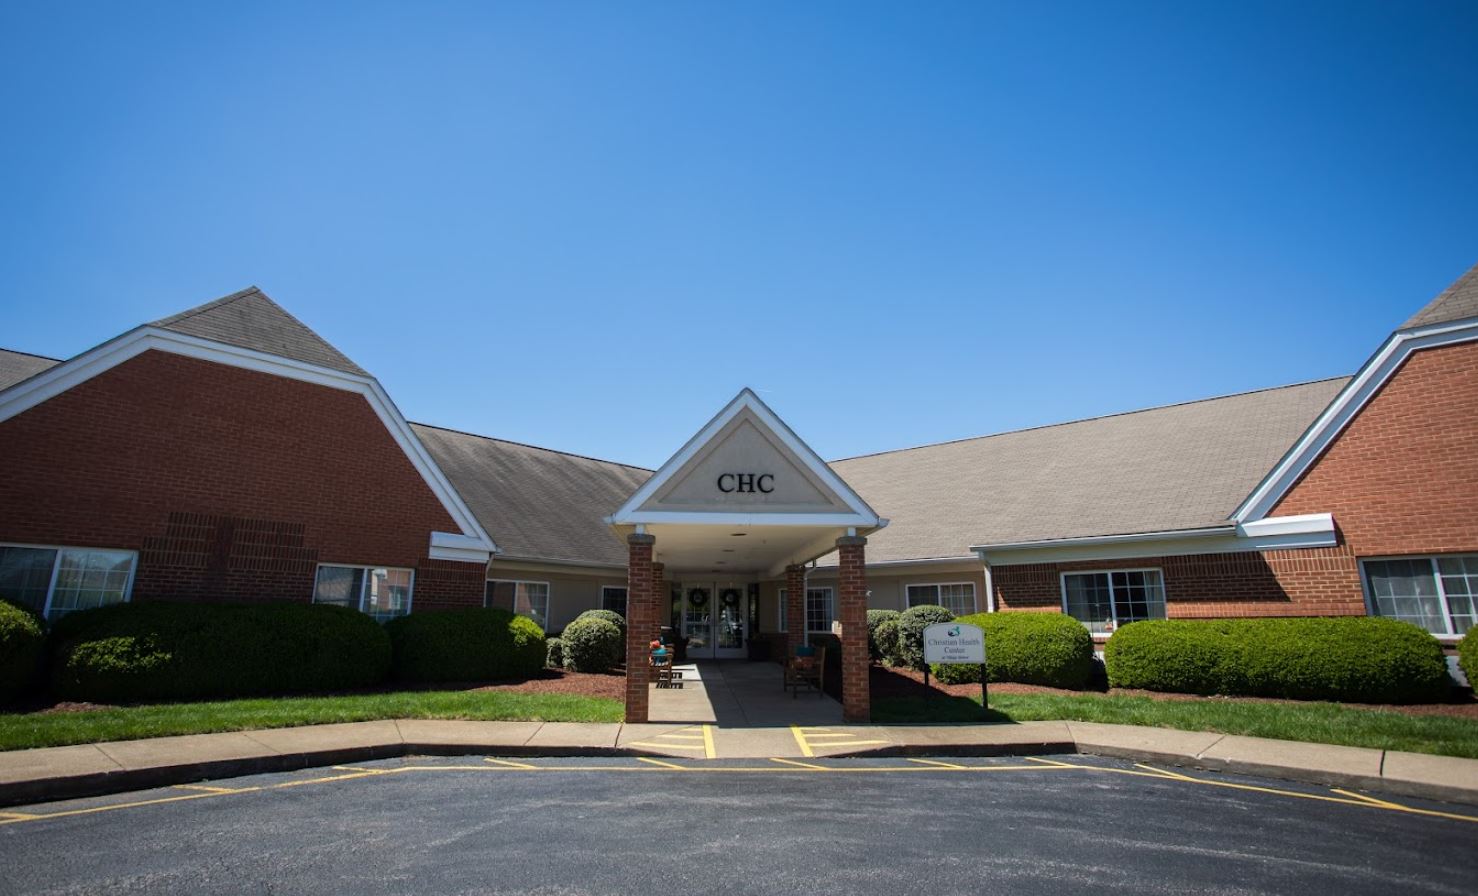
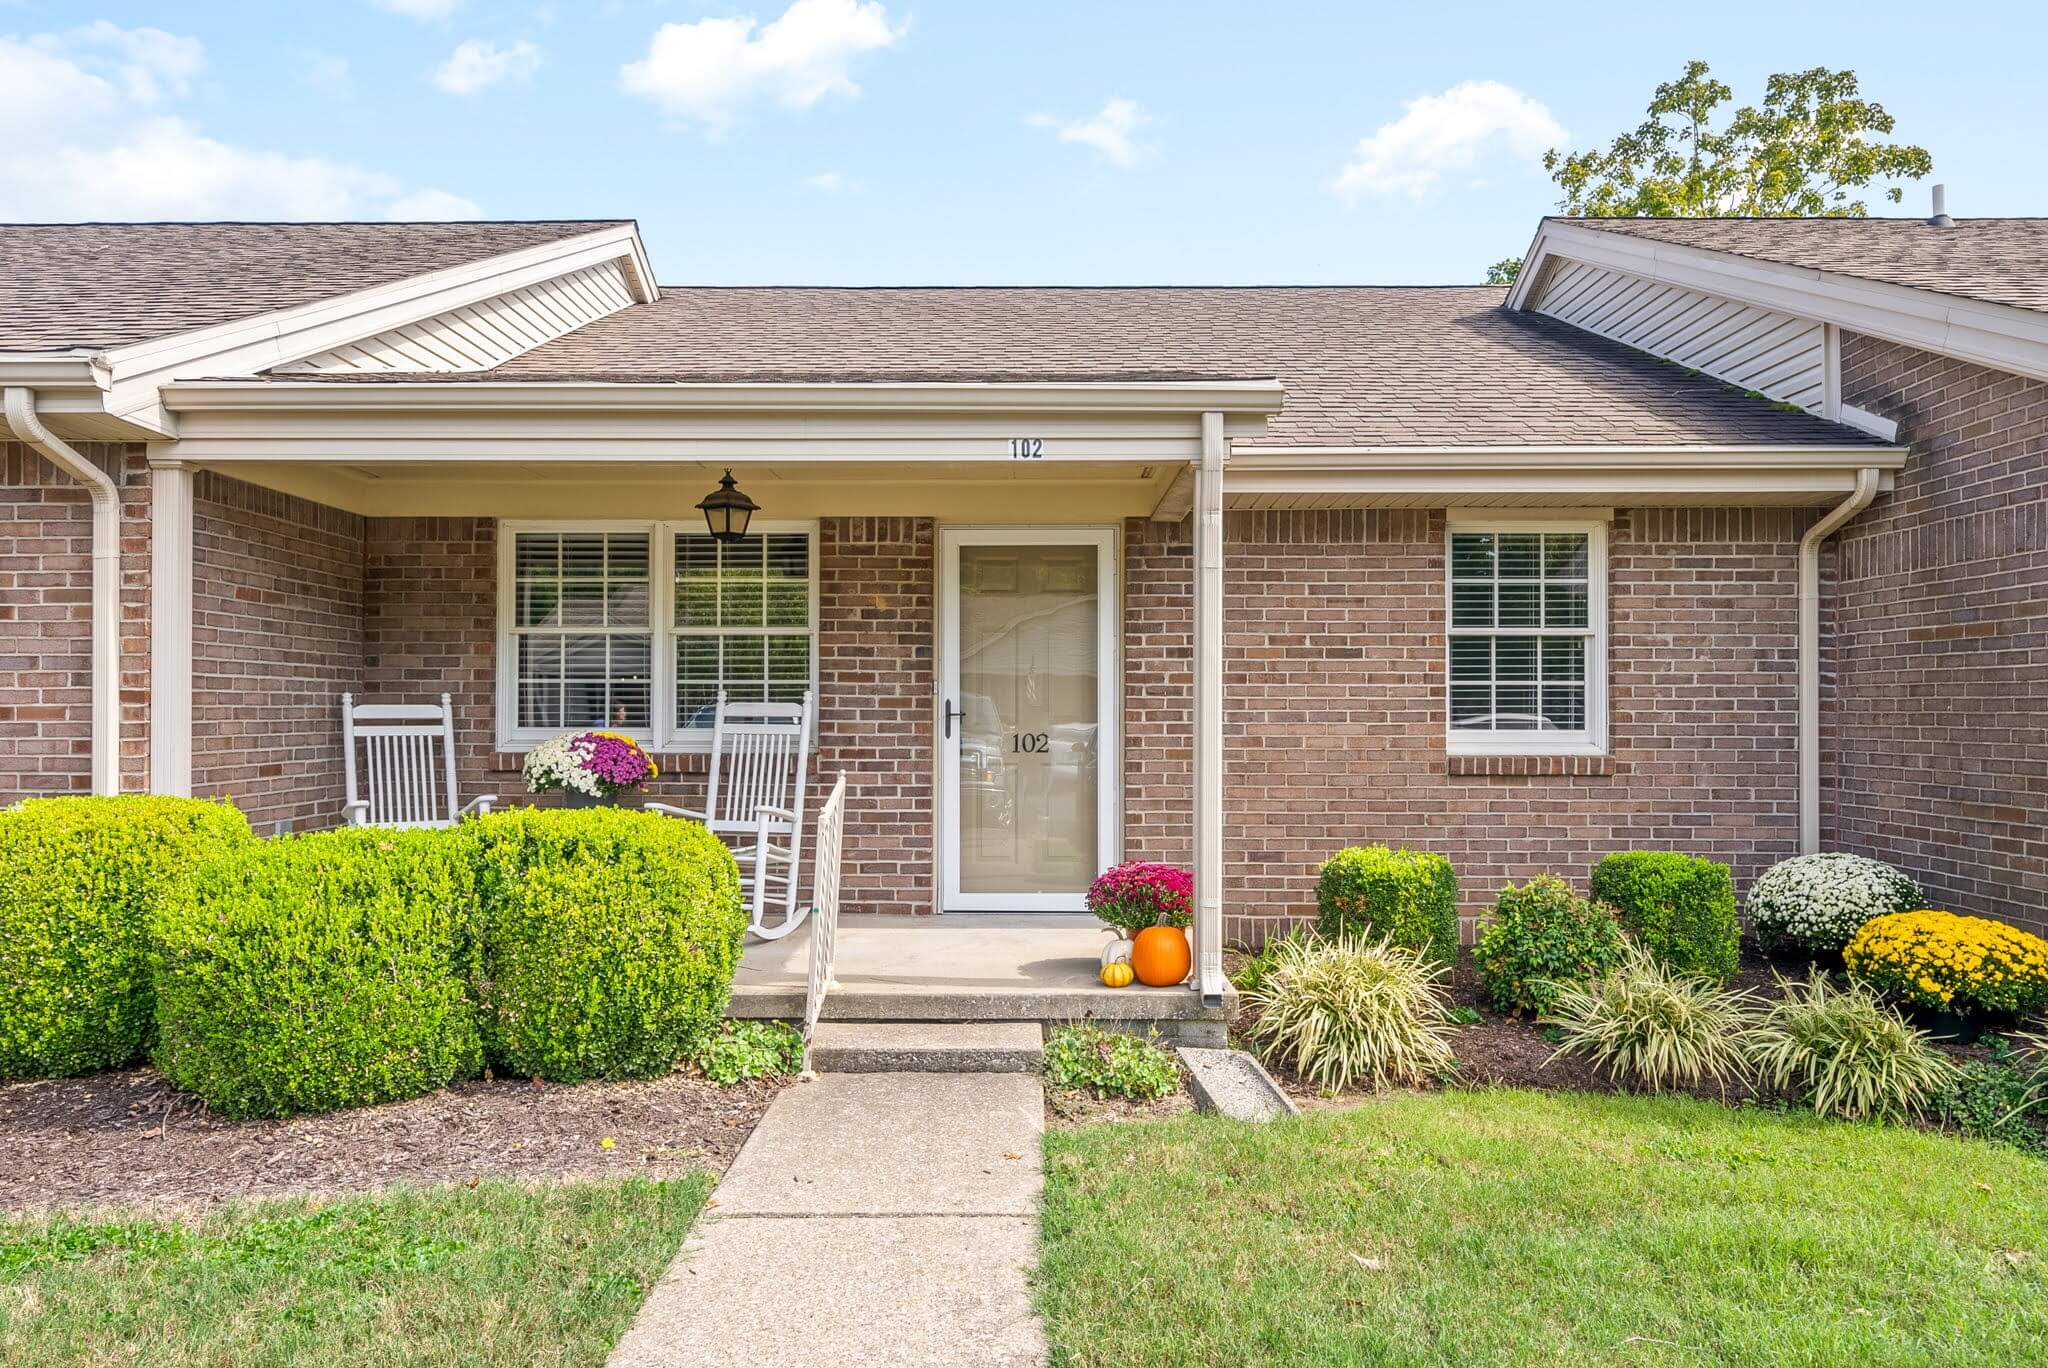
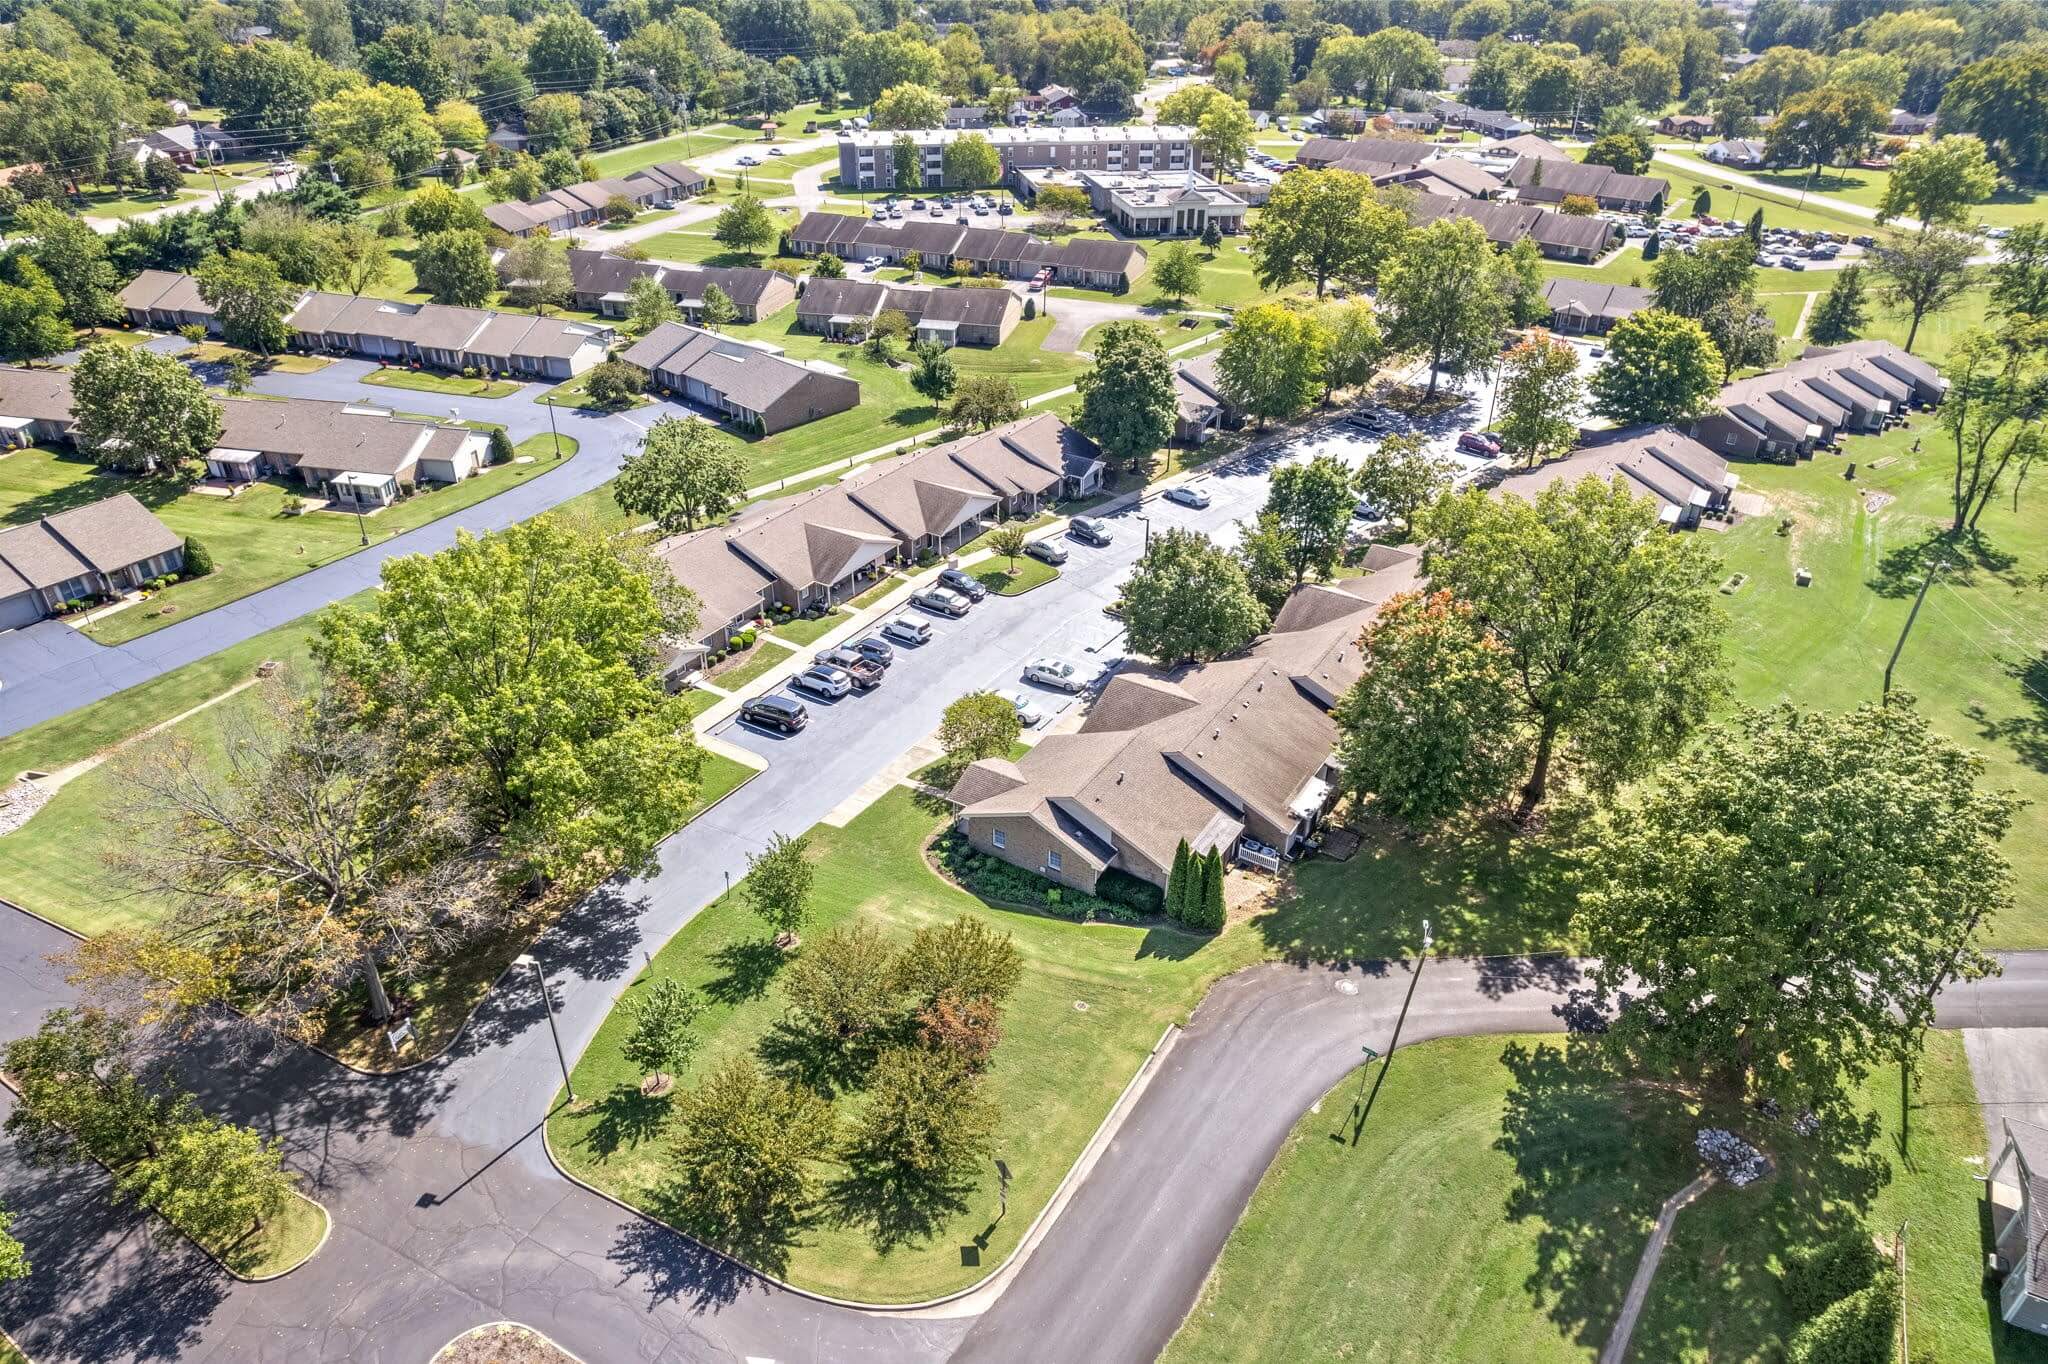
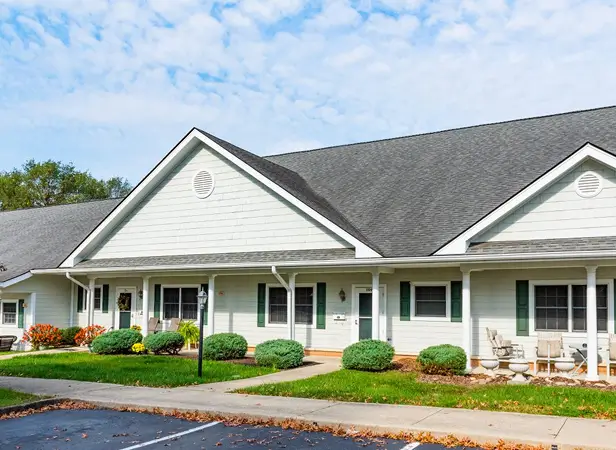
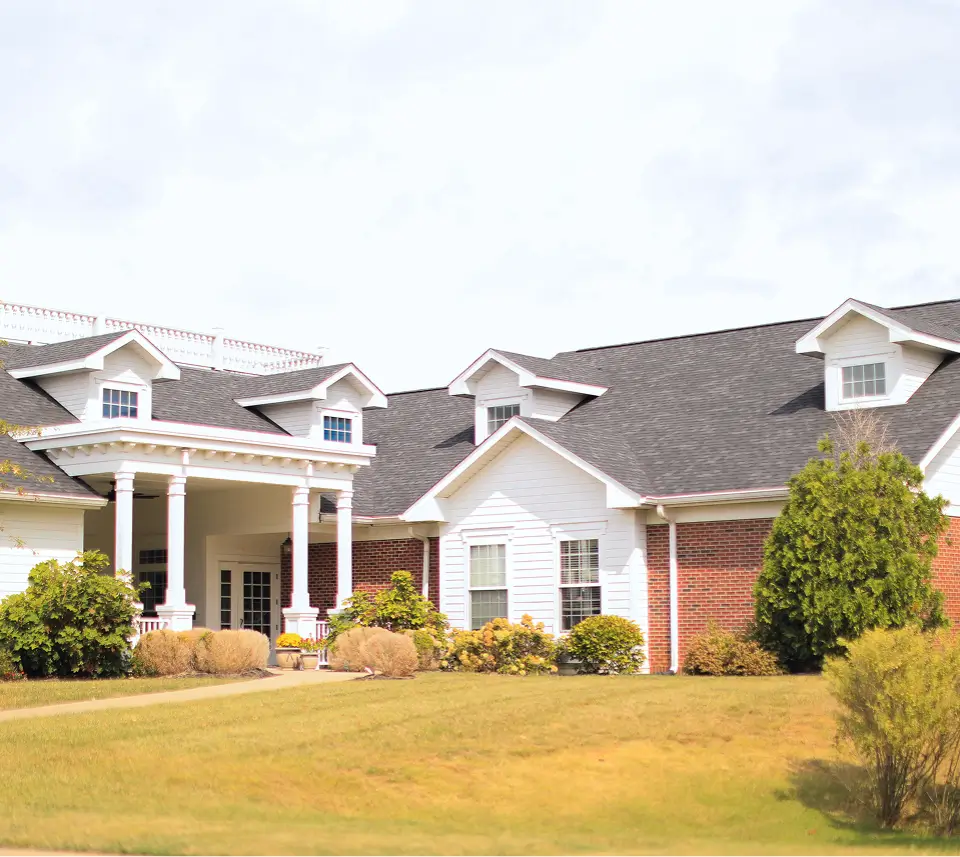
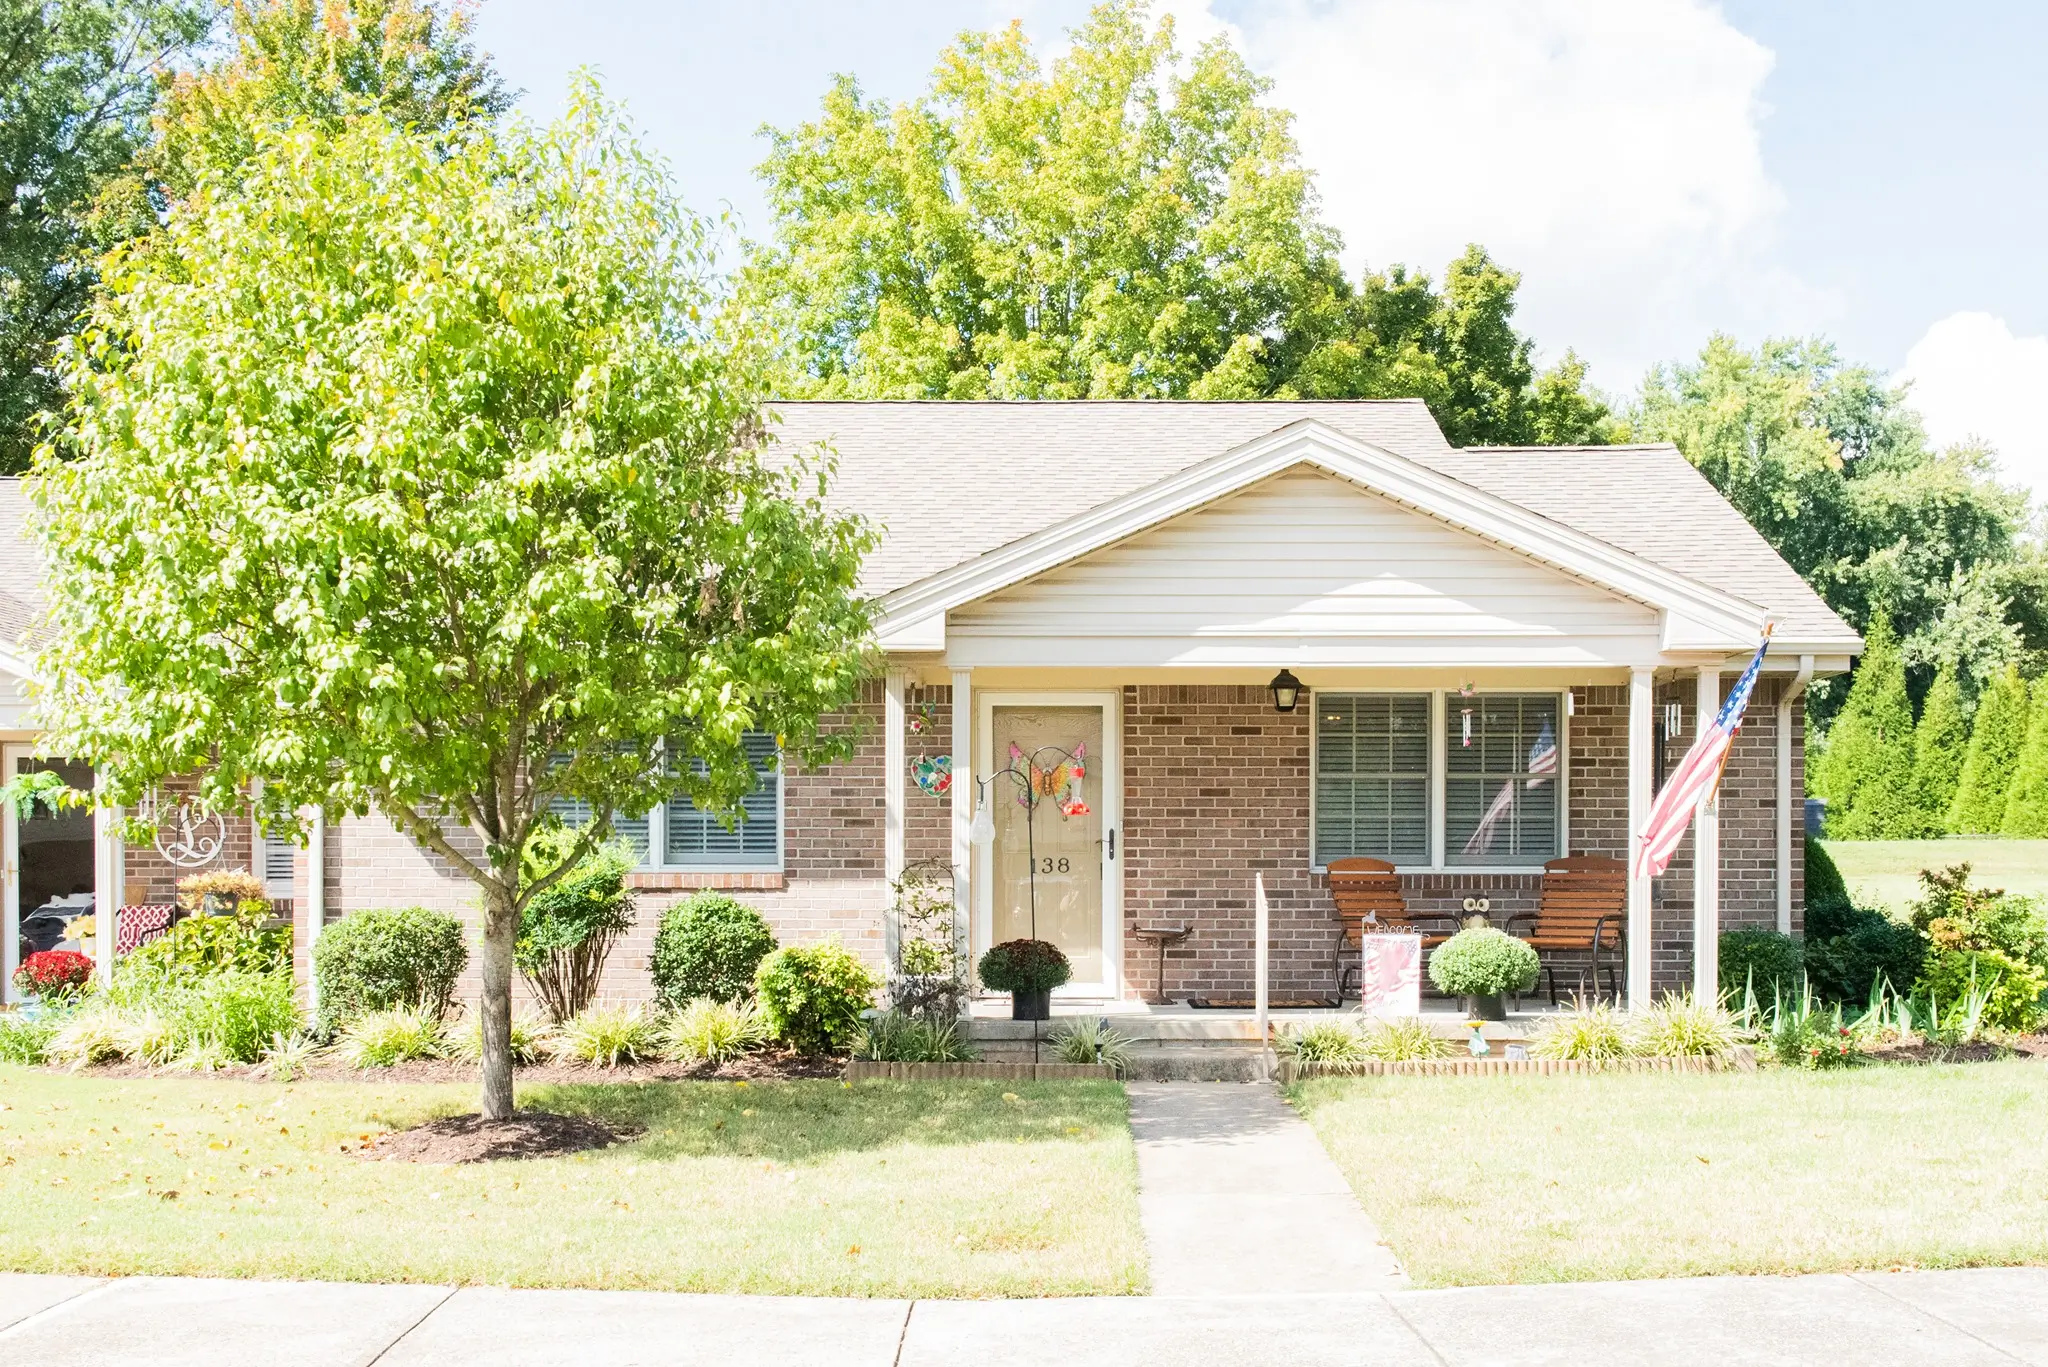
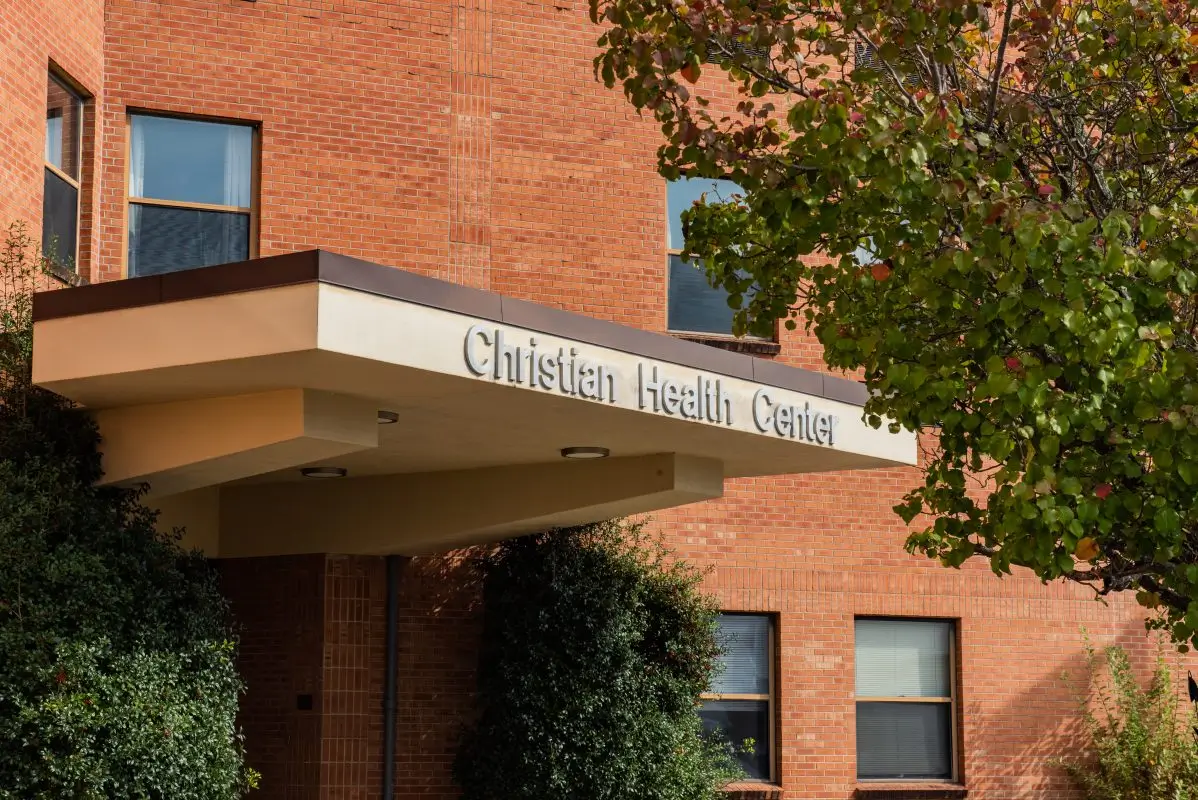

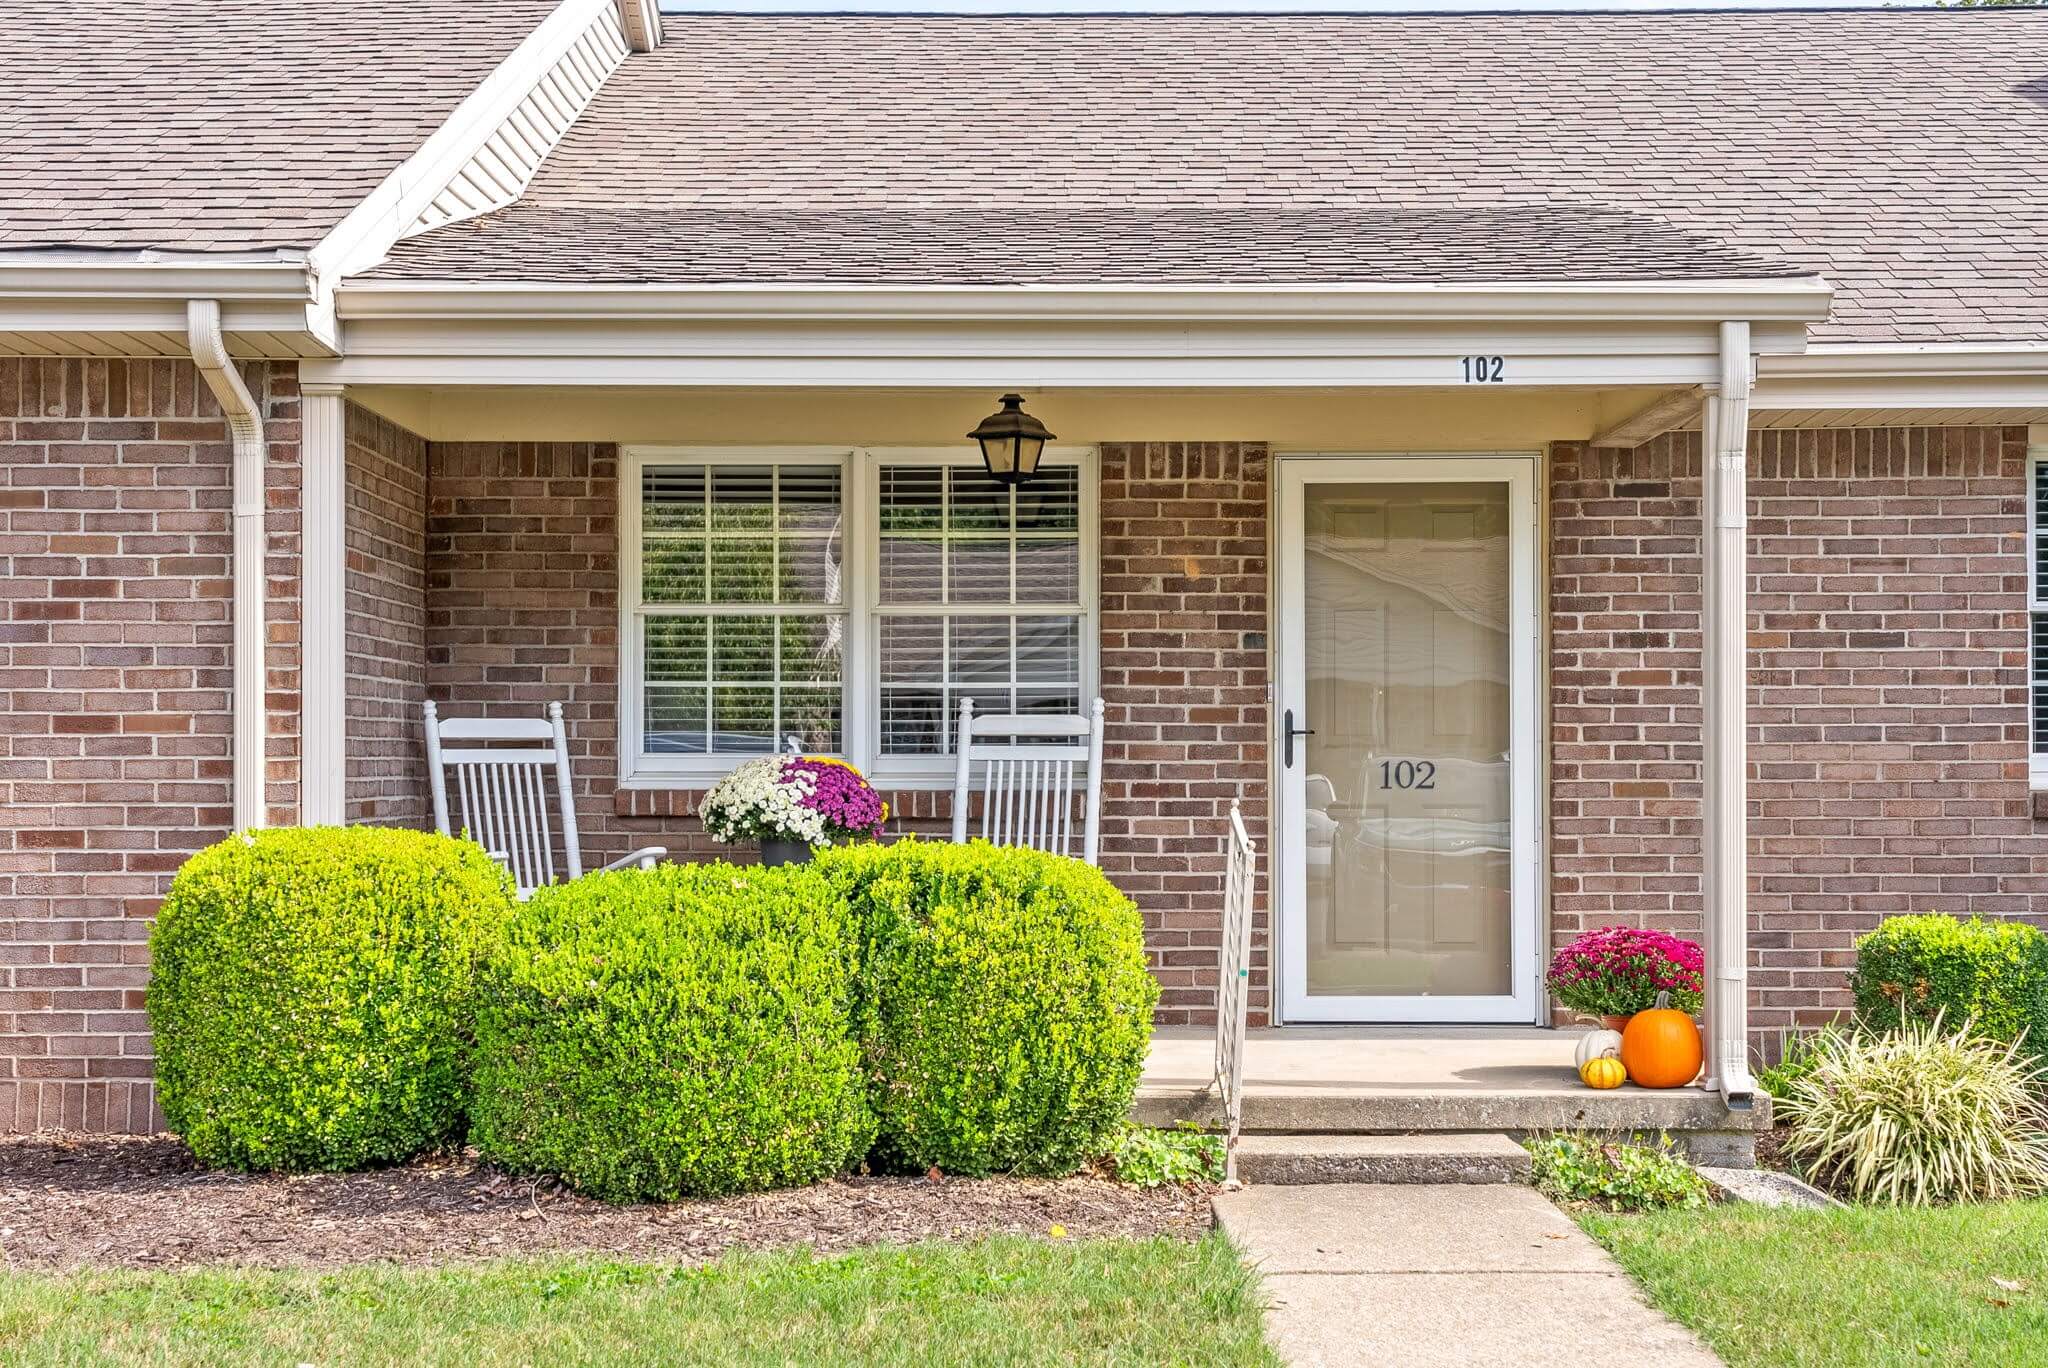
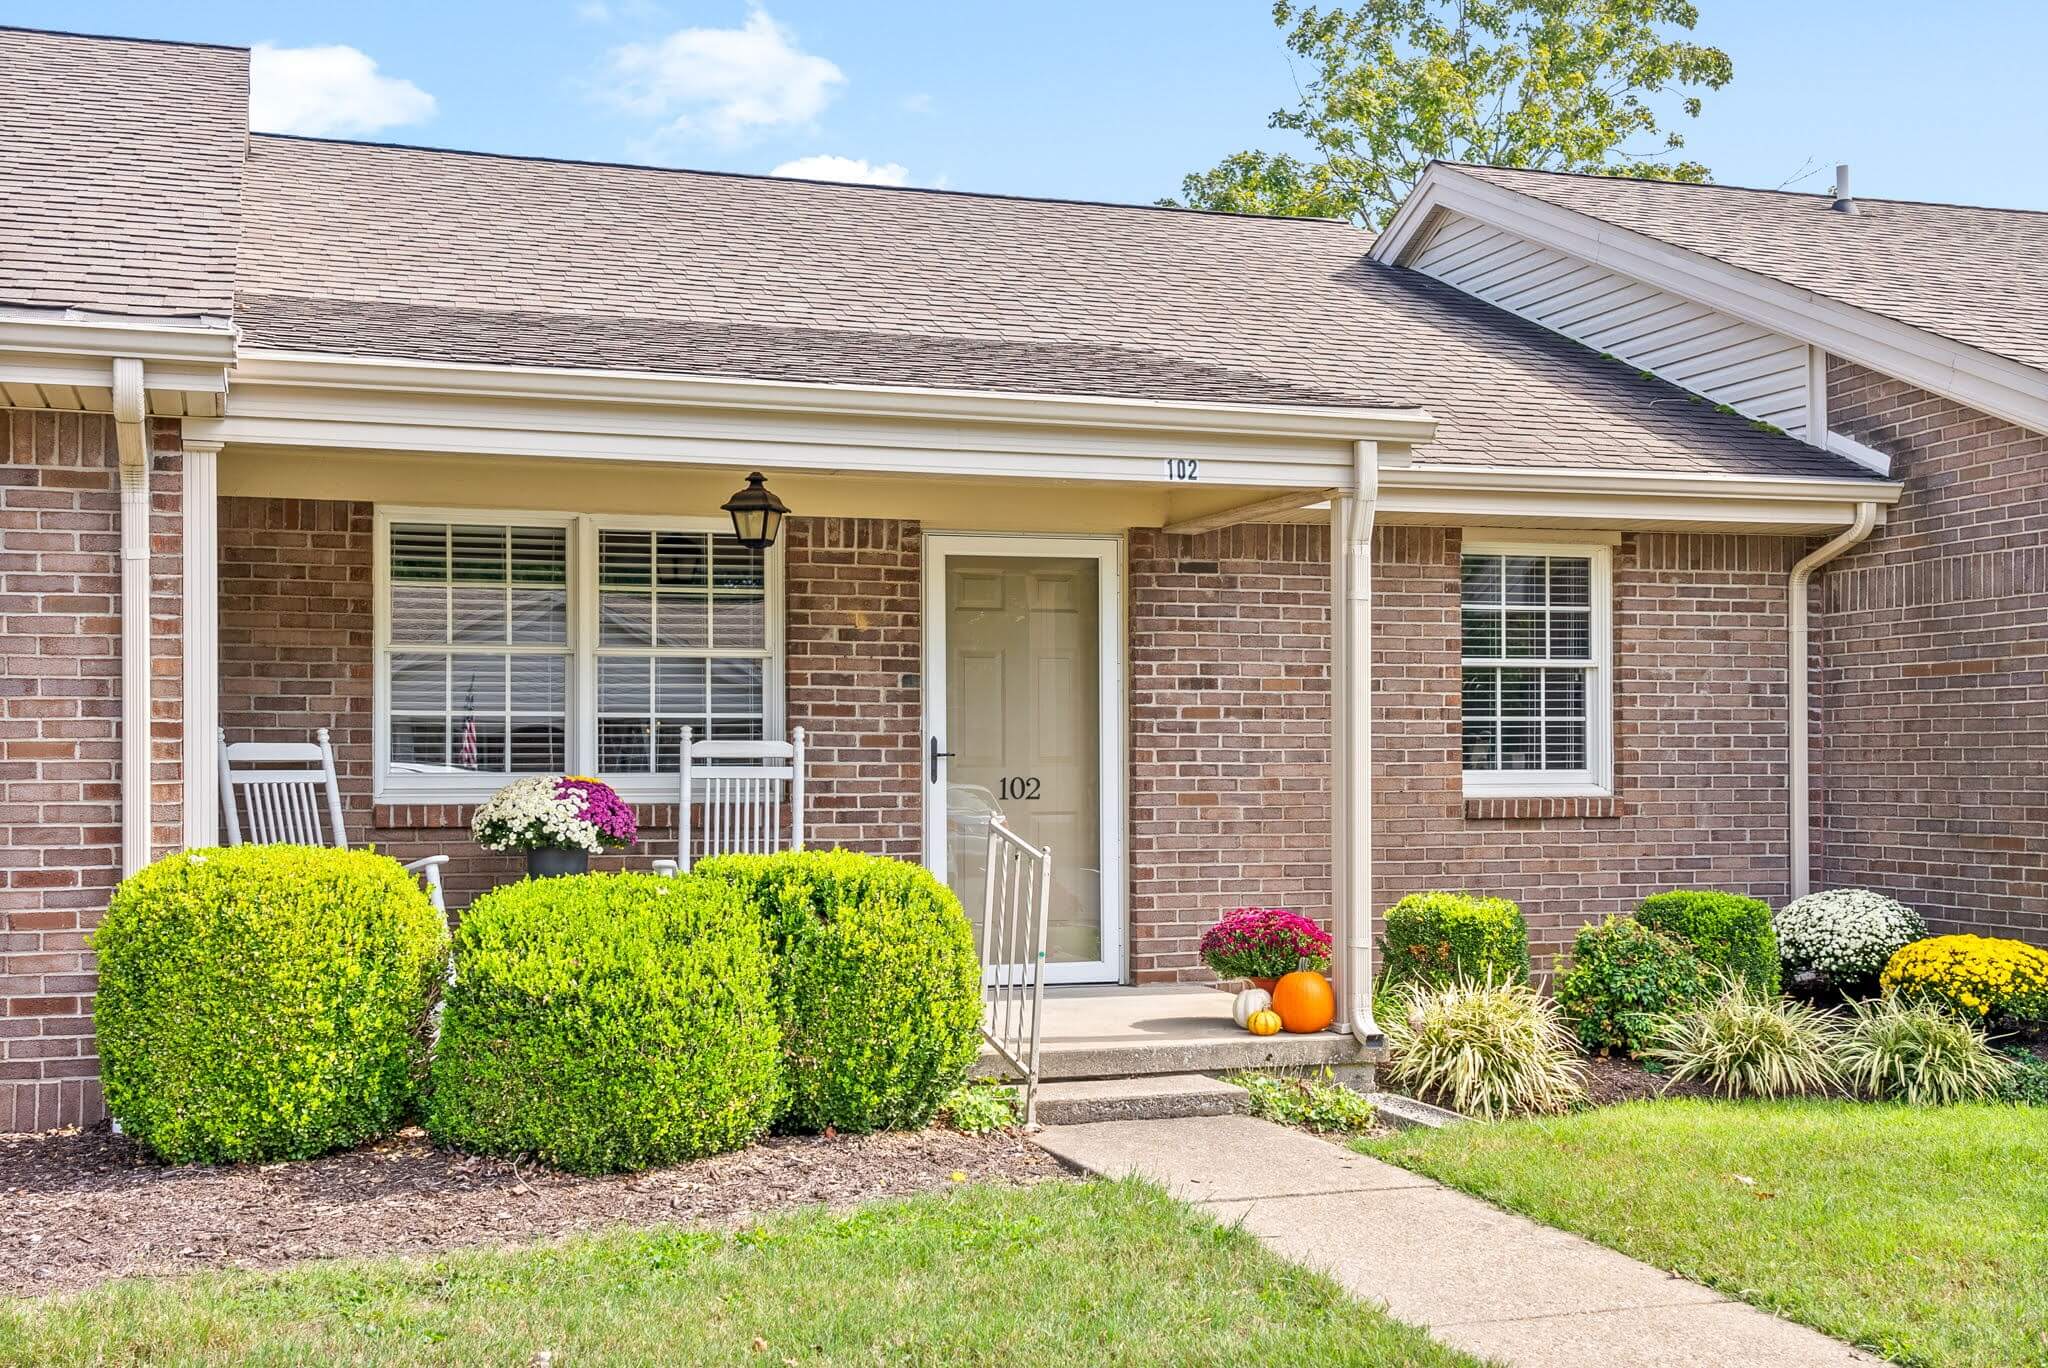
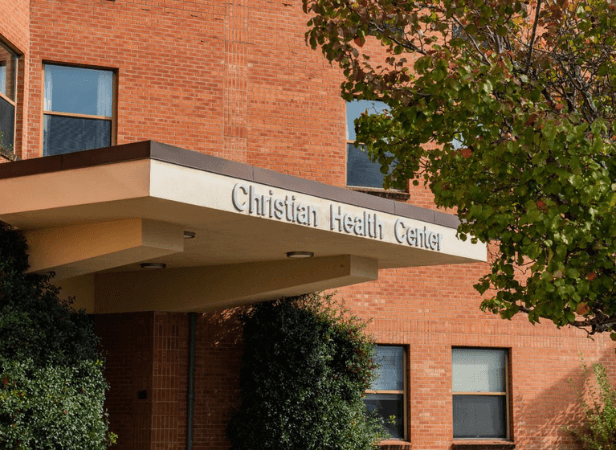
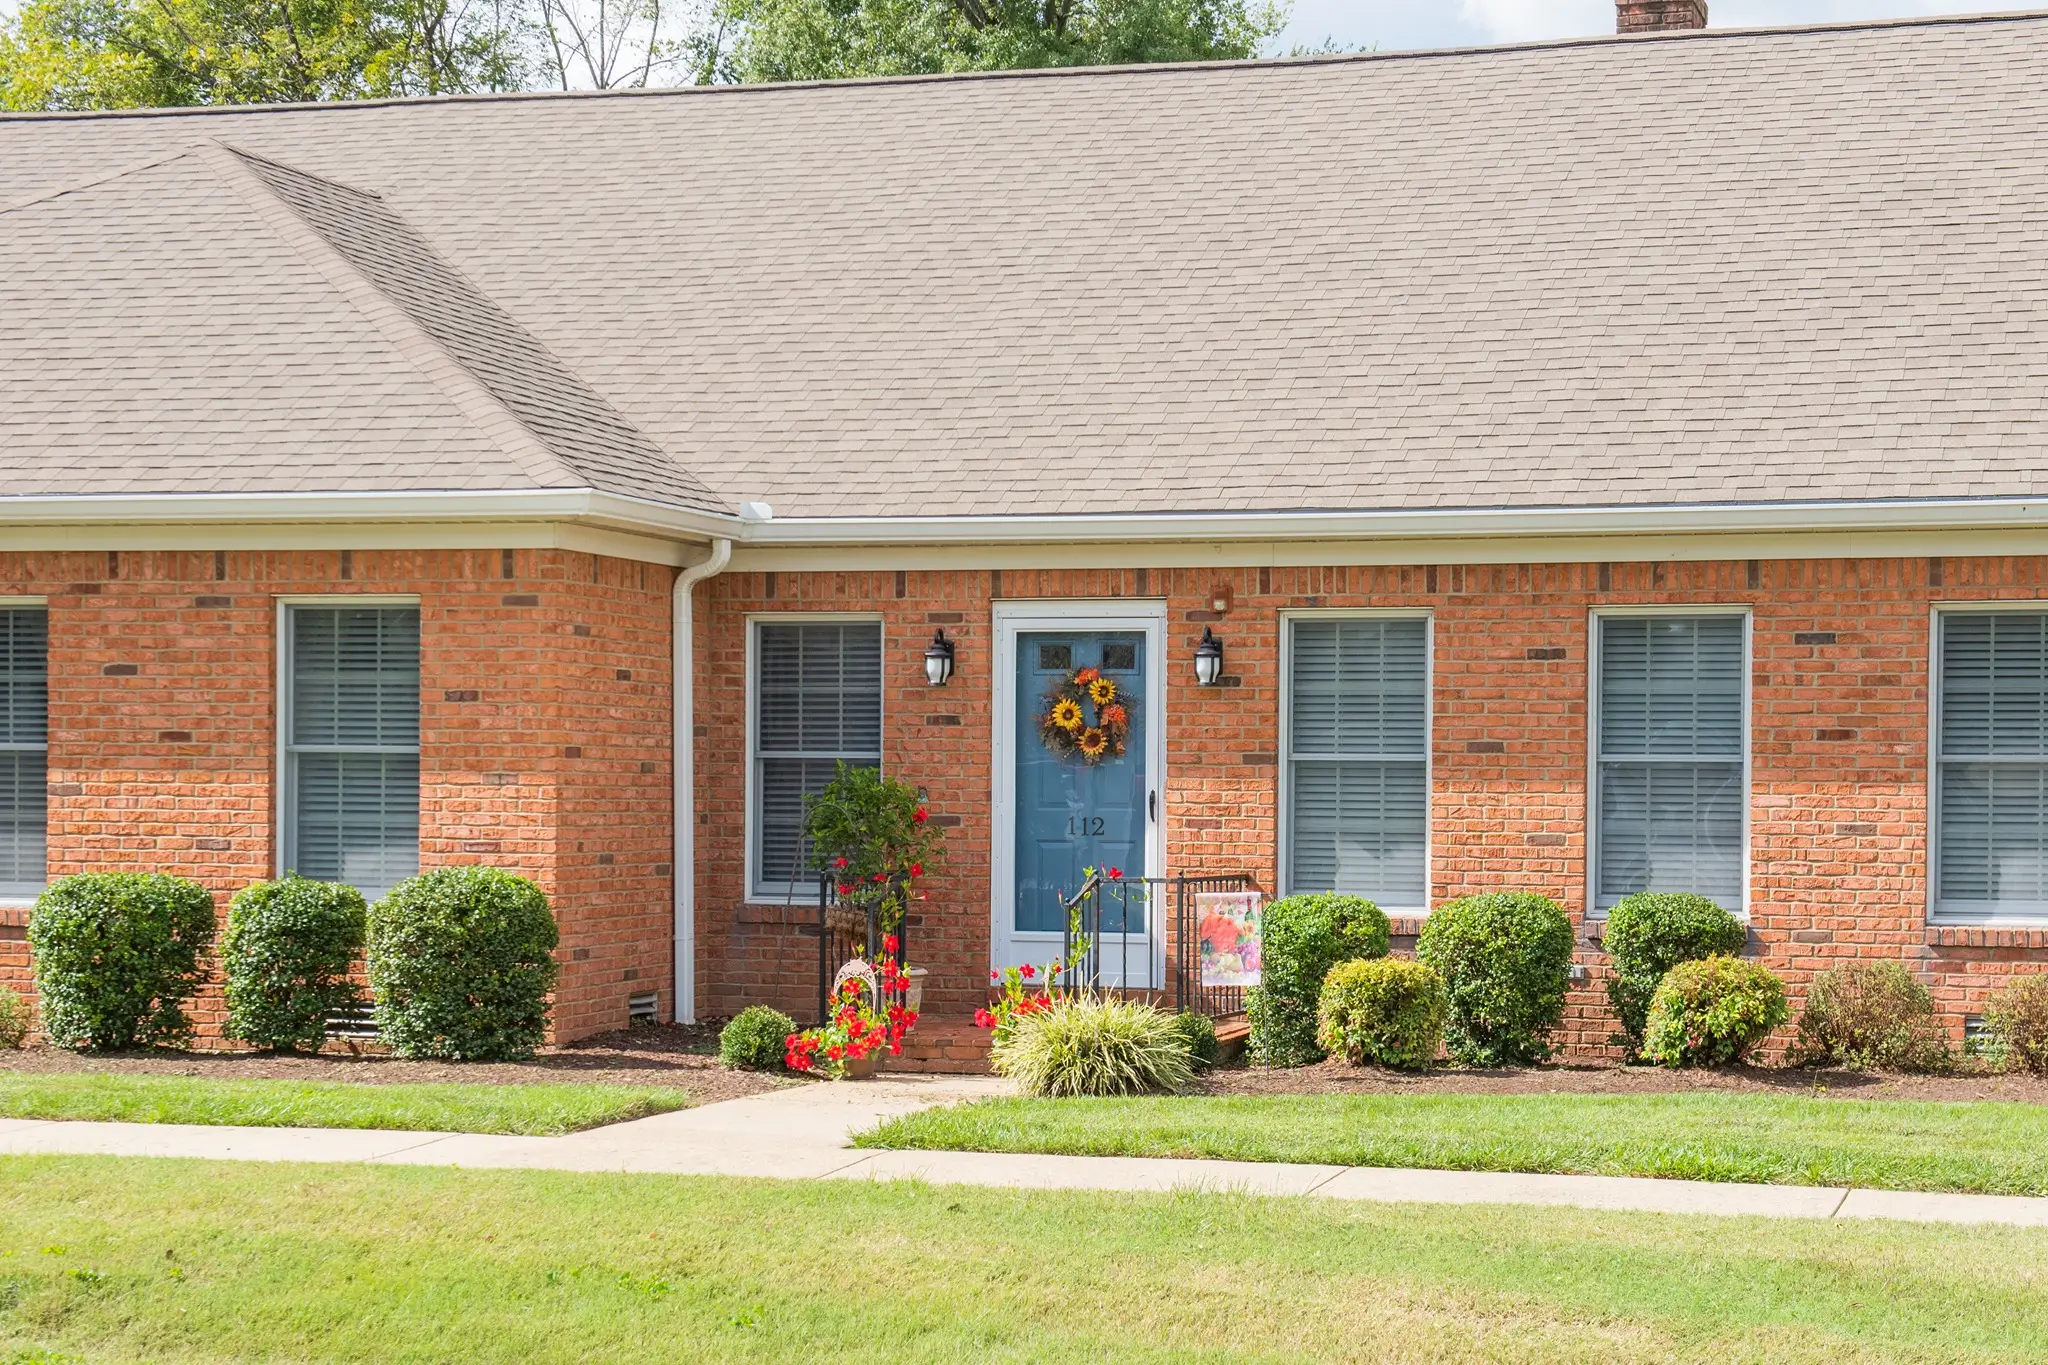
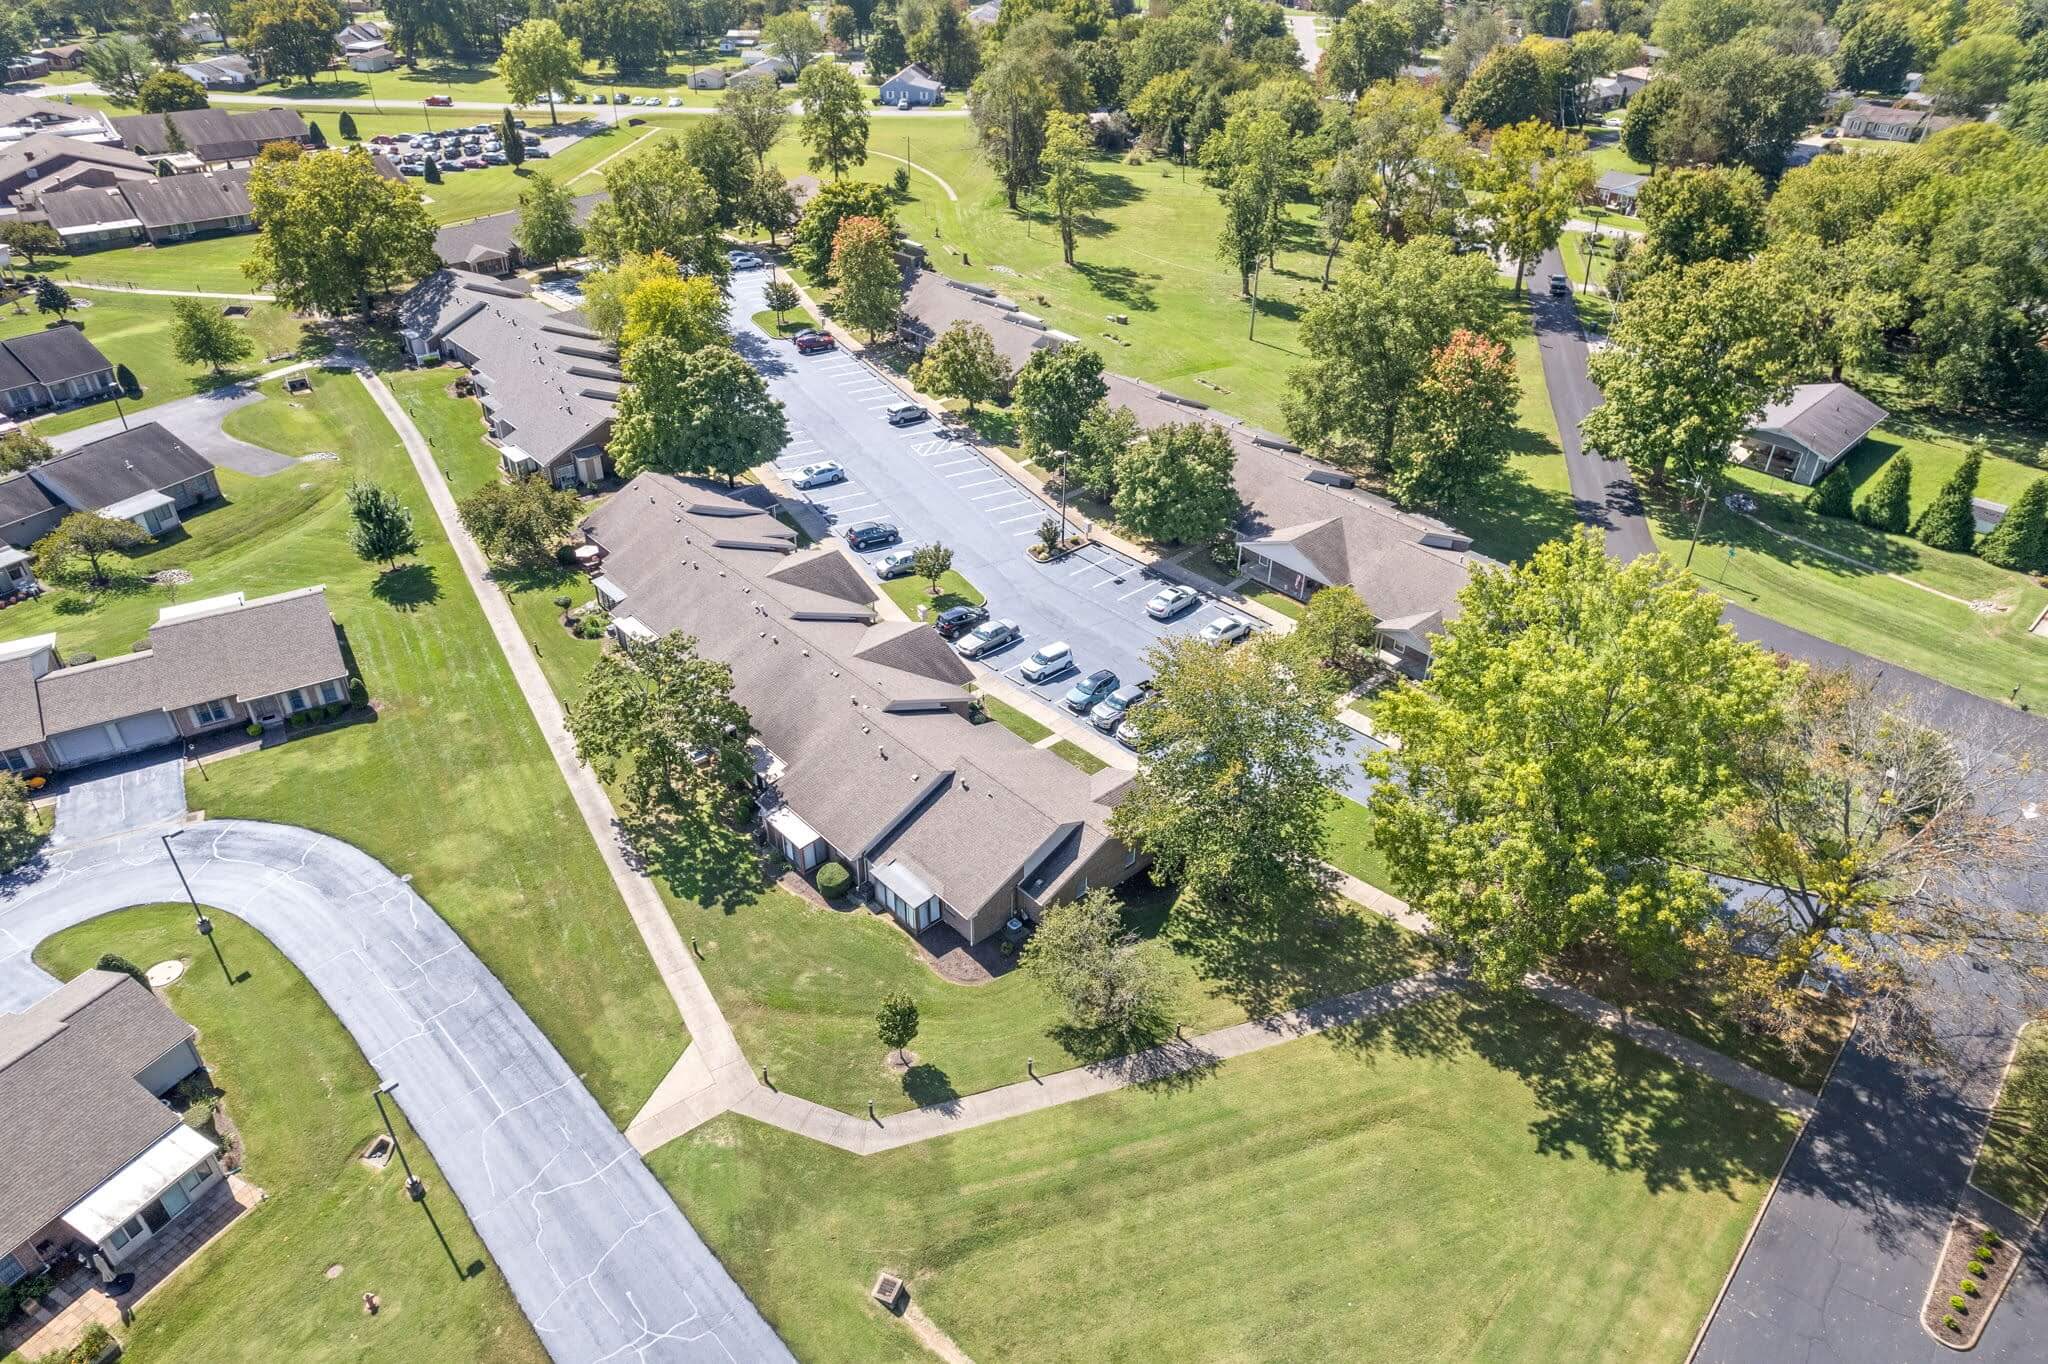


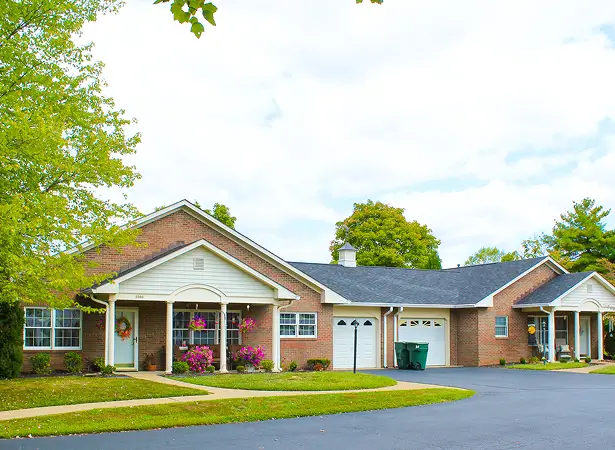
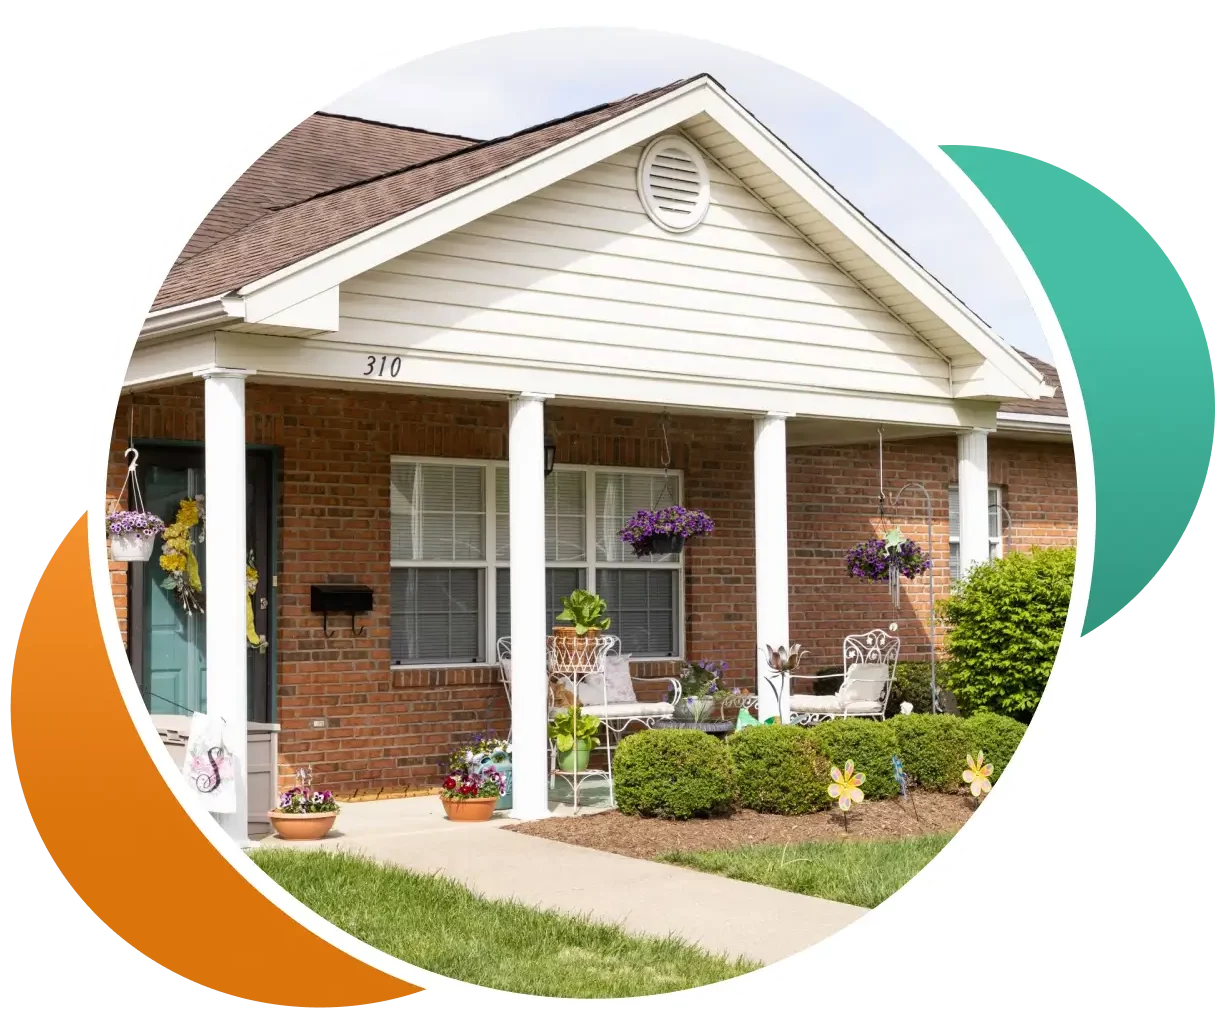
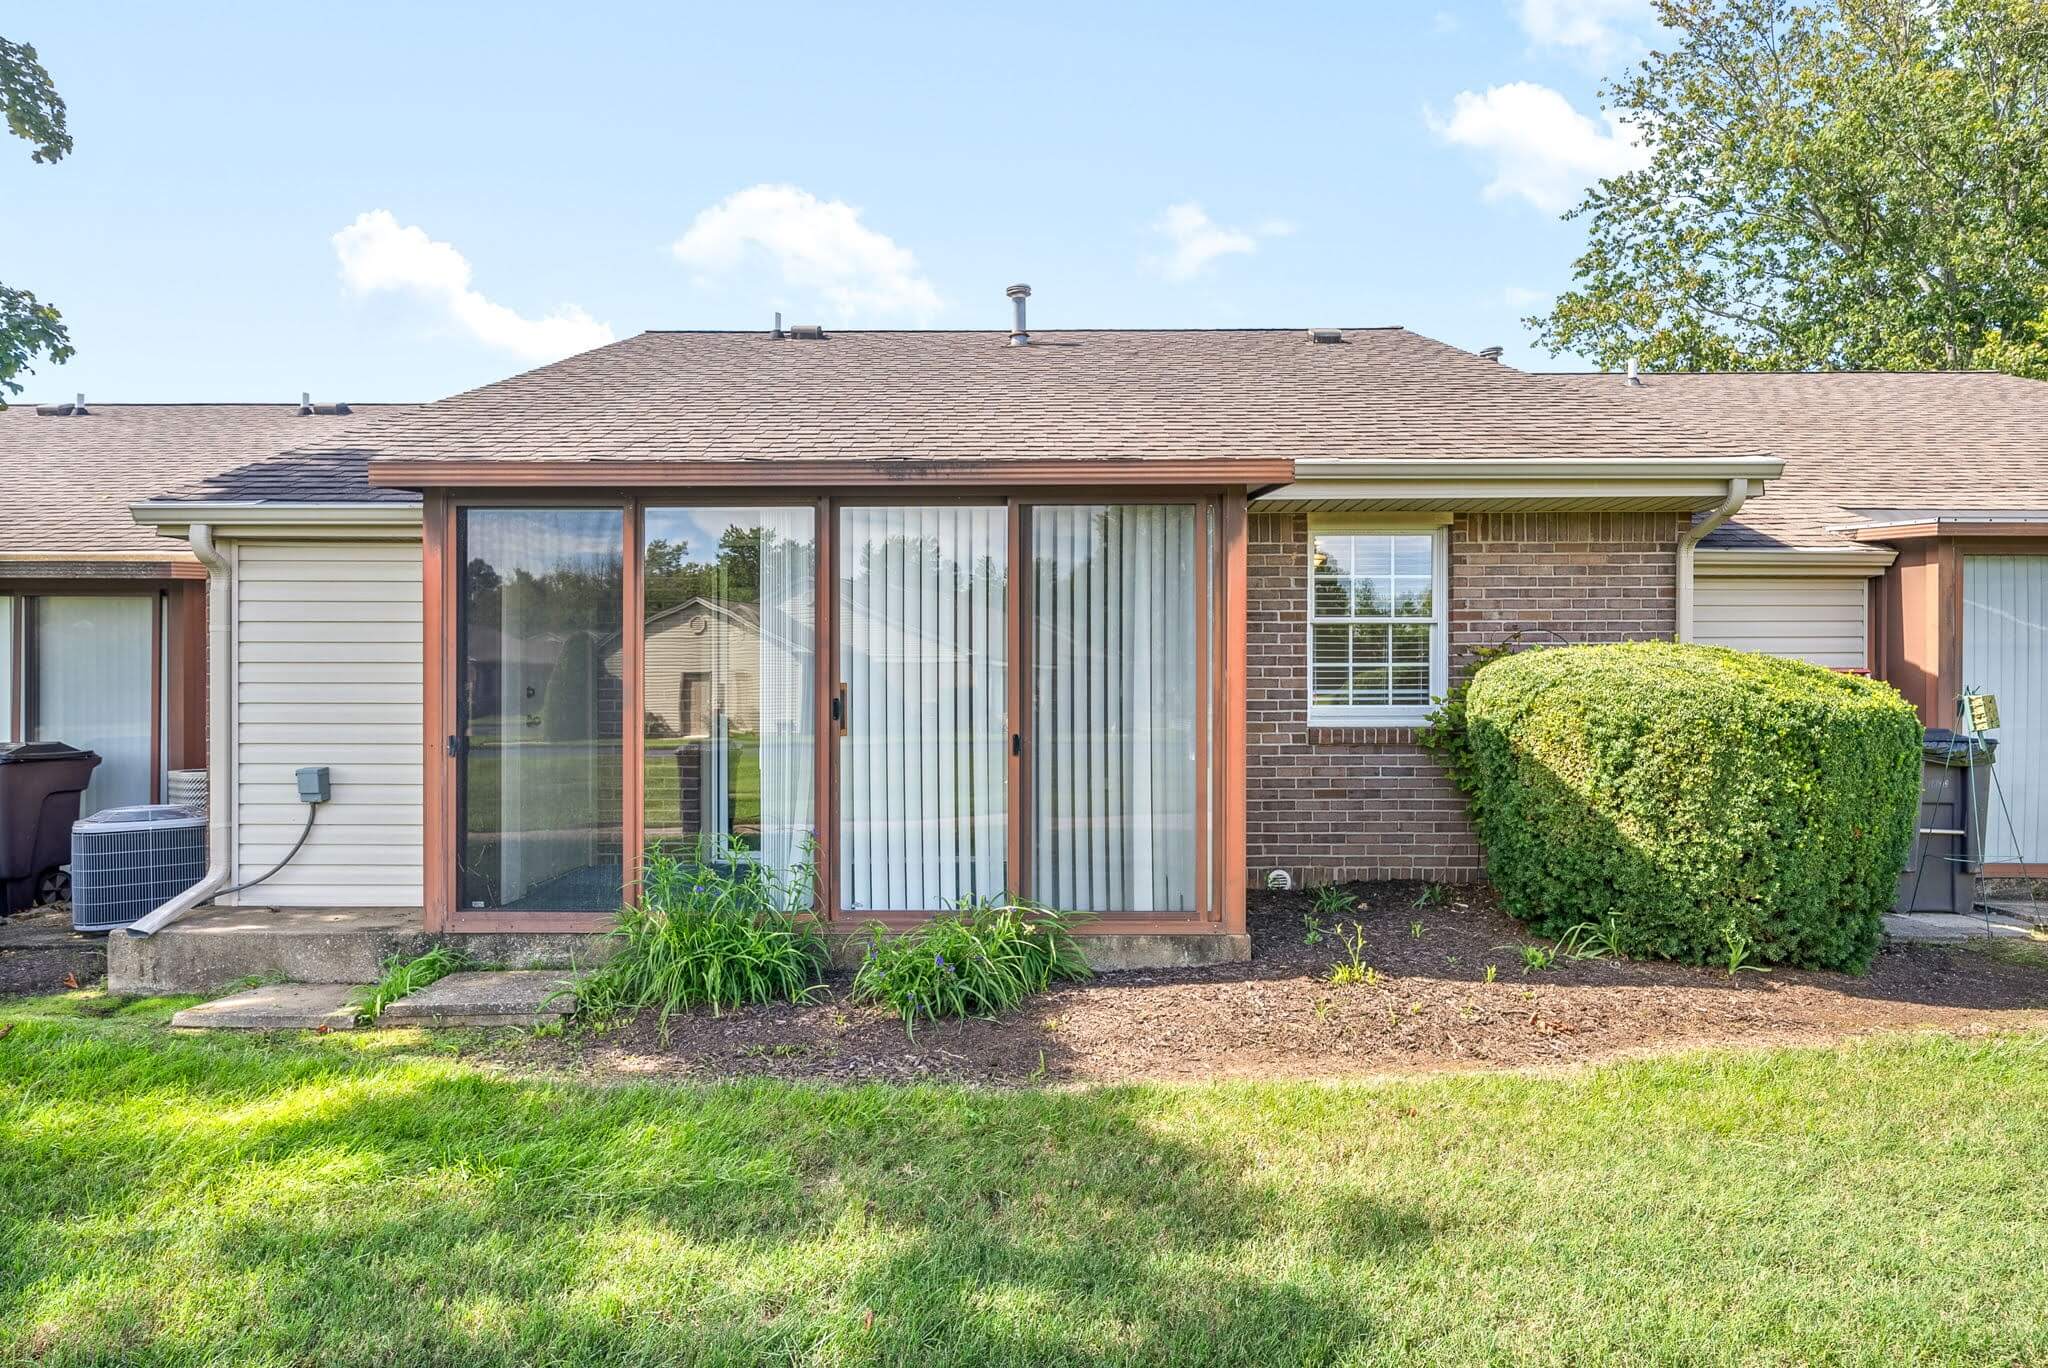
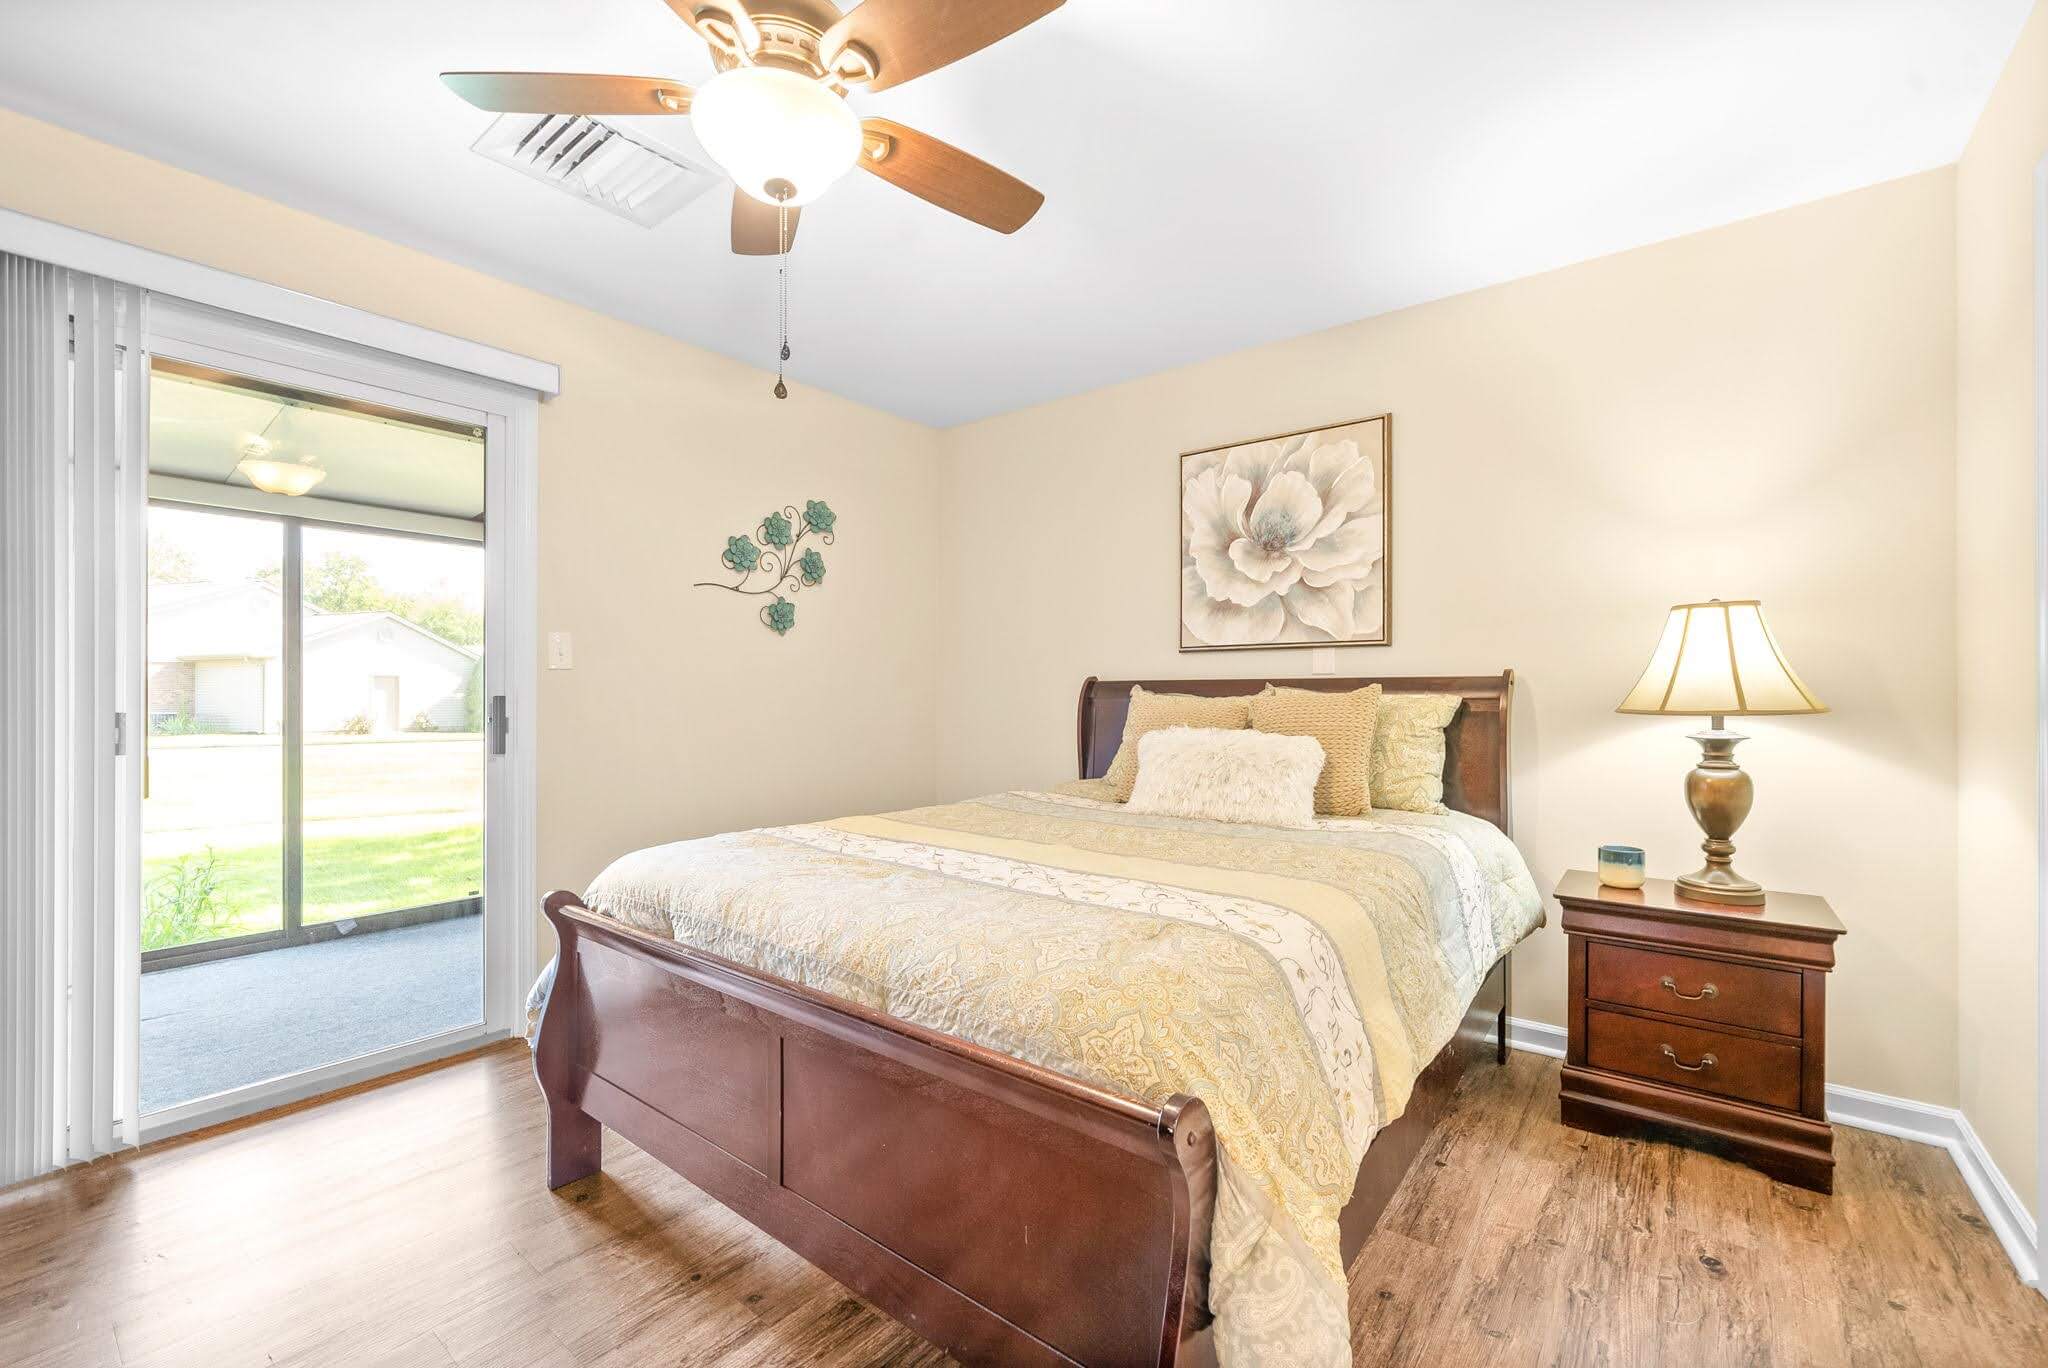
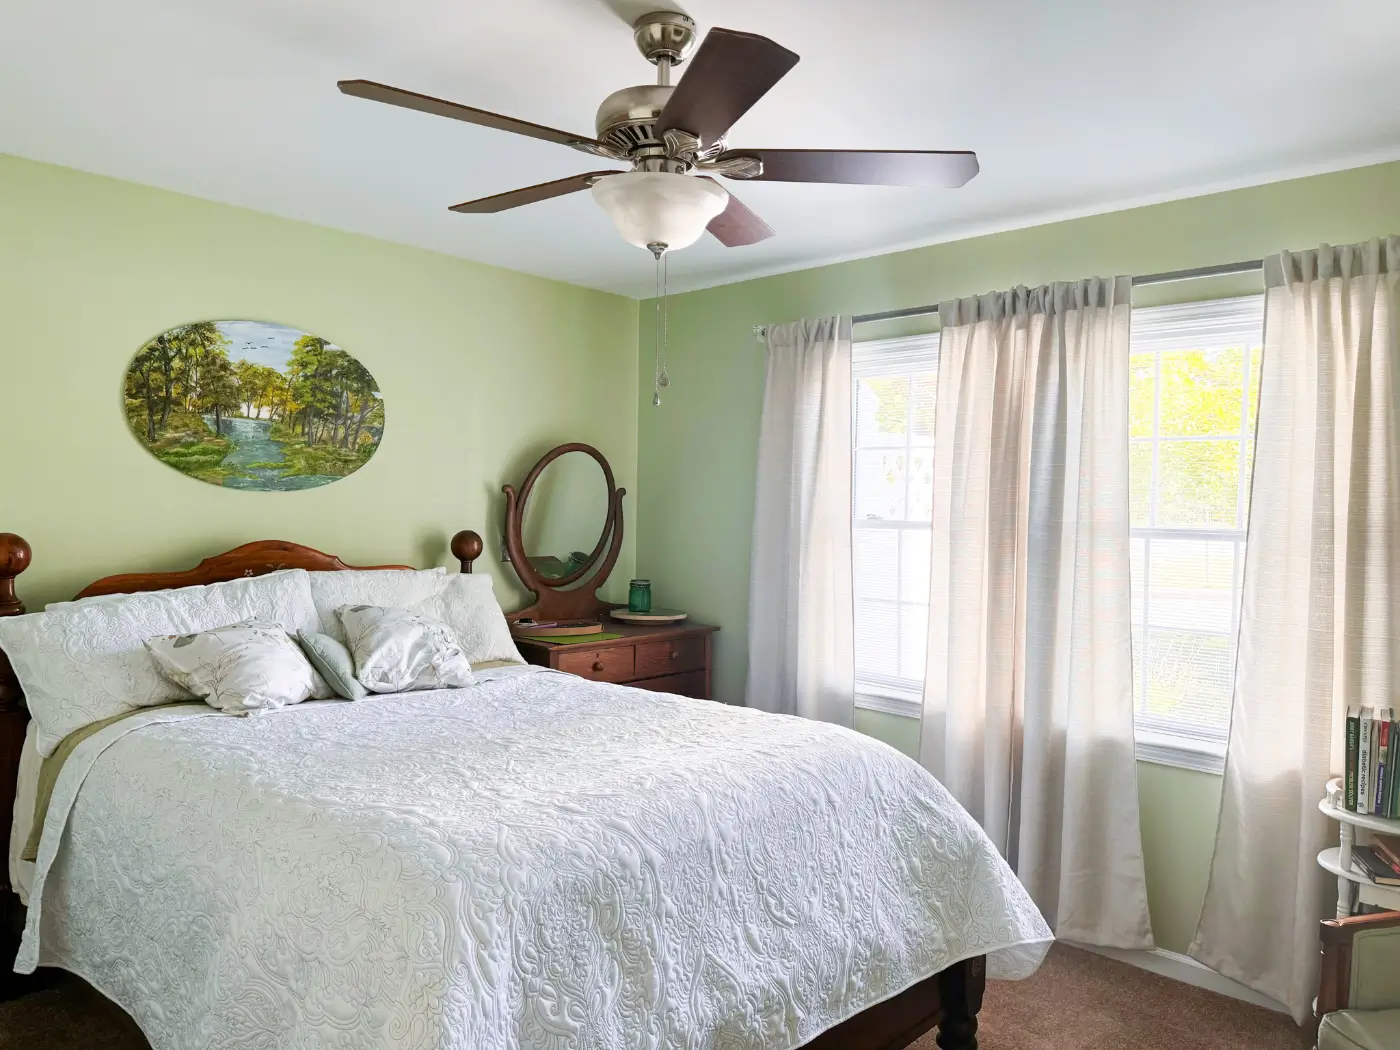
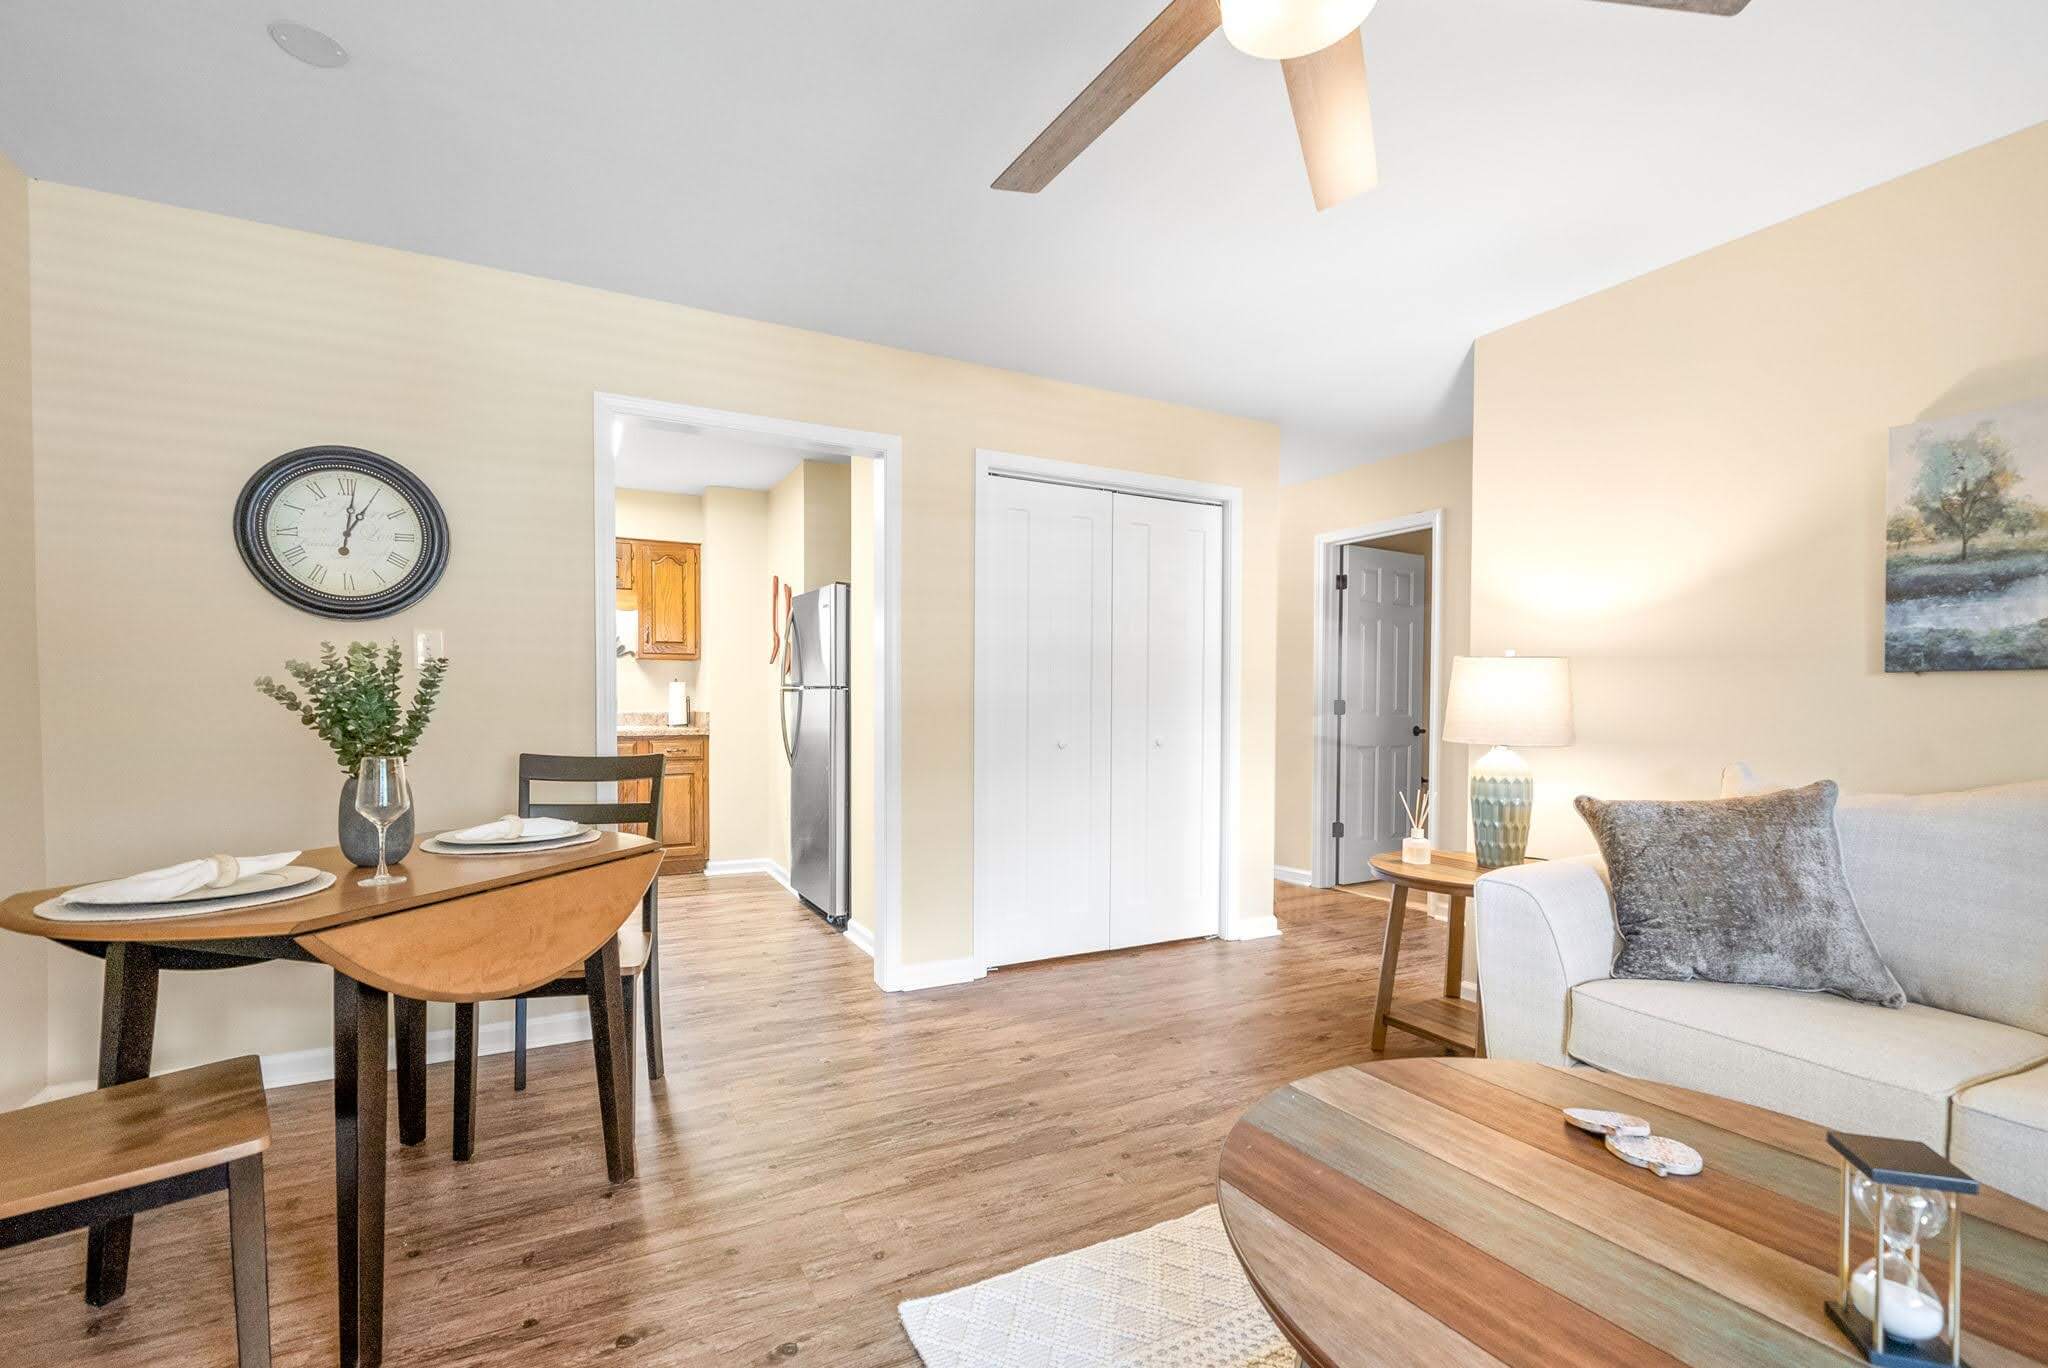
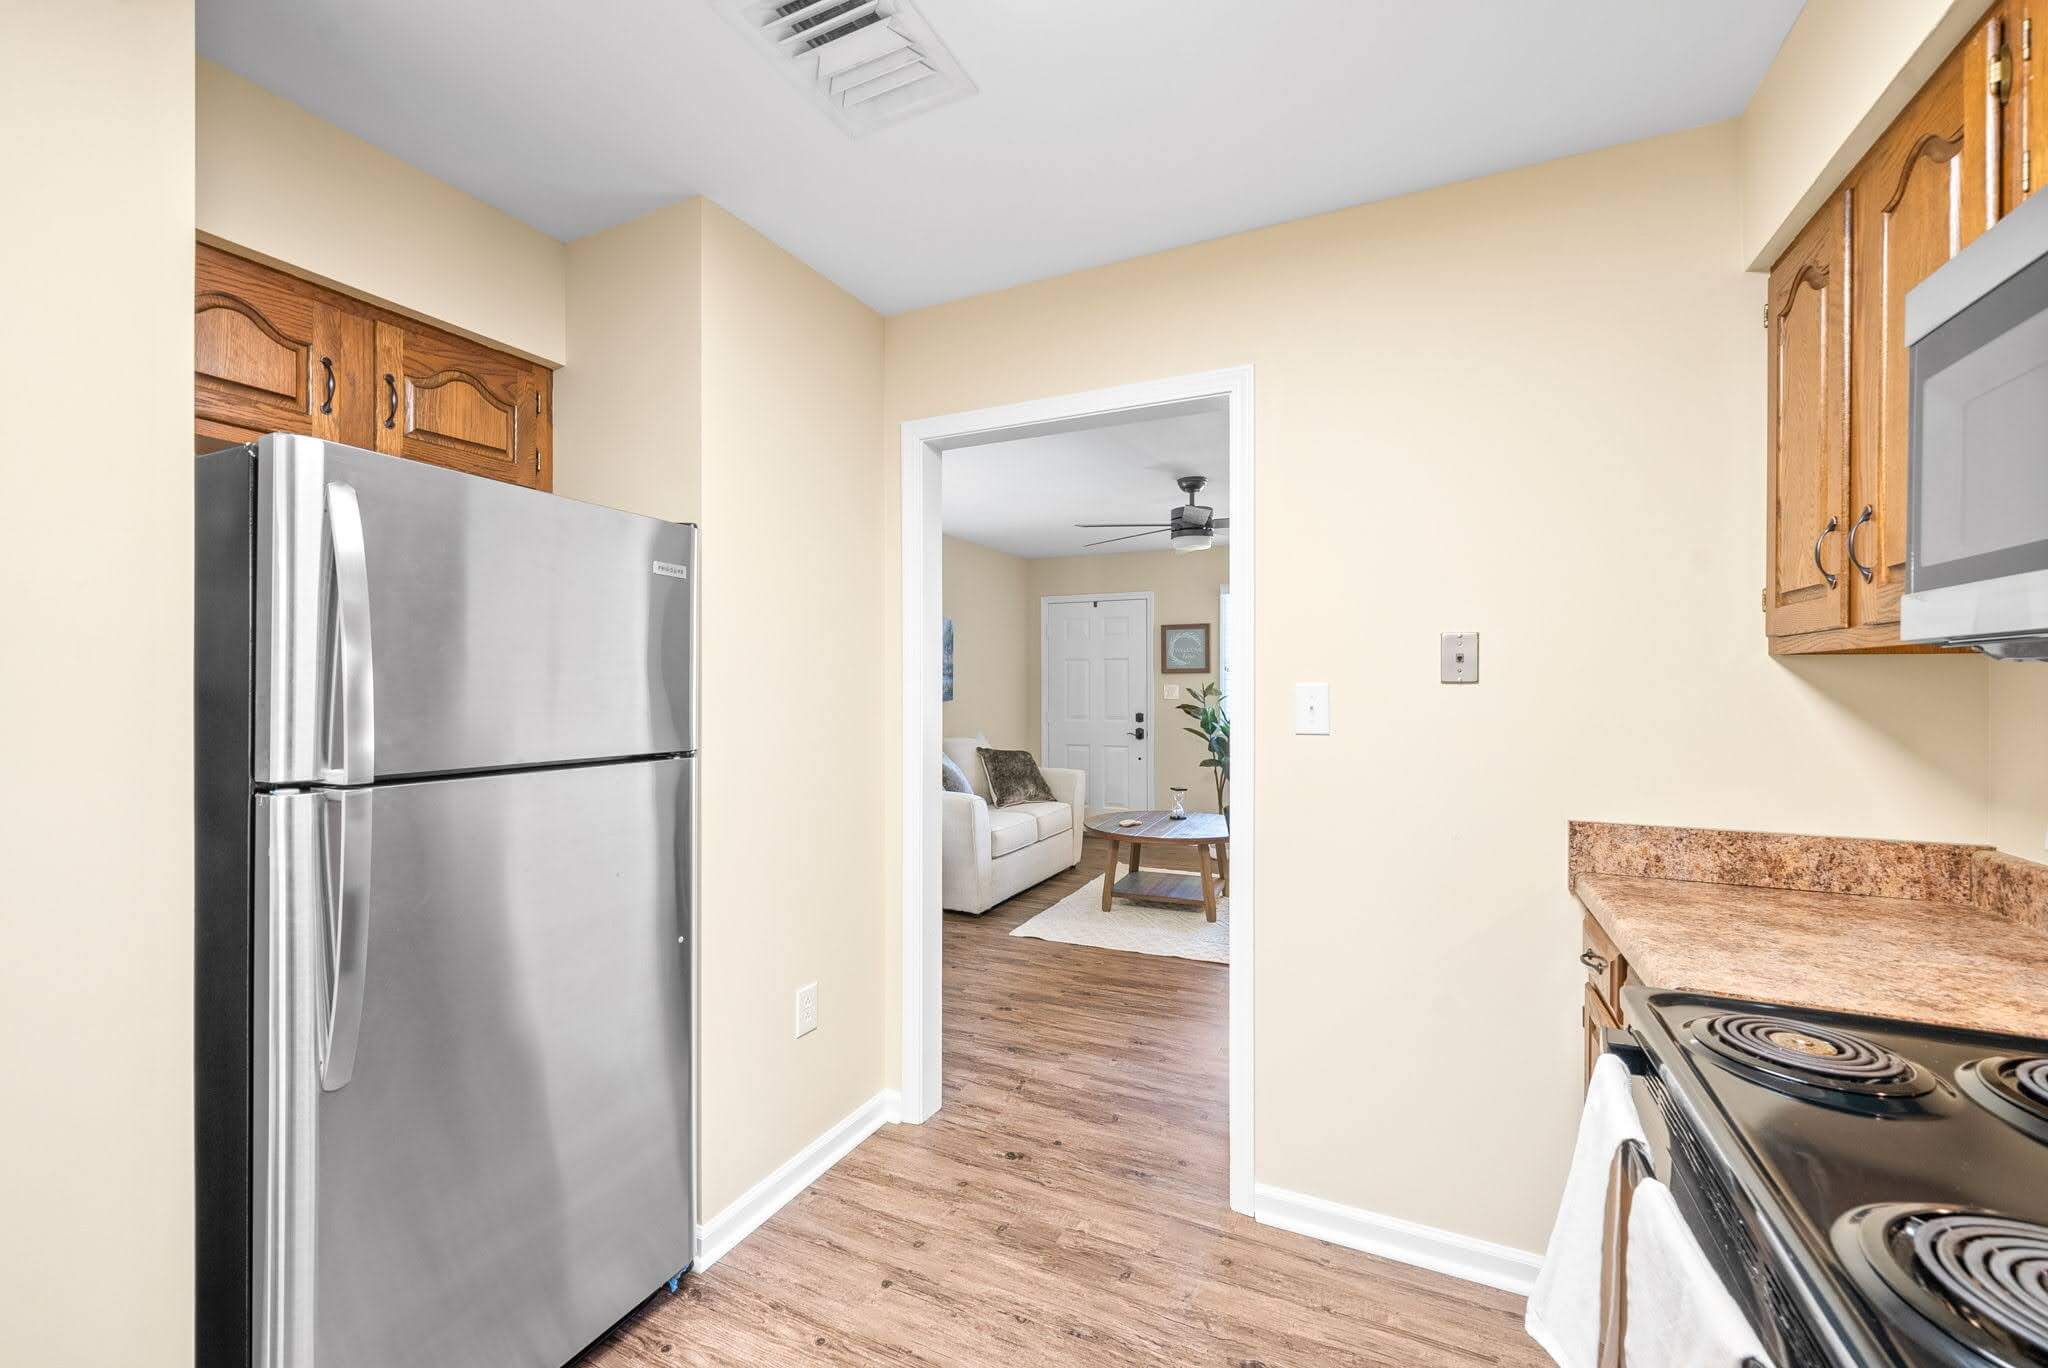
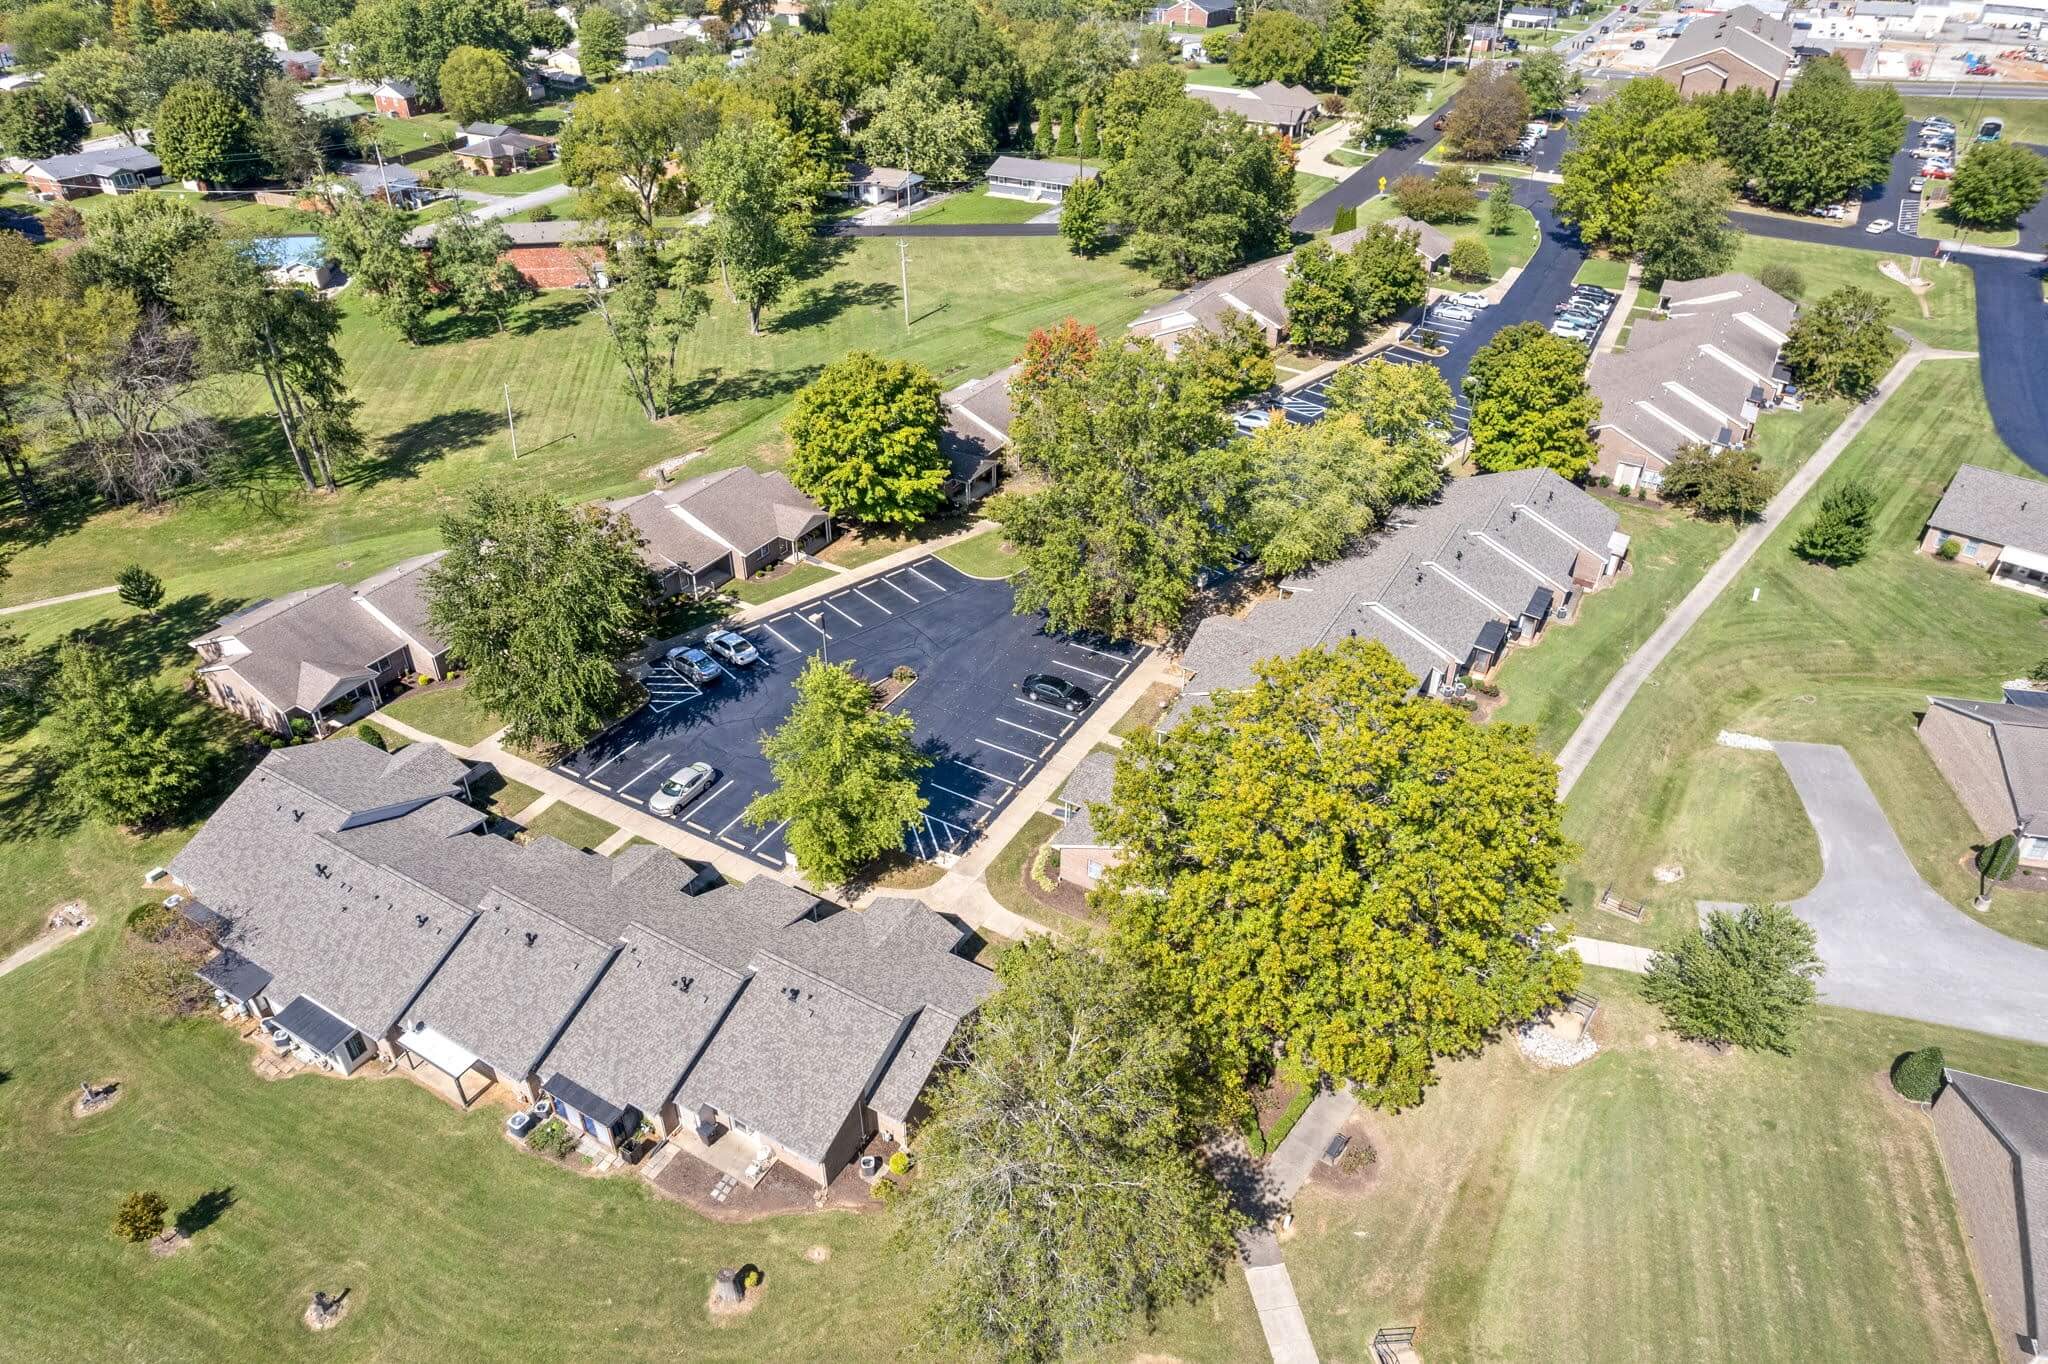
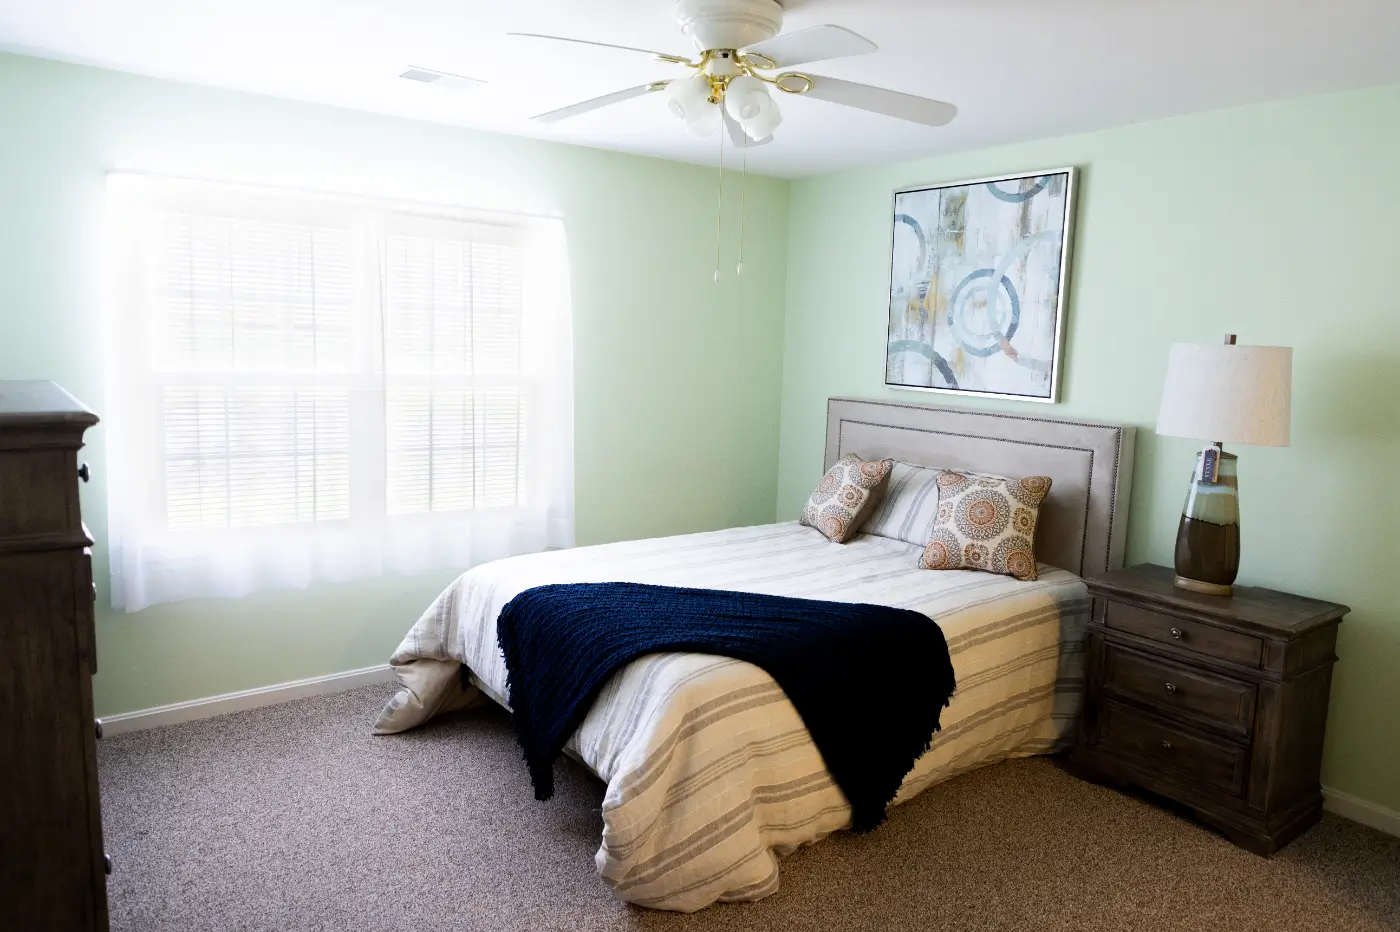

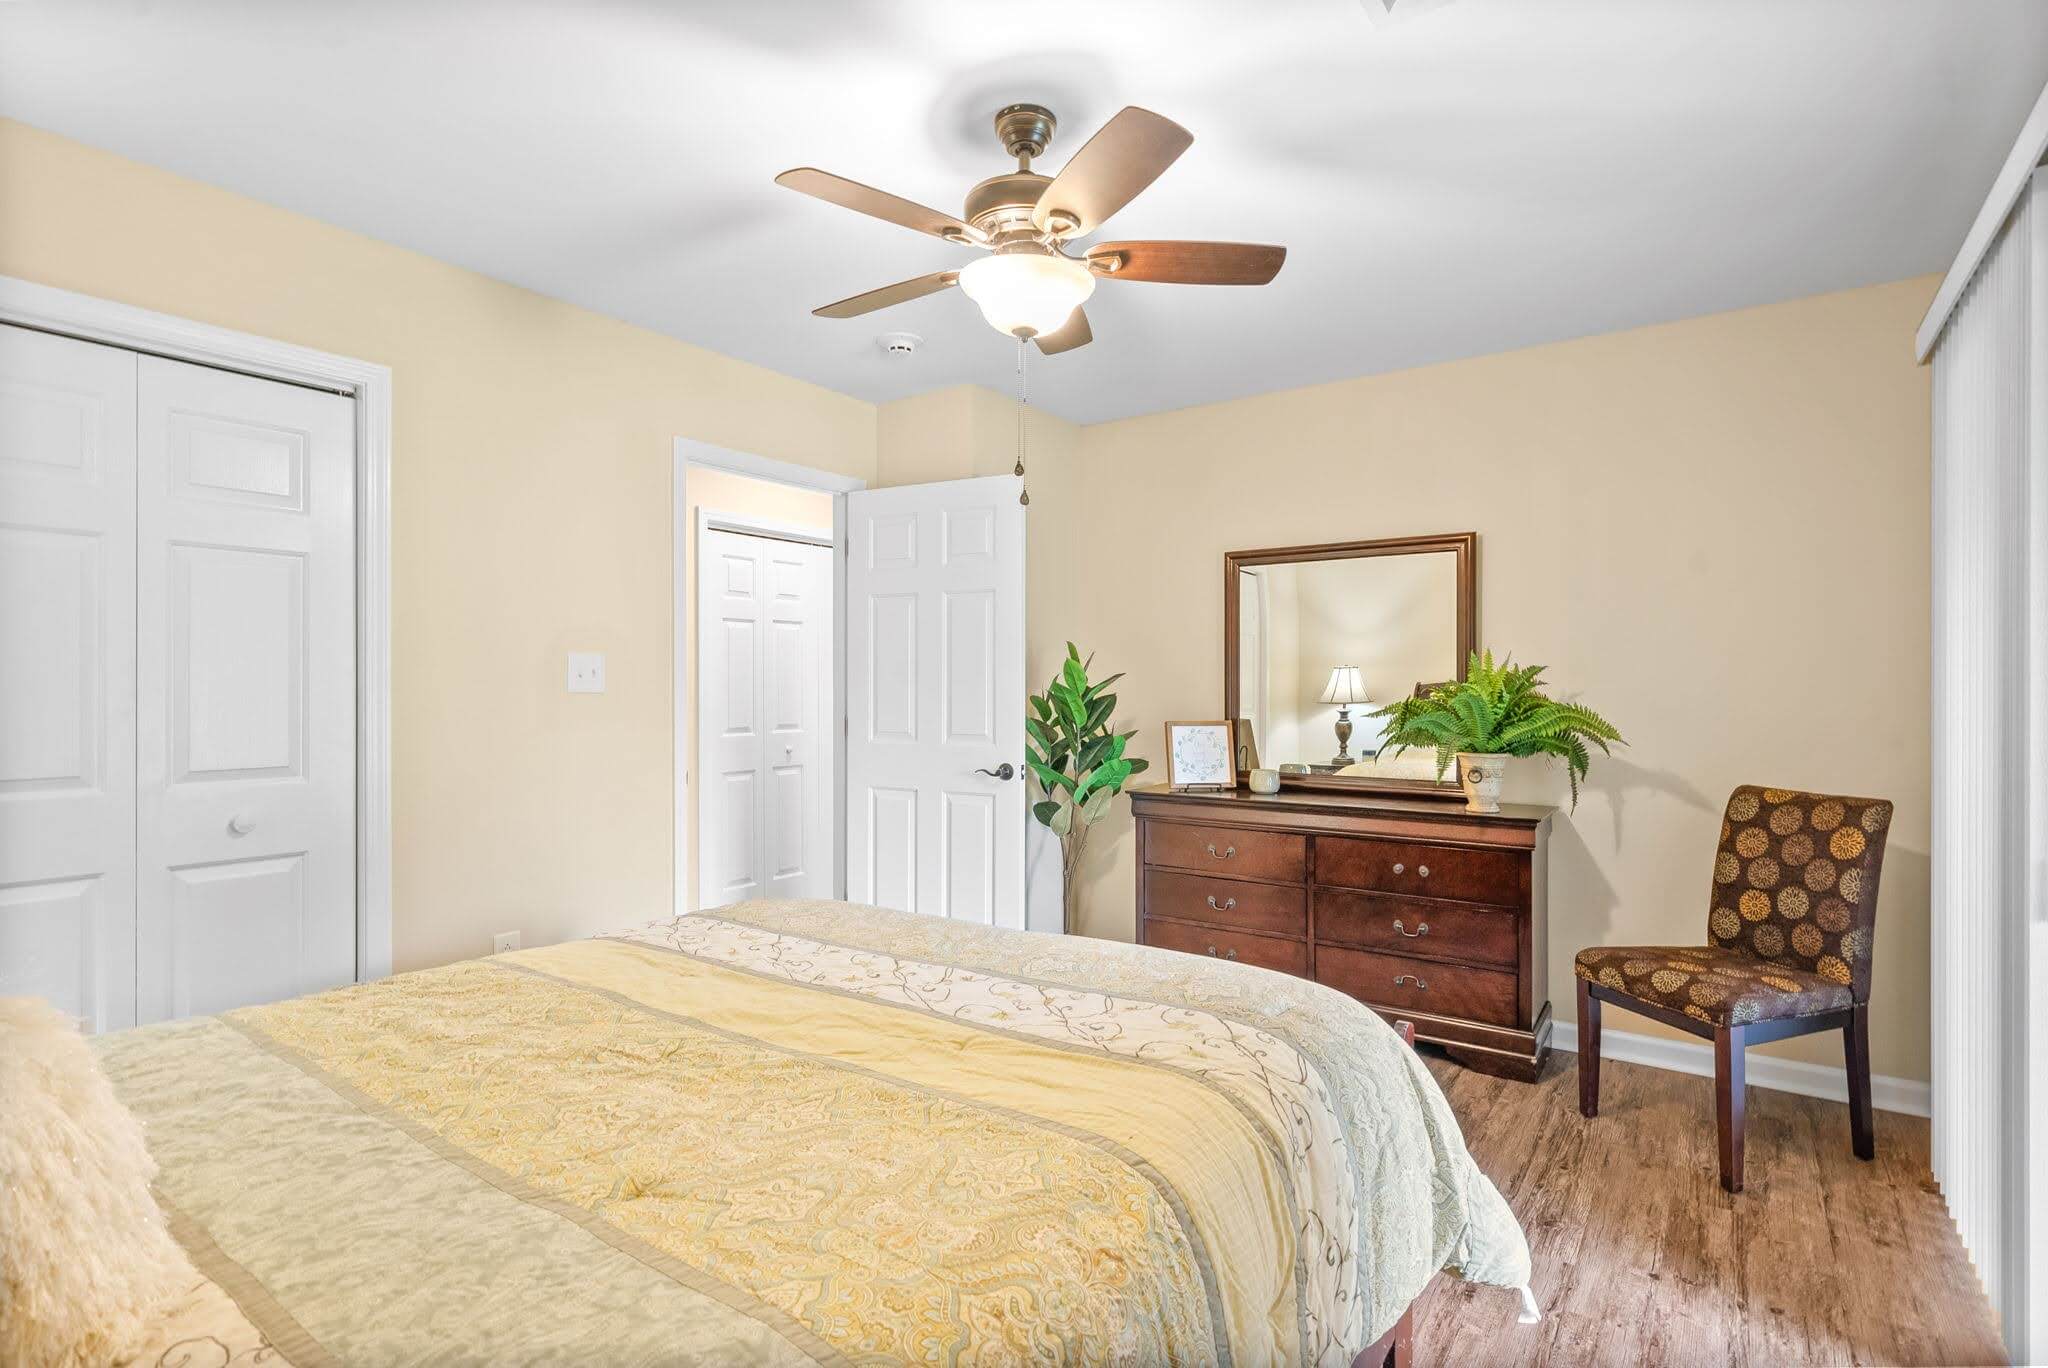
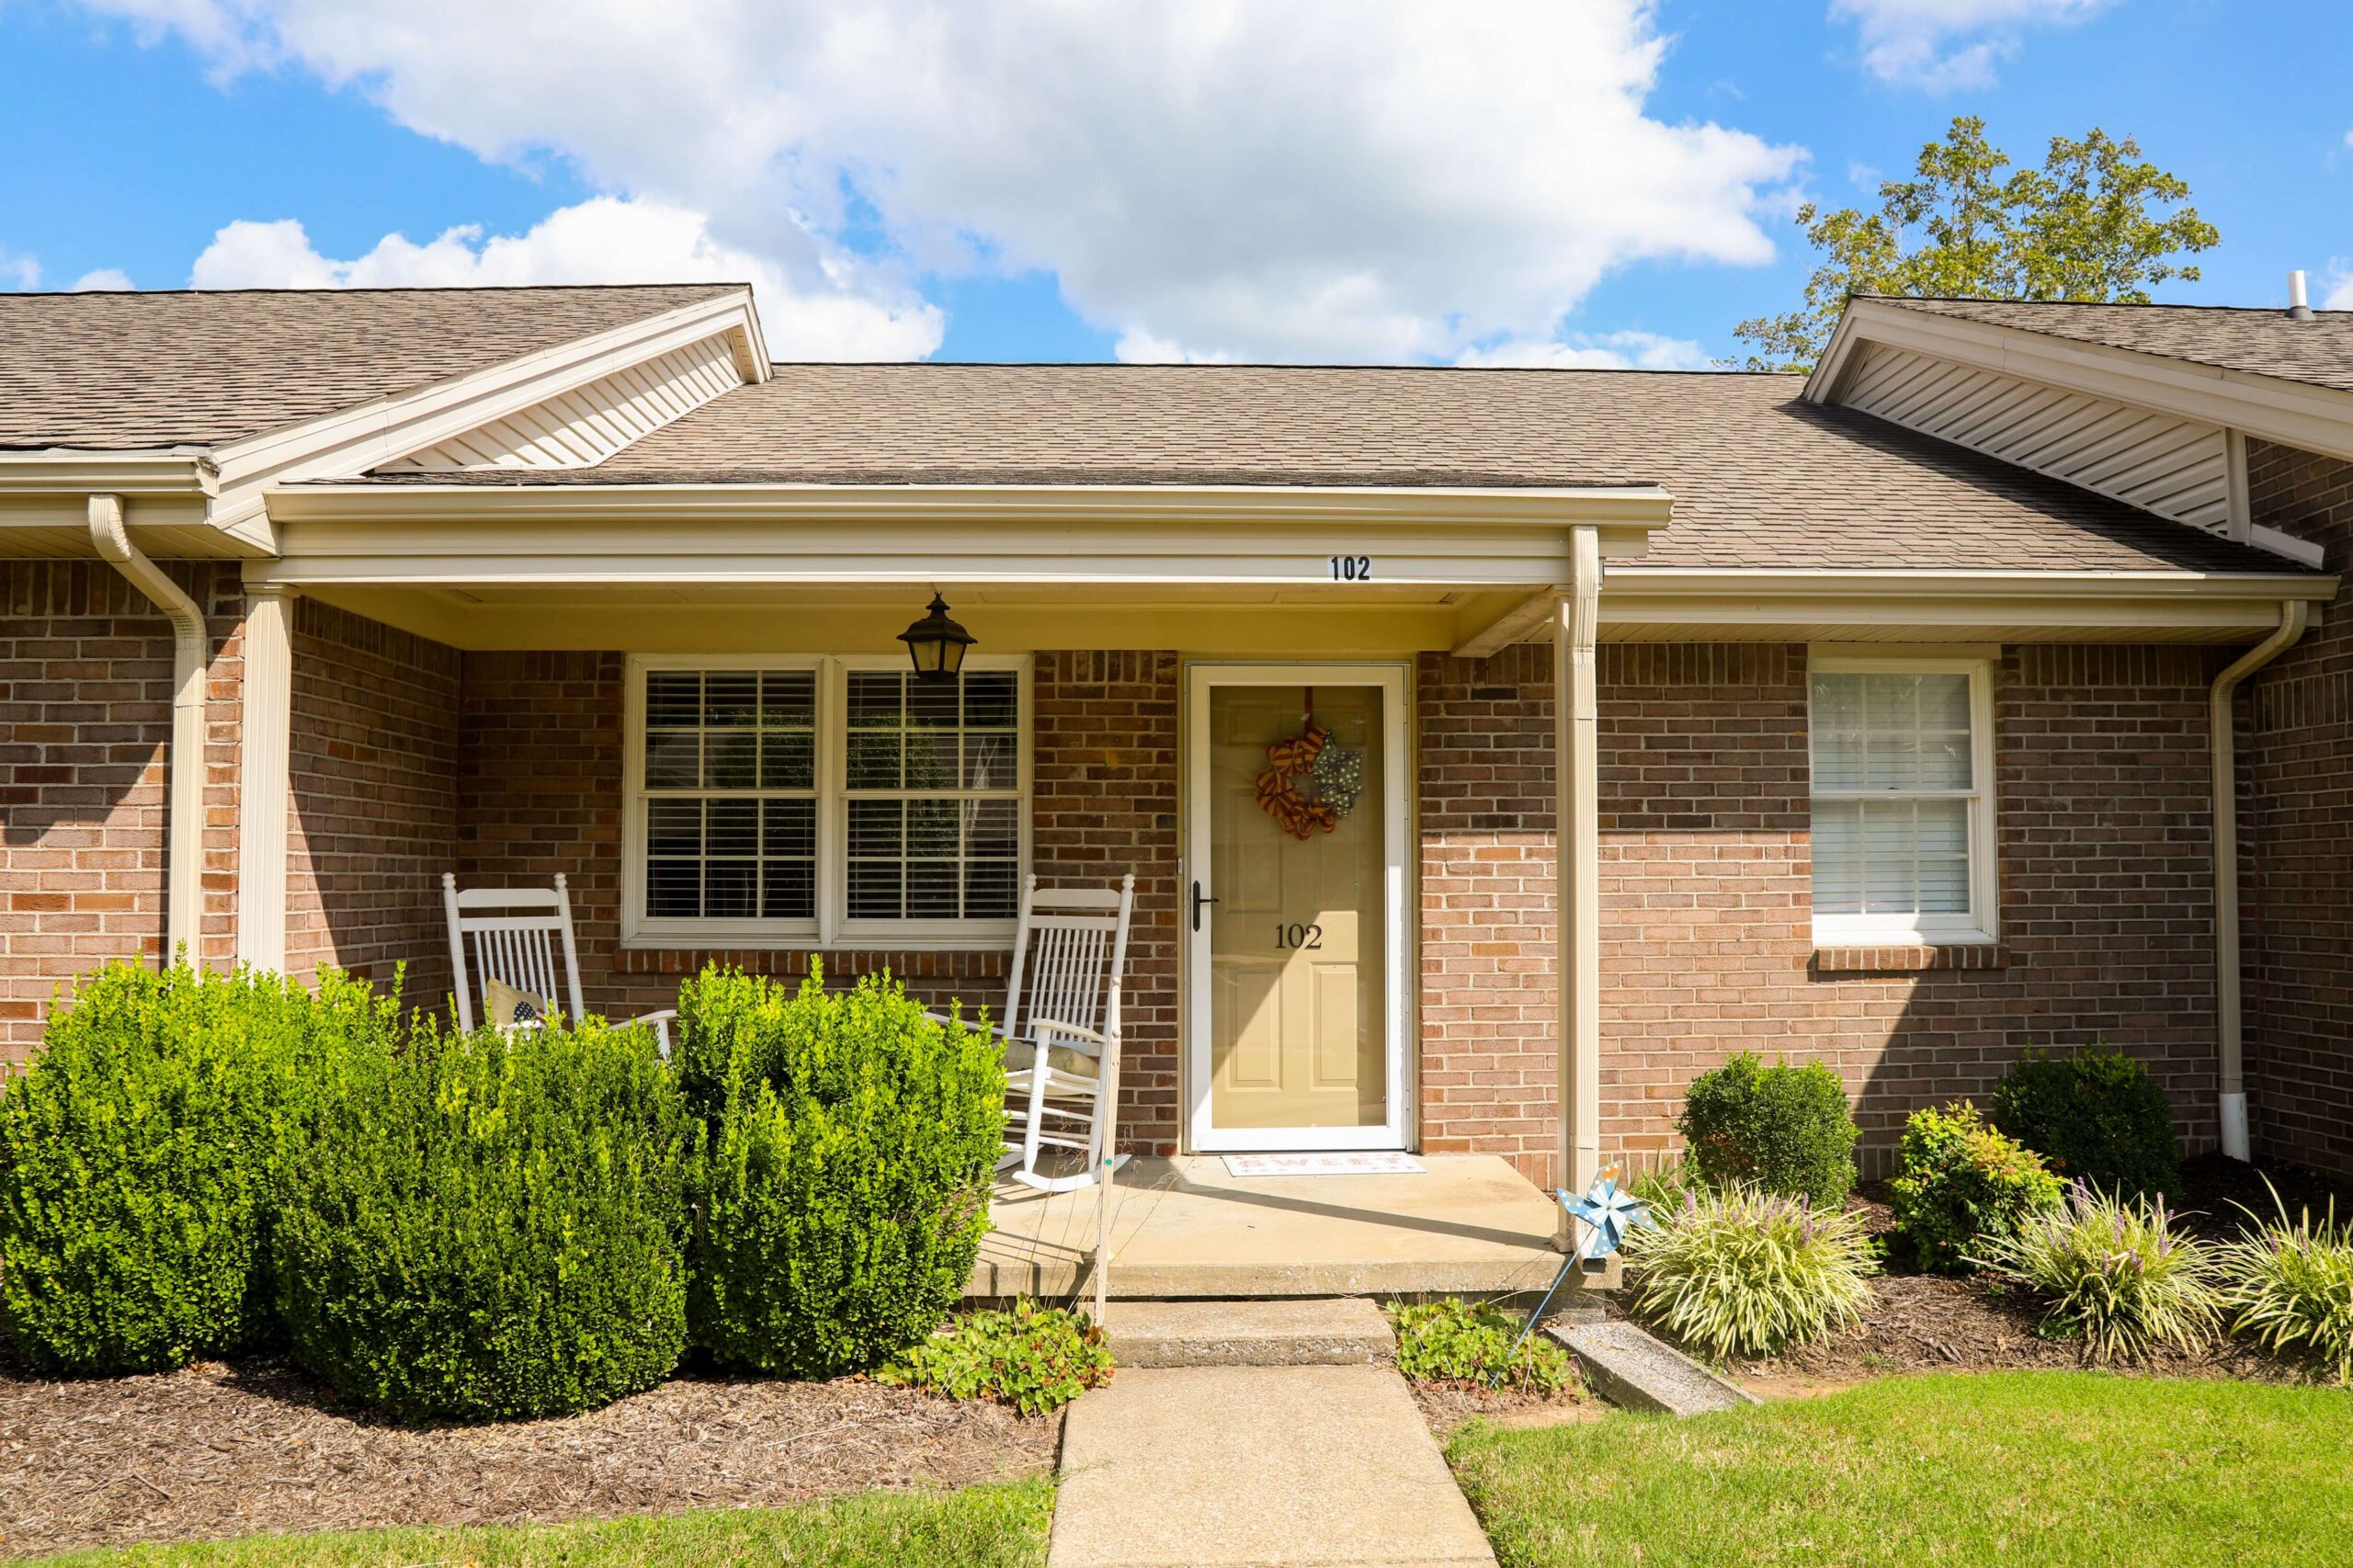
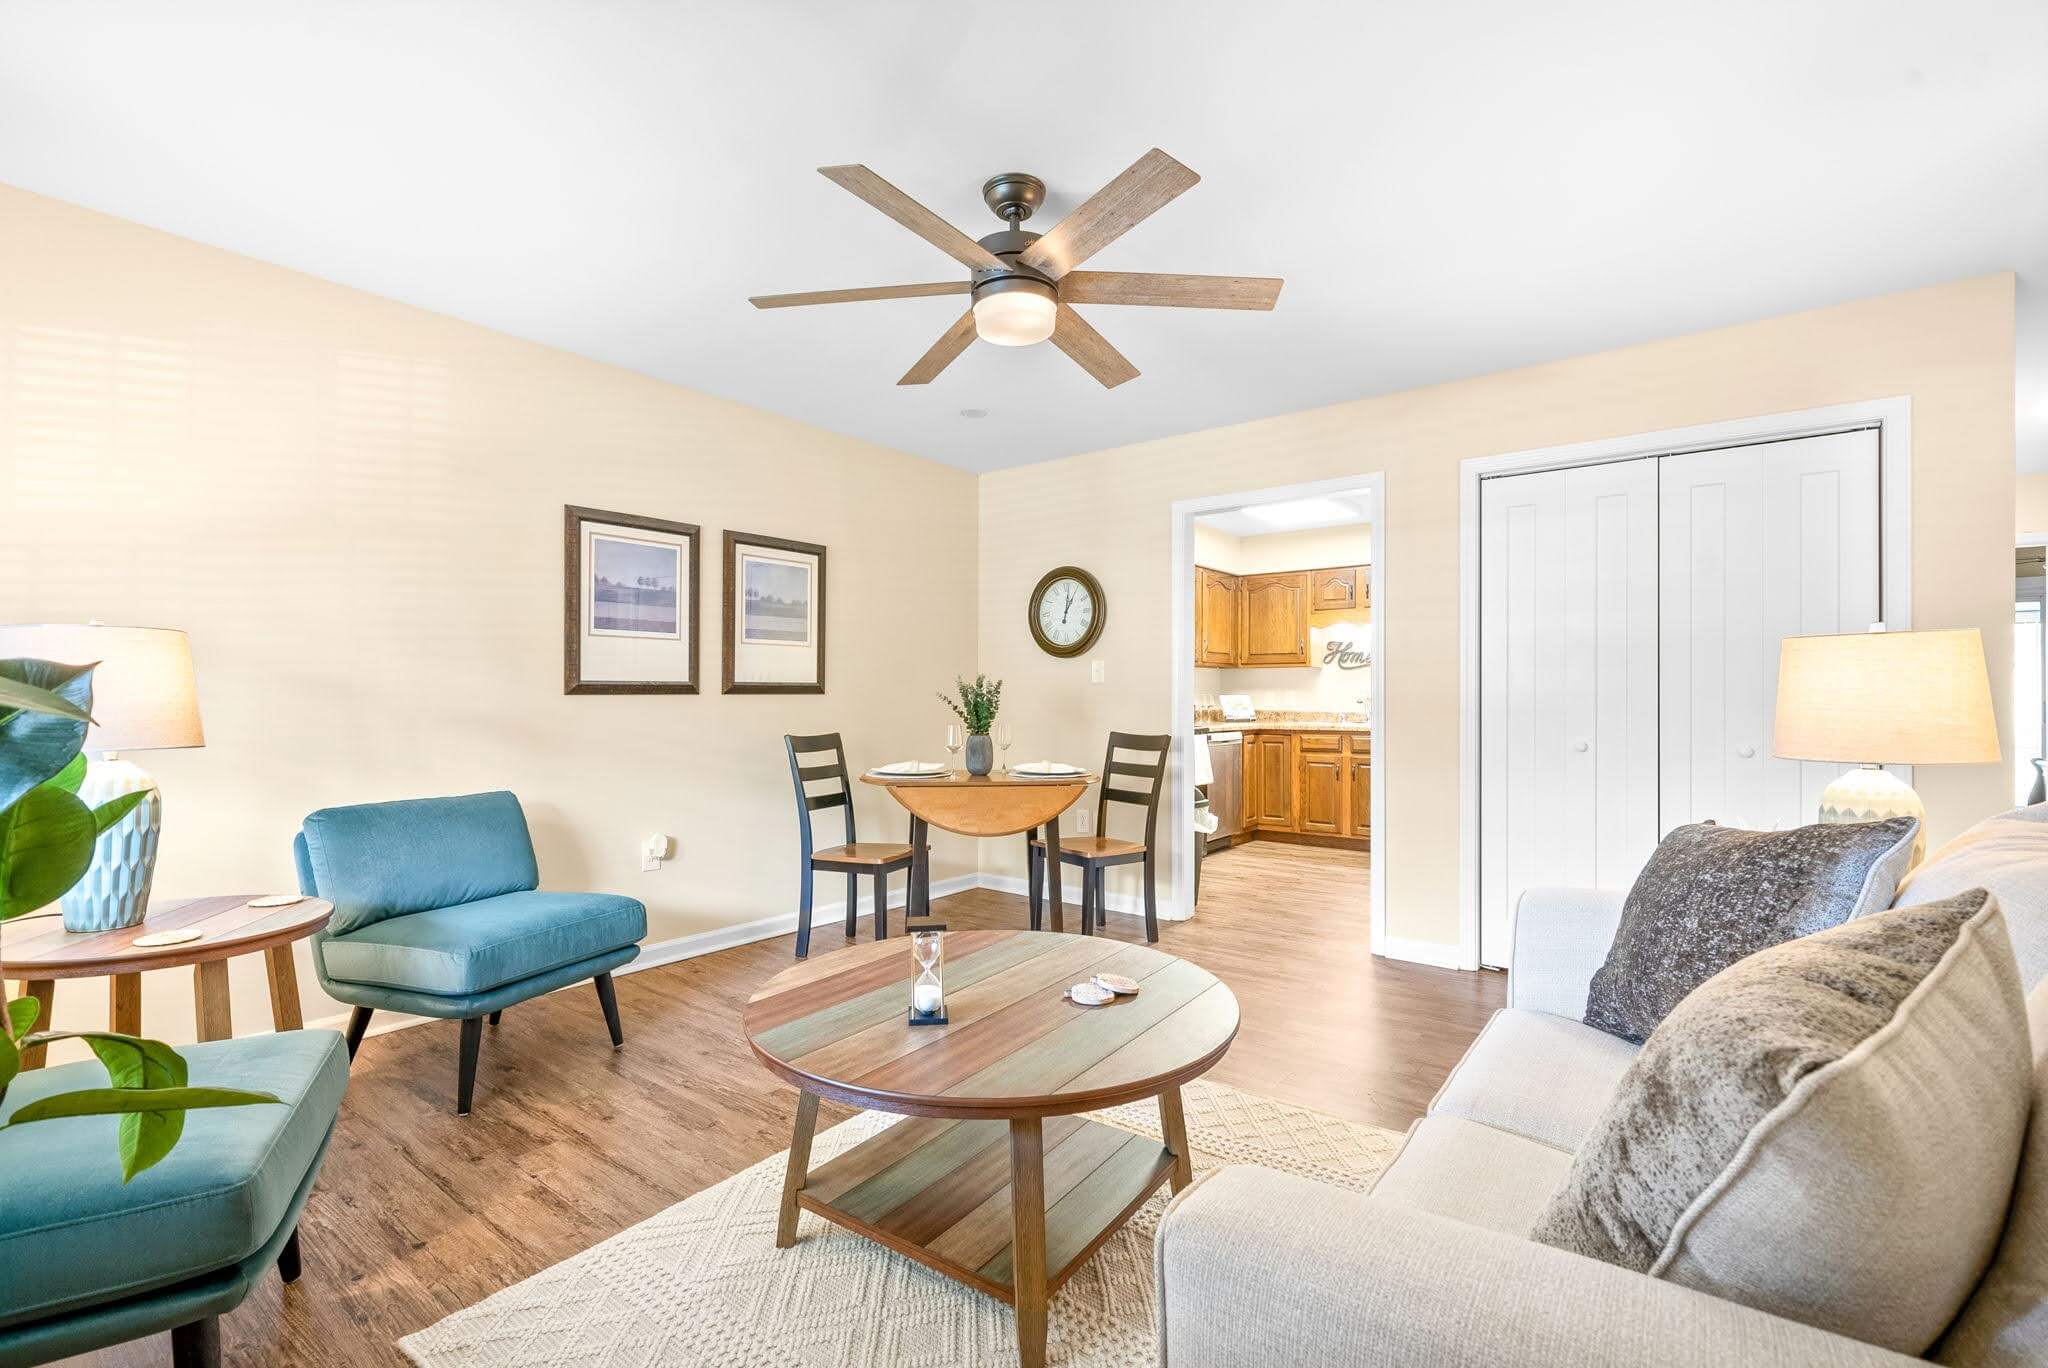
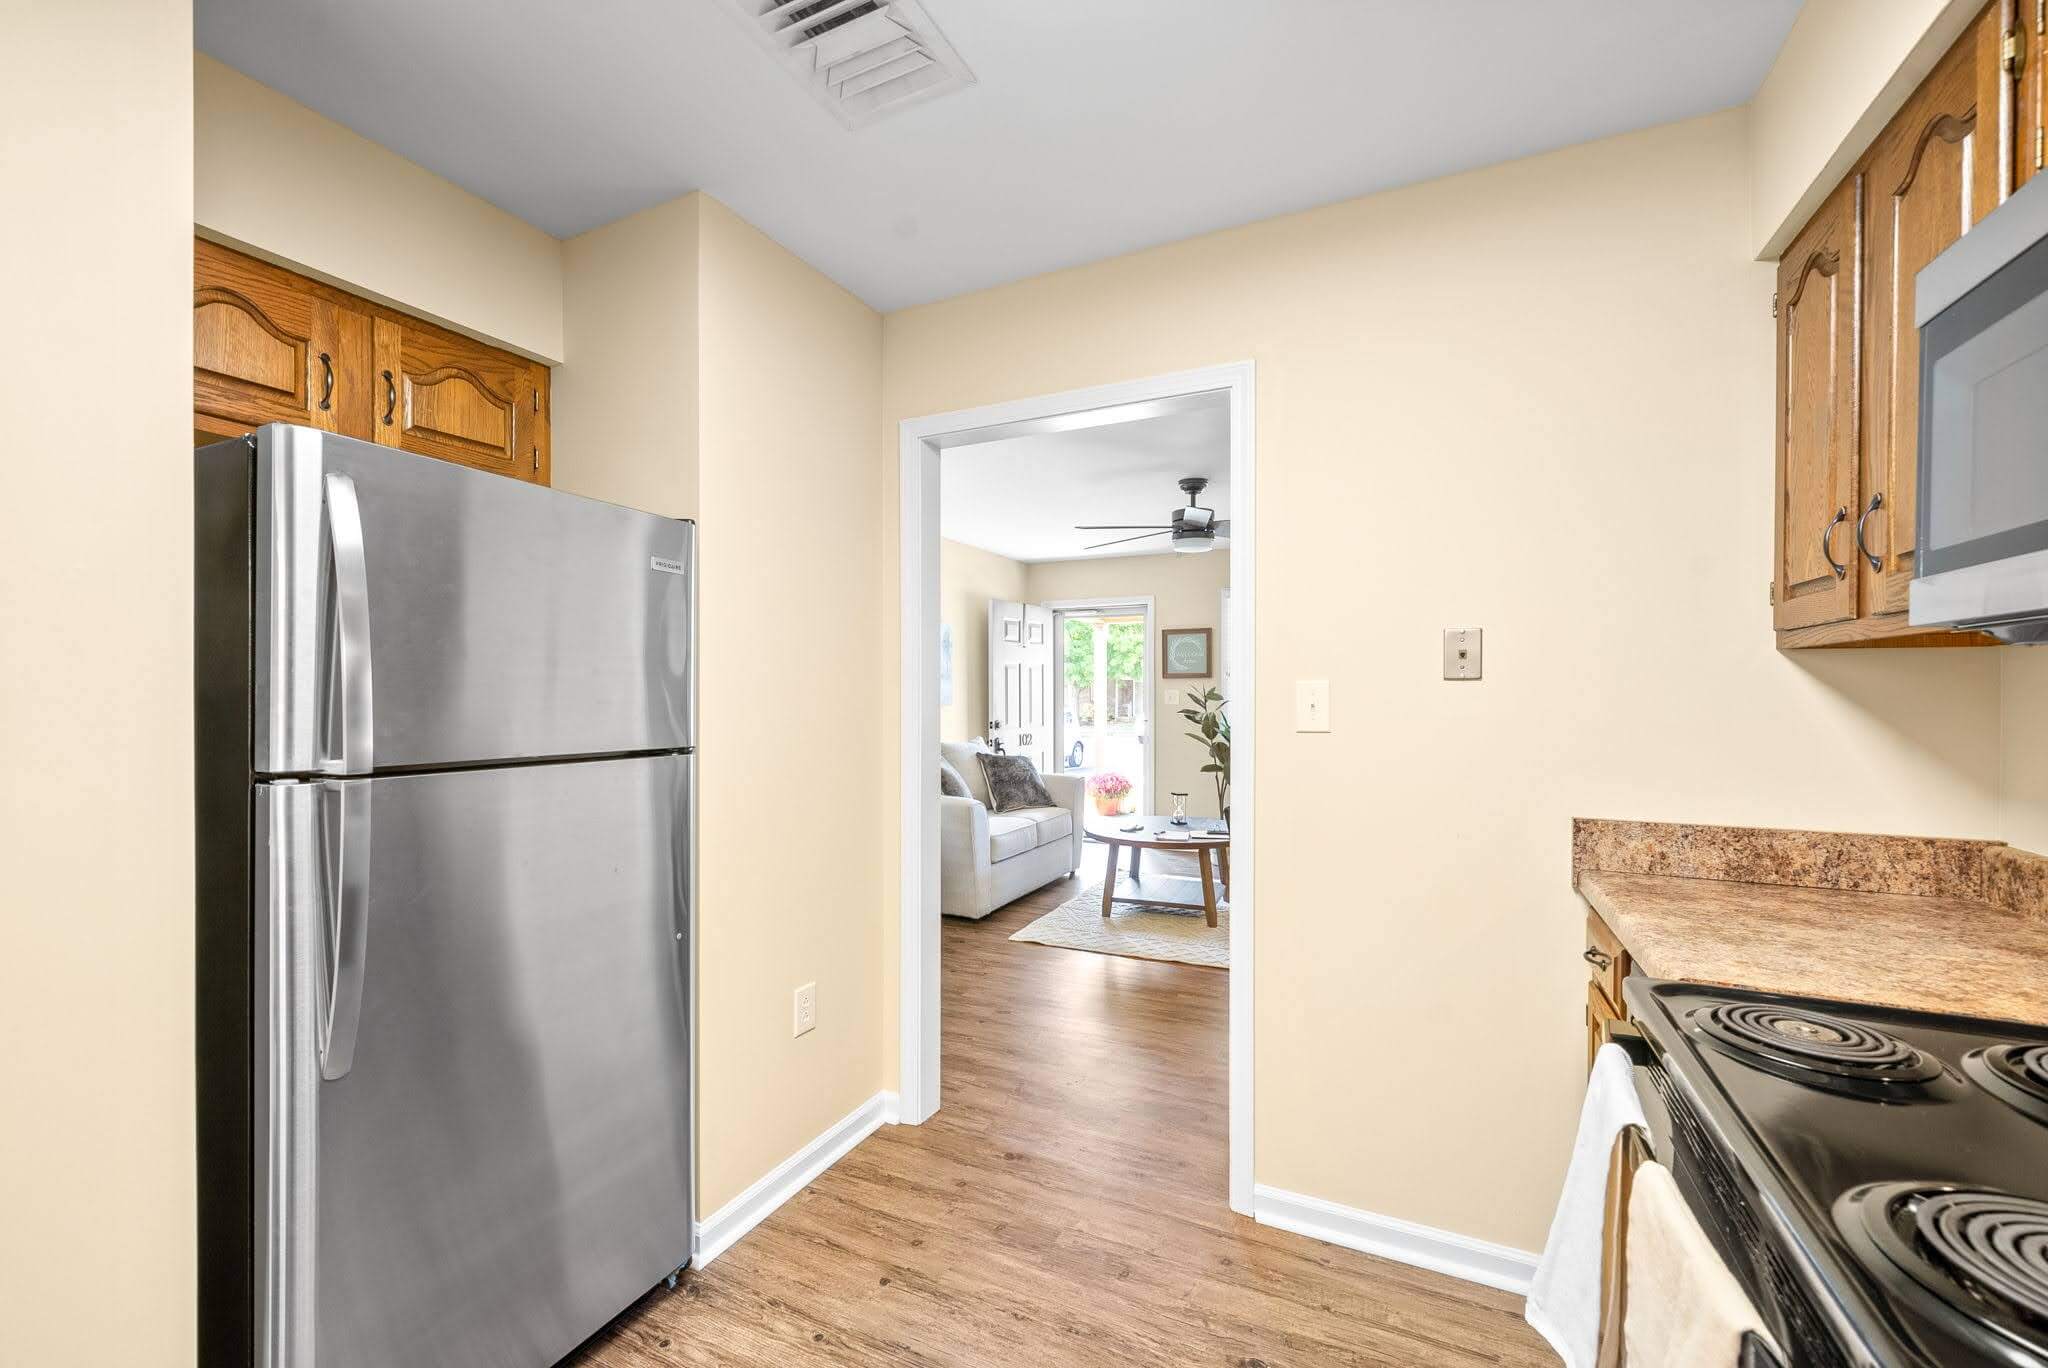
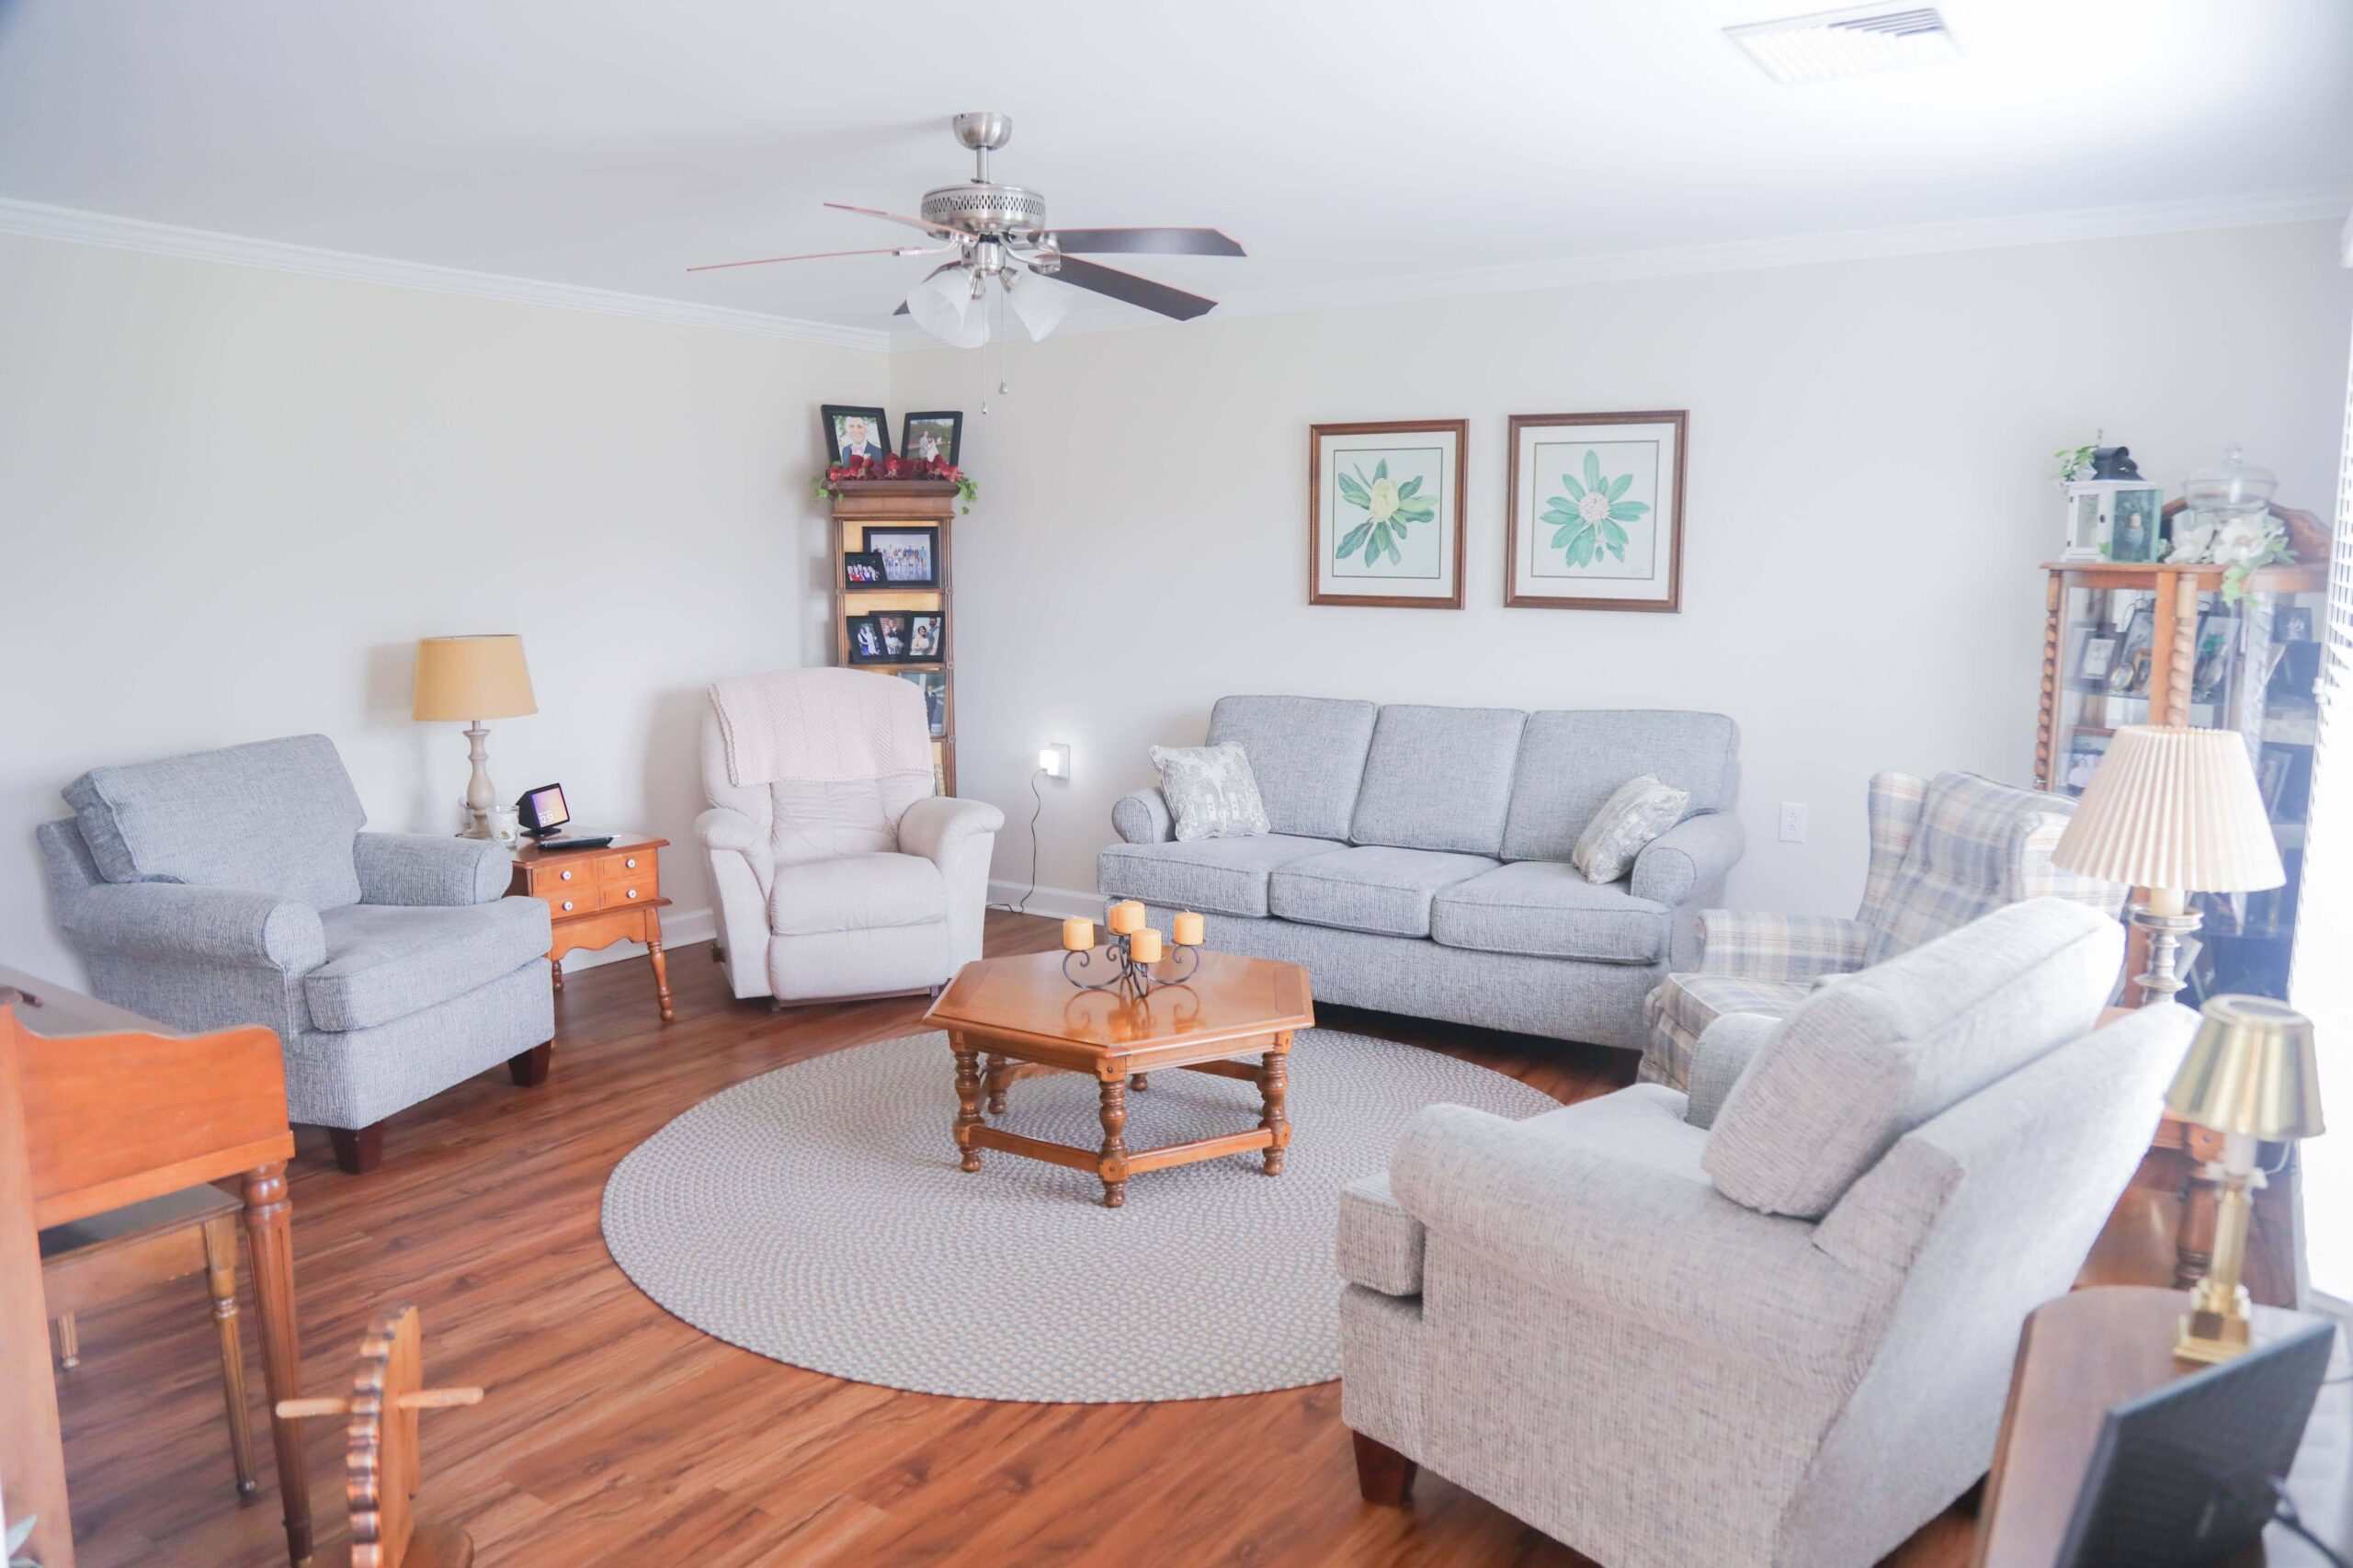
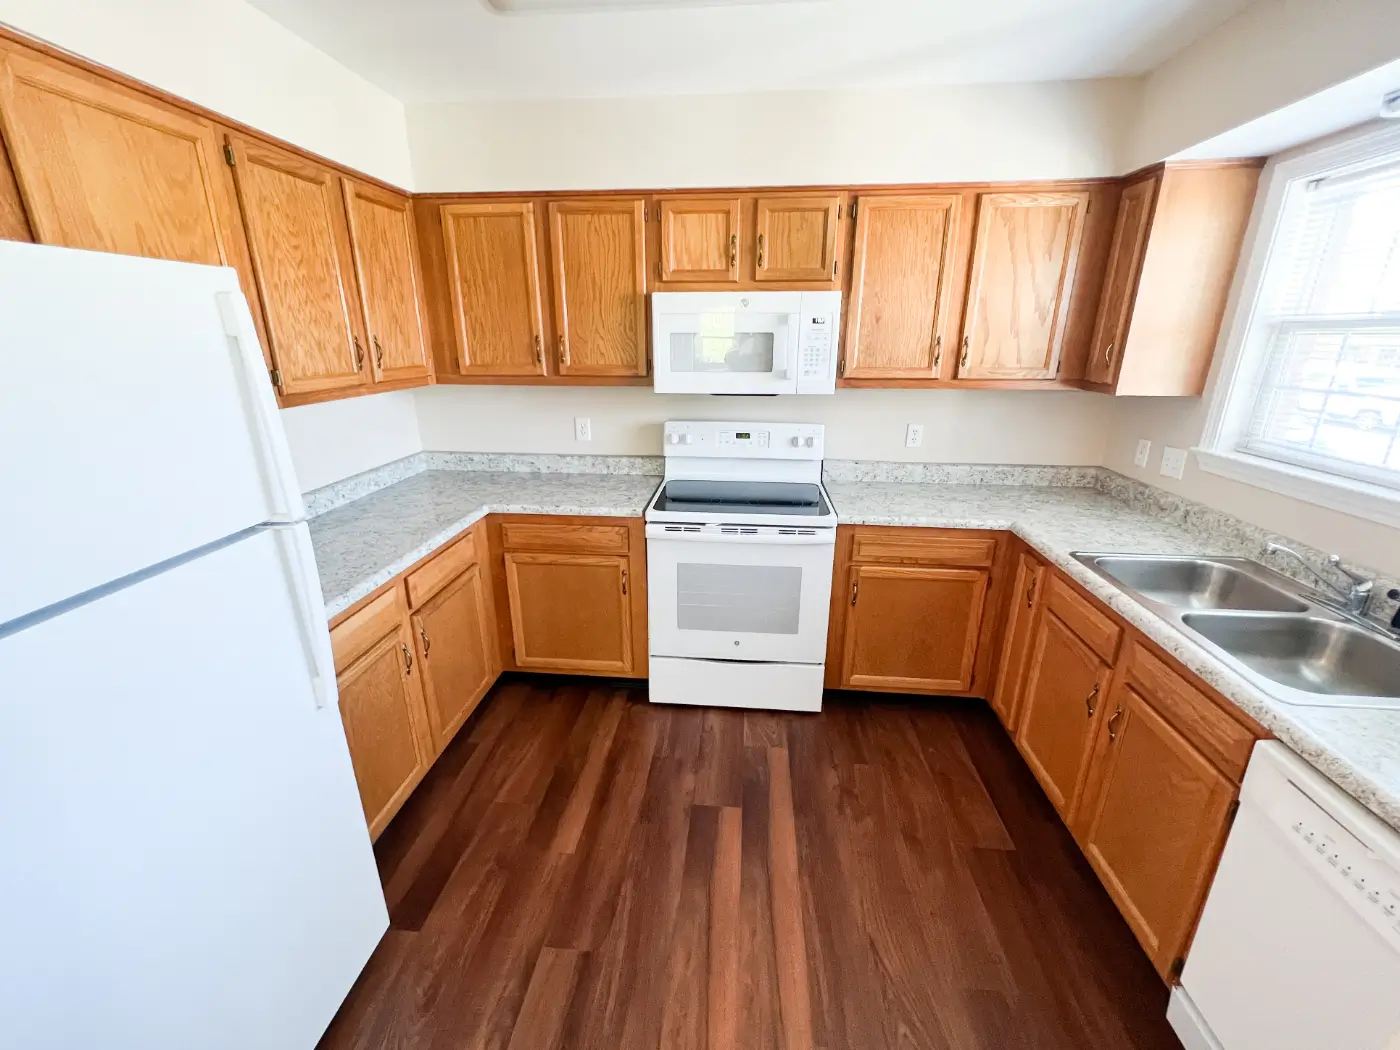


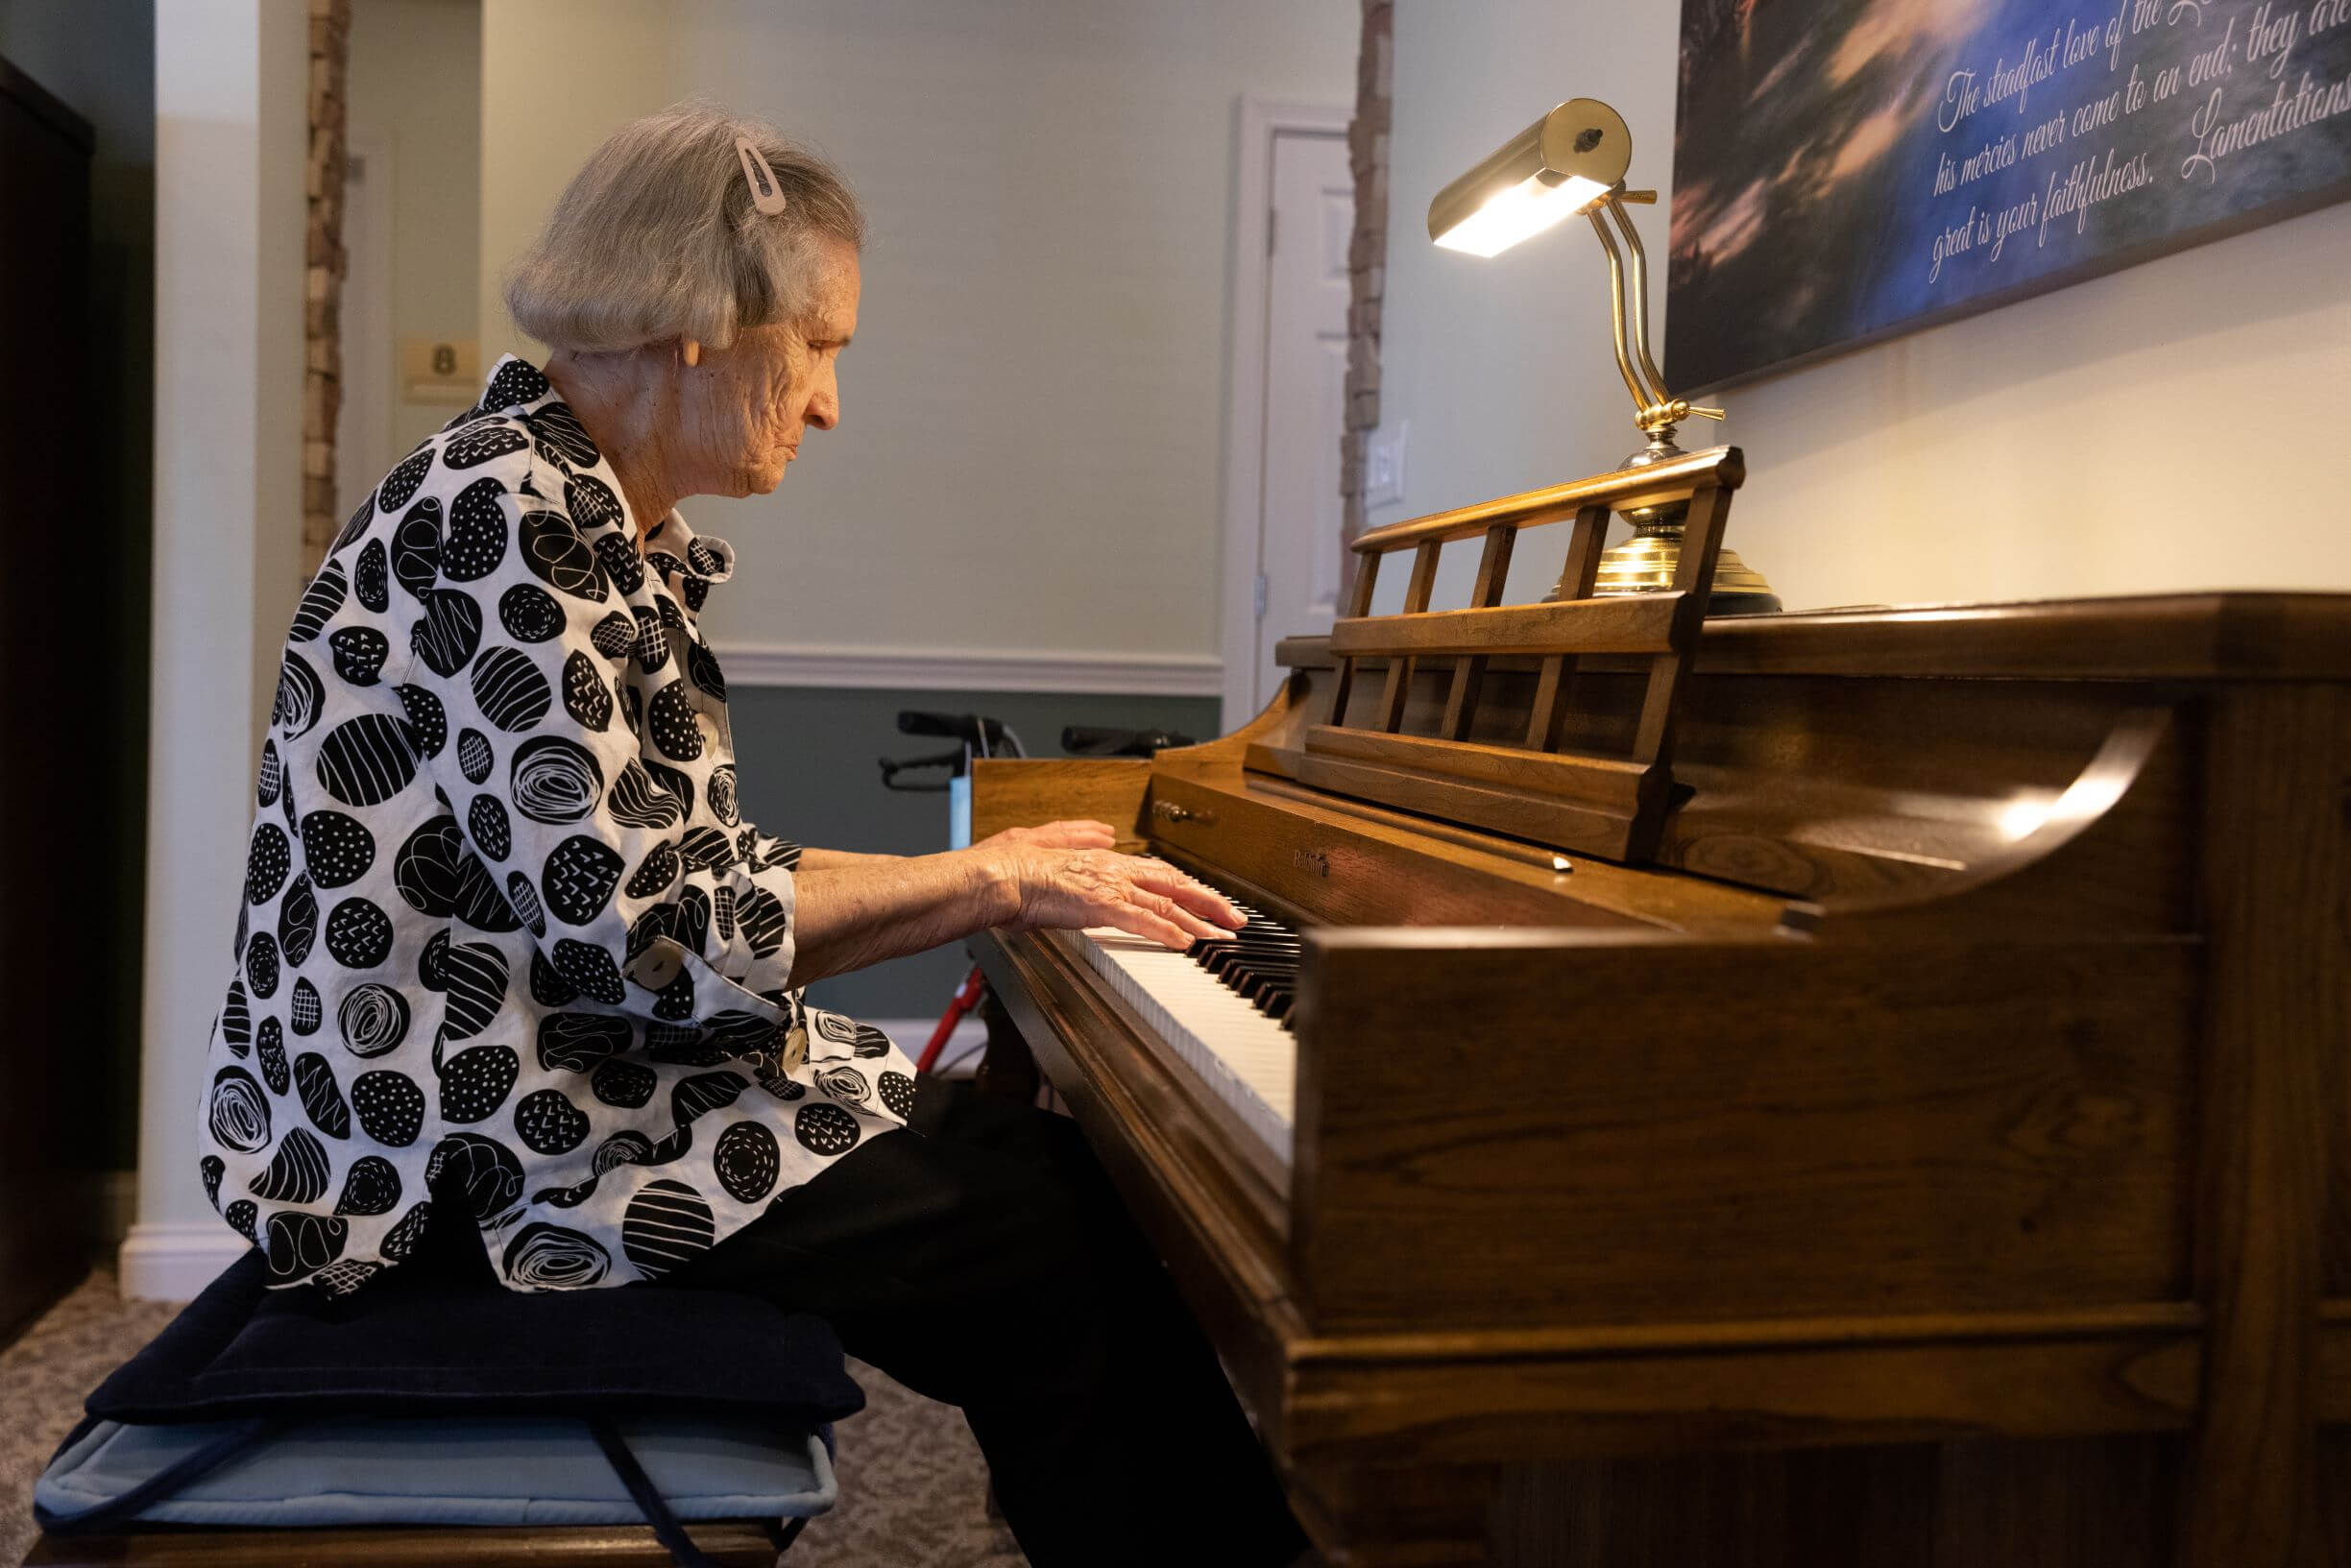


Christian Health Center of Bowling Green sits at 1880 Westen St, a single-story, 45-bed nursing home covering four care types under one roof: nursing home care, assisted living, independent living, and memory care. Walkability is limited here, Walk Score 28, so most errands mean a car trip rather than a walk down the street. What stands out more is occupancy: 93.6%, which is high enough to suggest steady, consistent demand rather than a facility working to fill beds. The average stay runs about 70 days, a length that fits short-term rehab as much as longer placements.
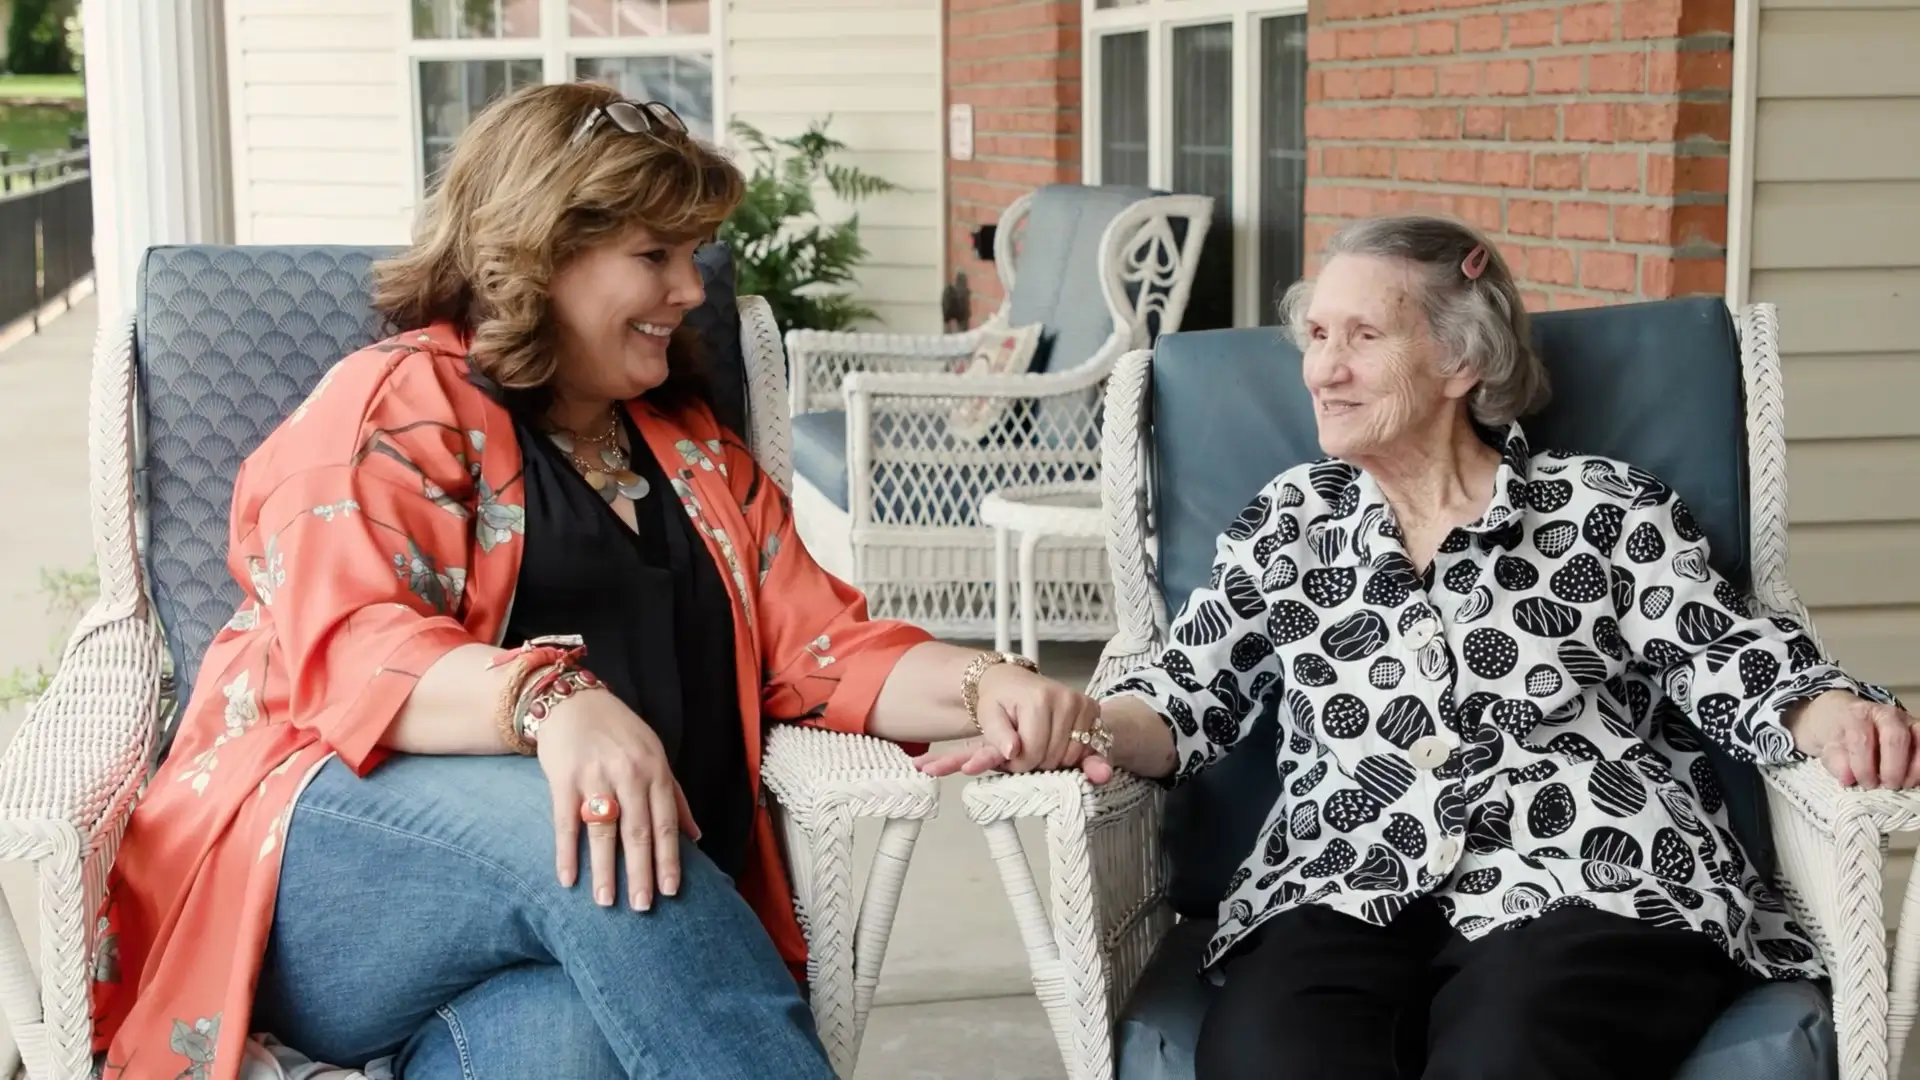
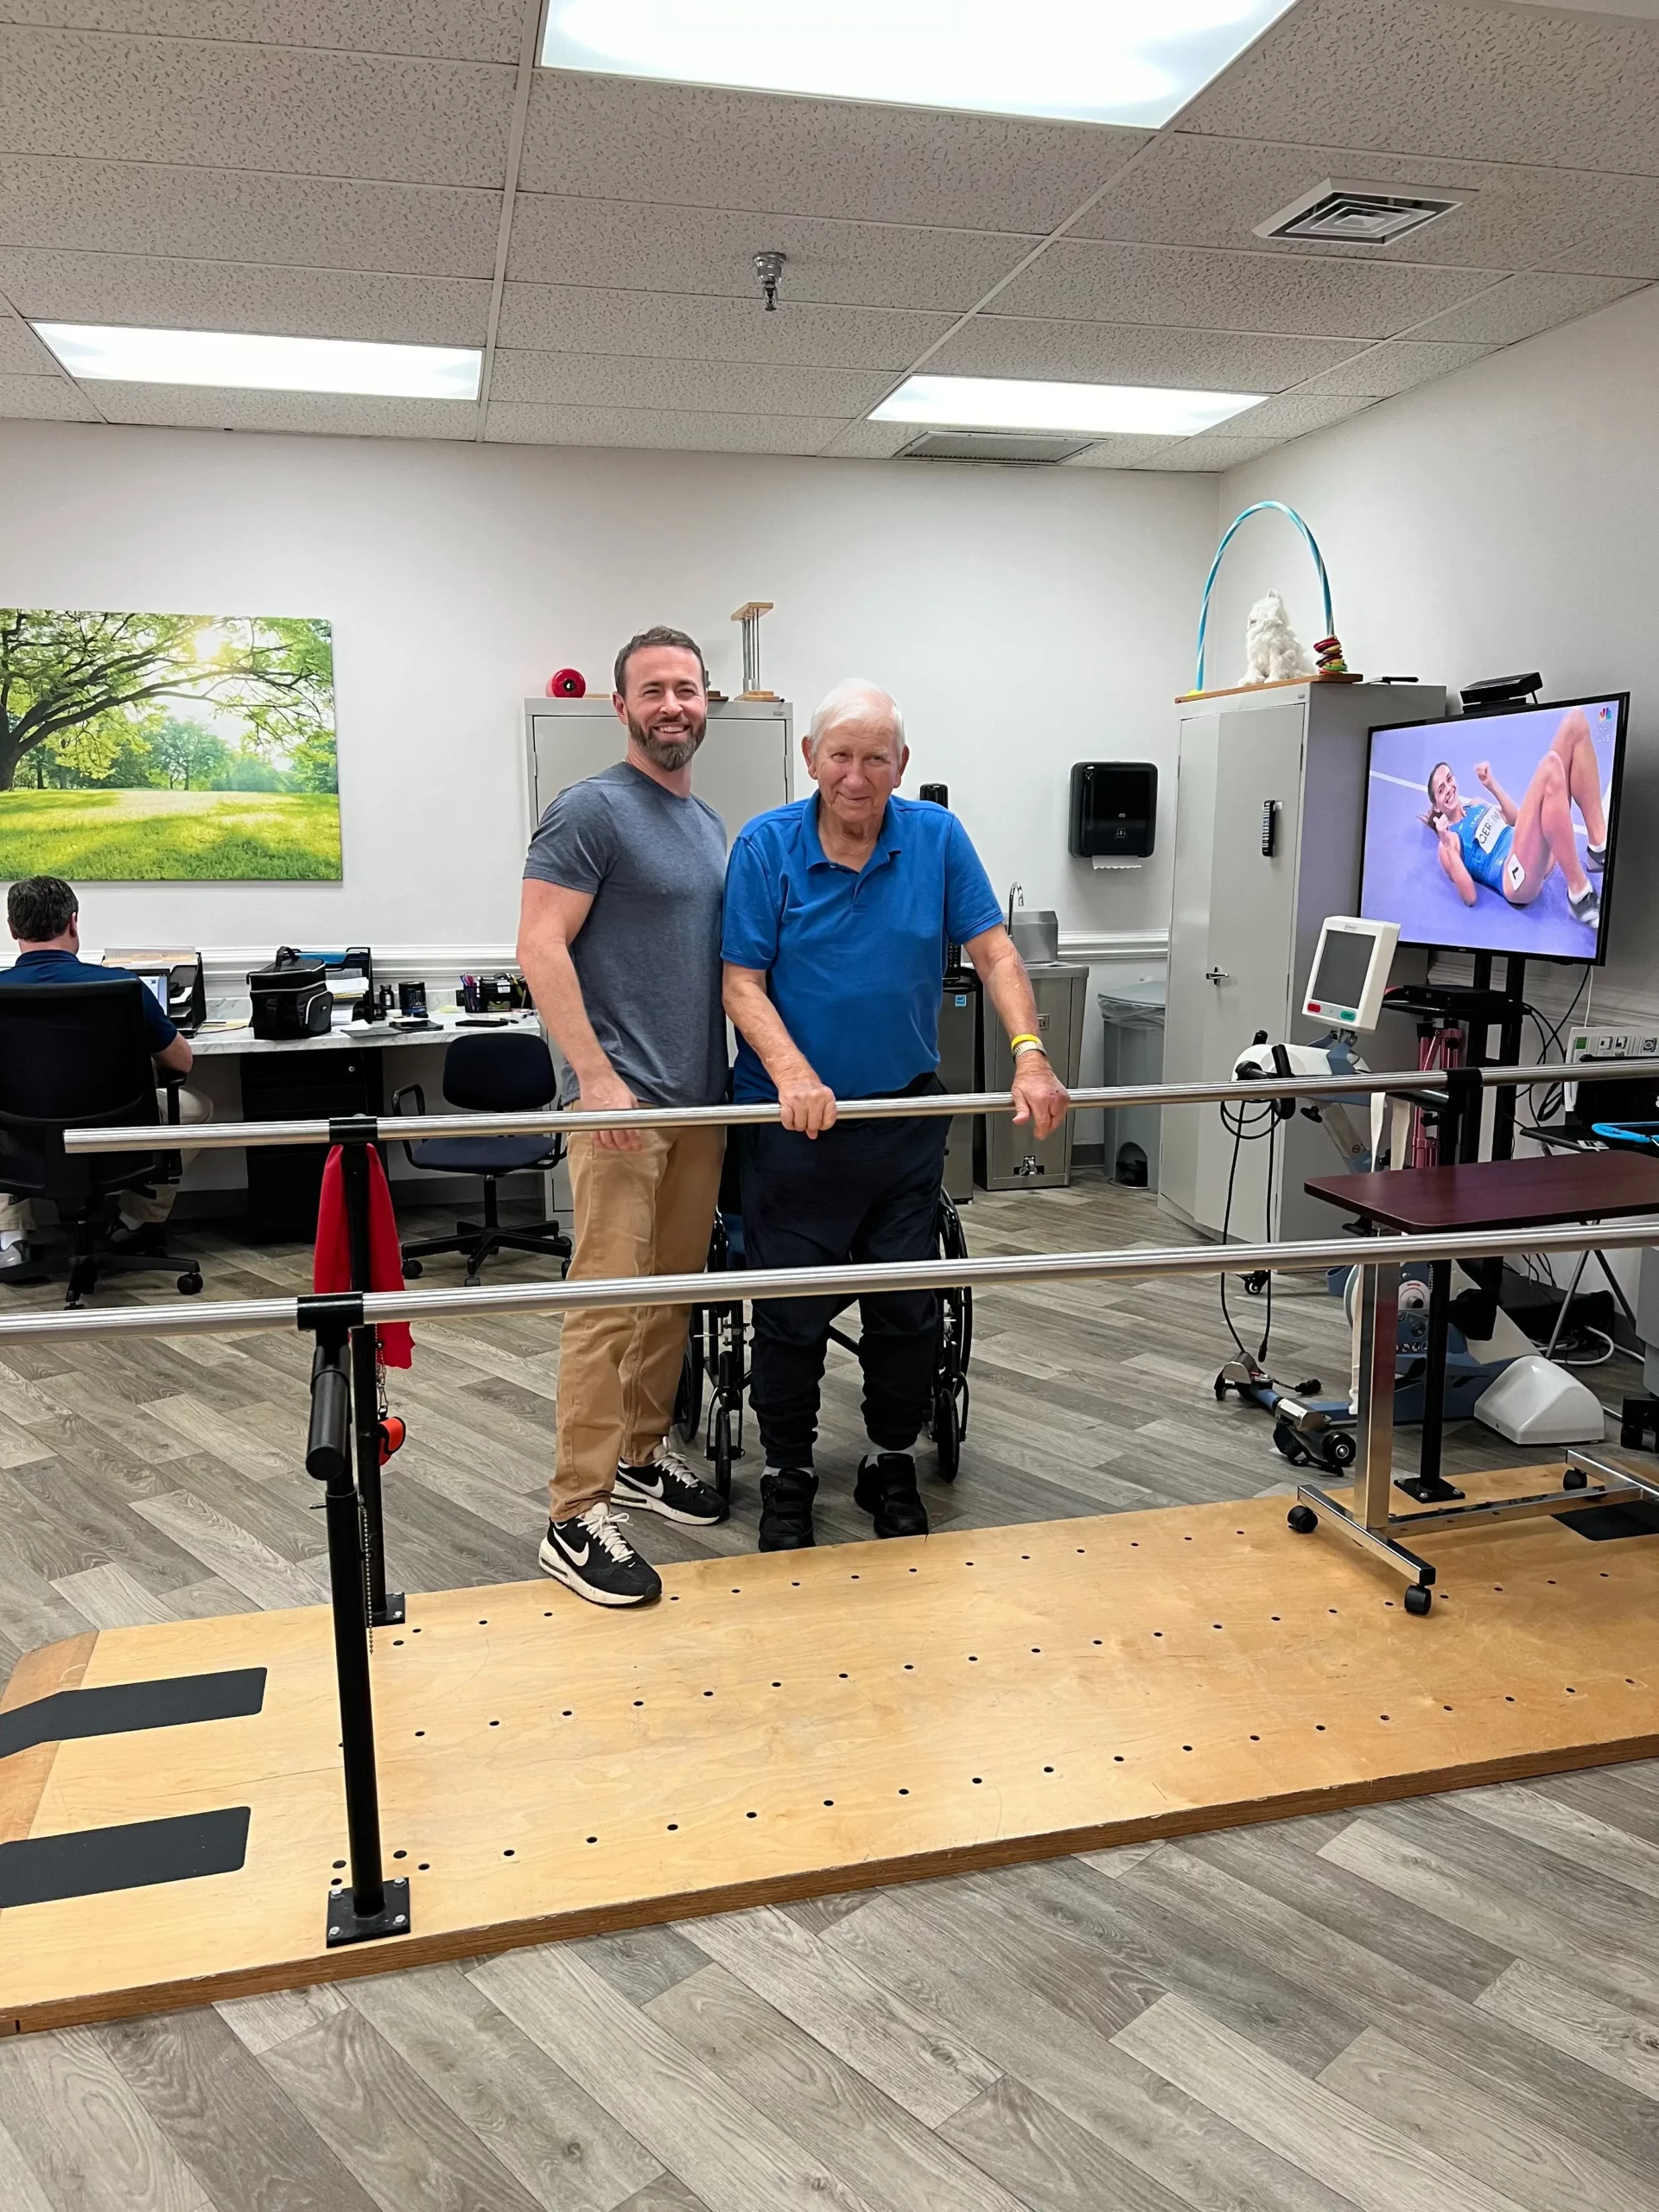
On the care side, rehabilitation services and 24-hour staffing anchor daily operations, with a specific short-term rehab track built into the program structure. The facility also runs the Best Friends™ Approach, a named engagement program rather than a generic activities label. Medicare and Medicaid are both accepted, and pets are allowed, two details that matter differently but both expand who this facility can realistically serve.
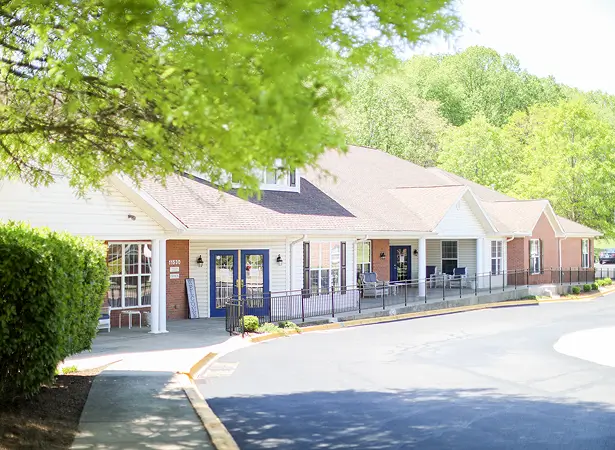
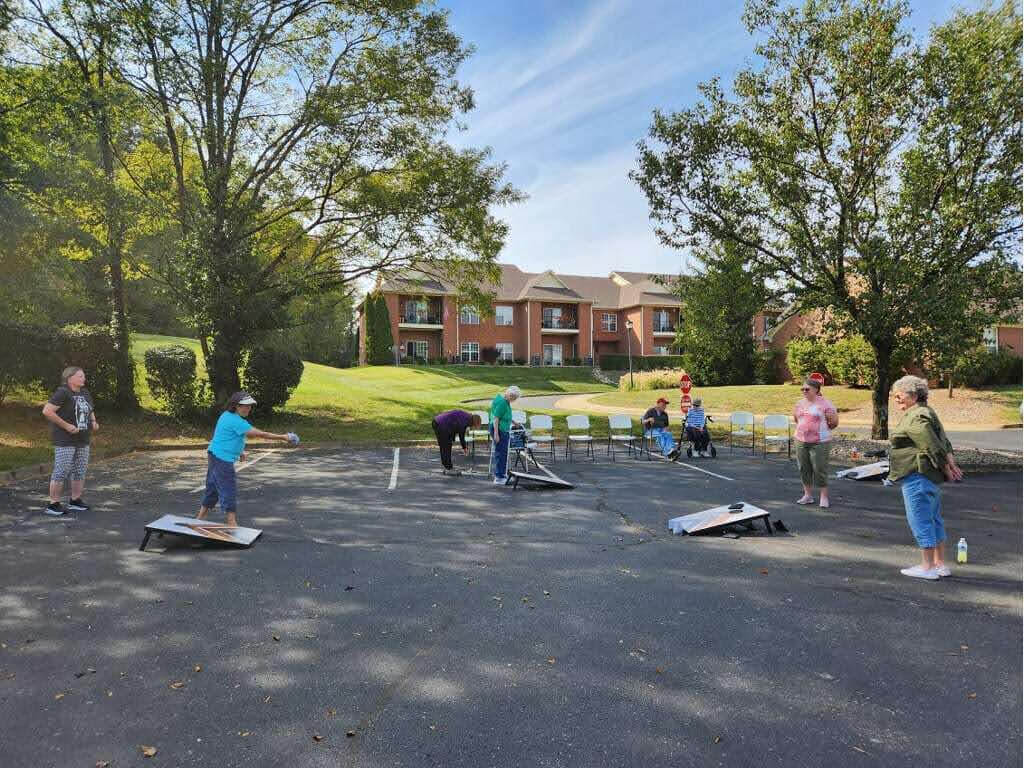
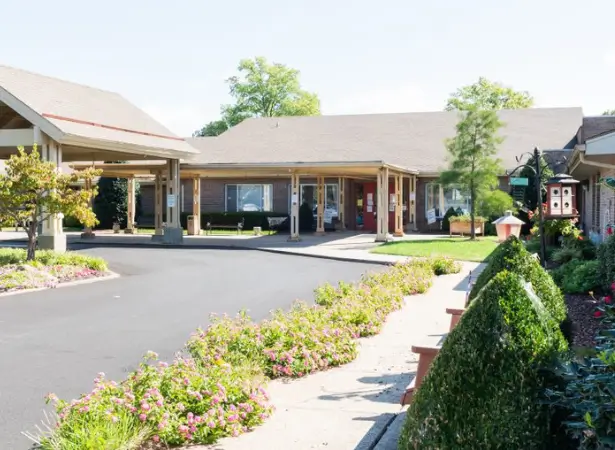
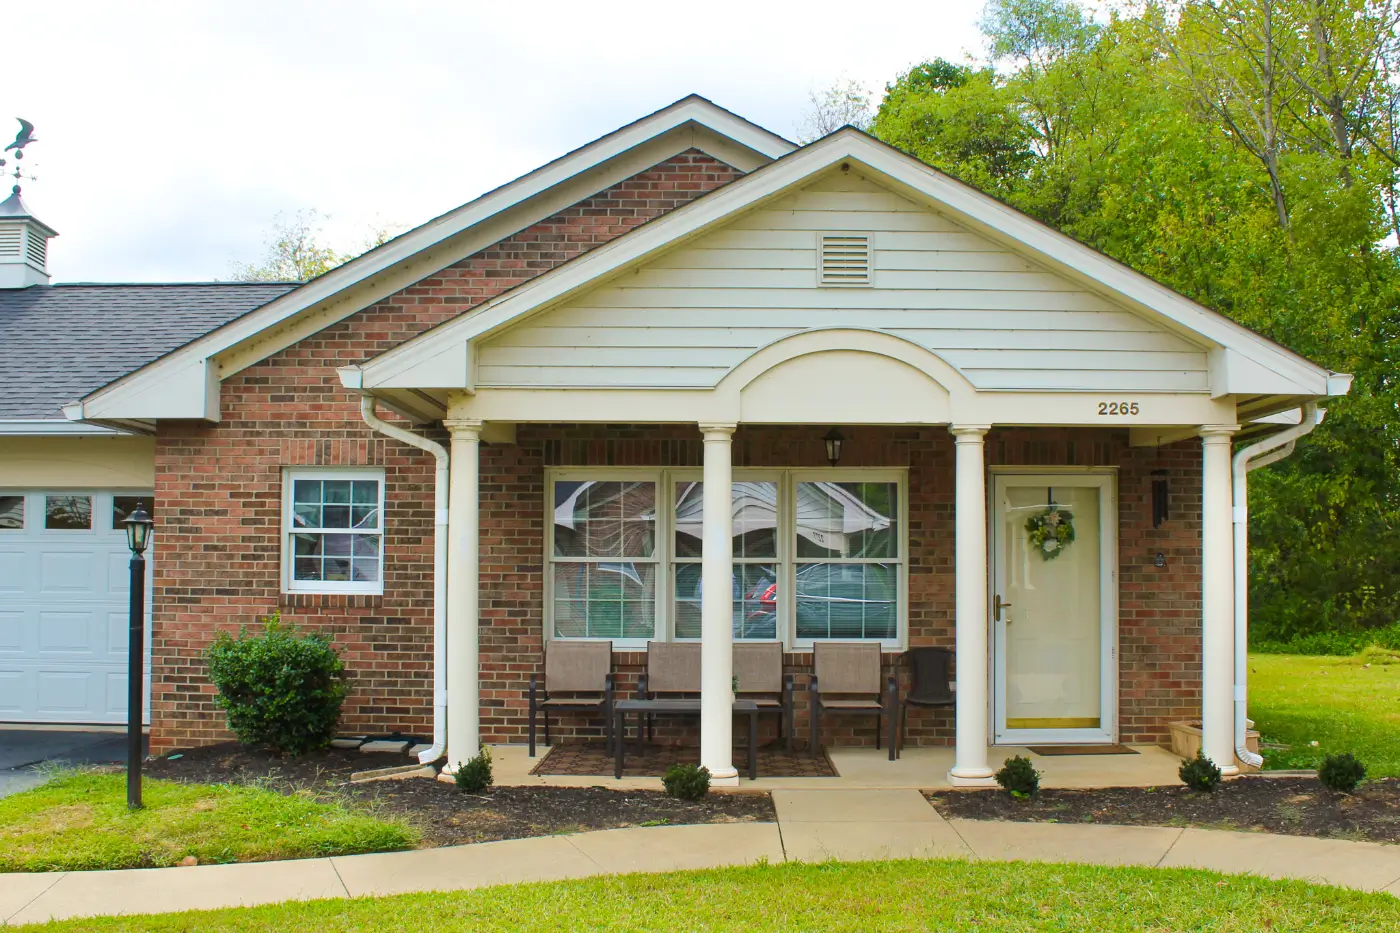
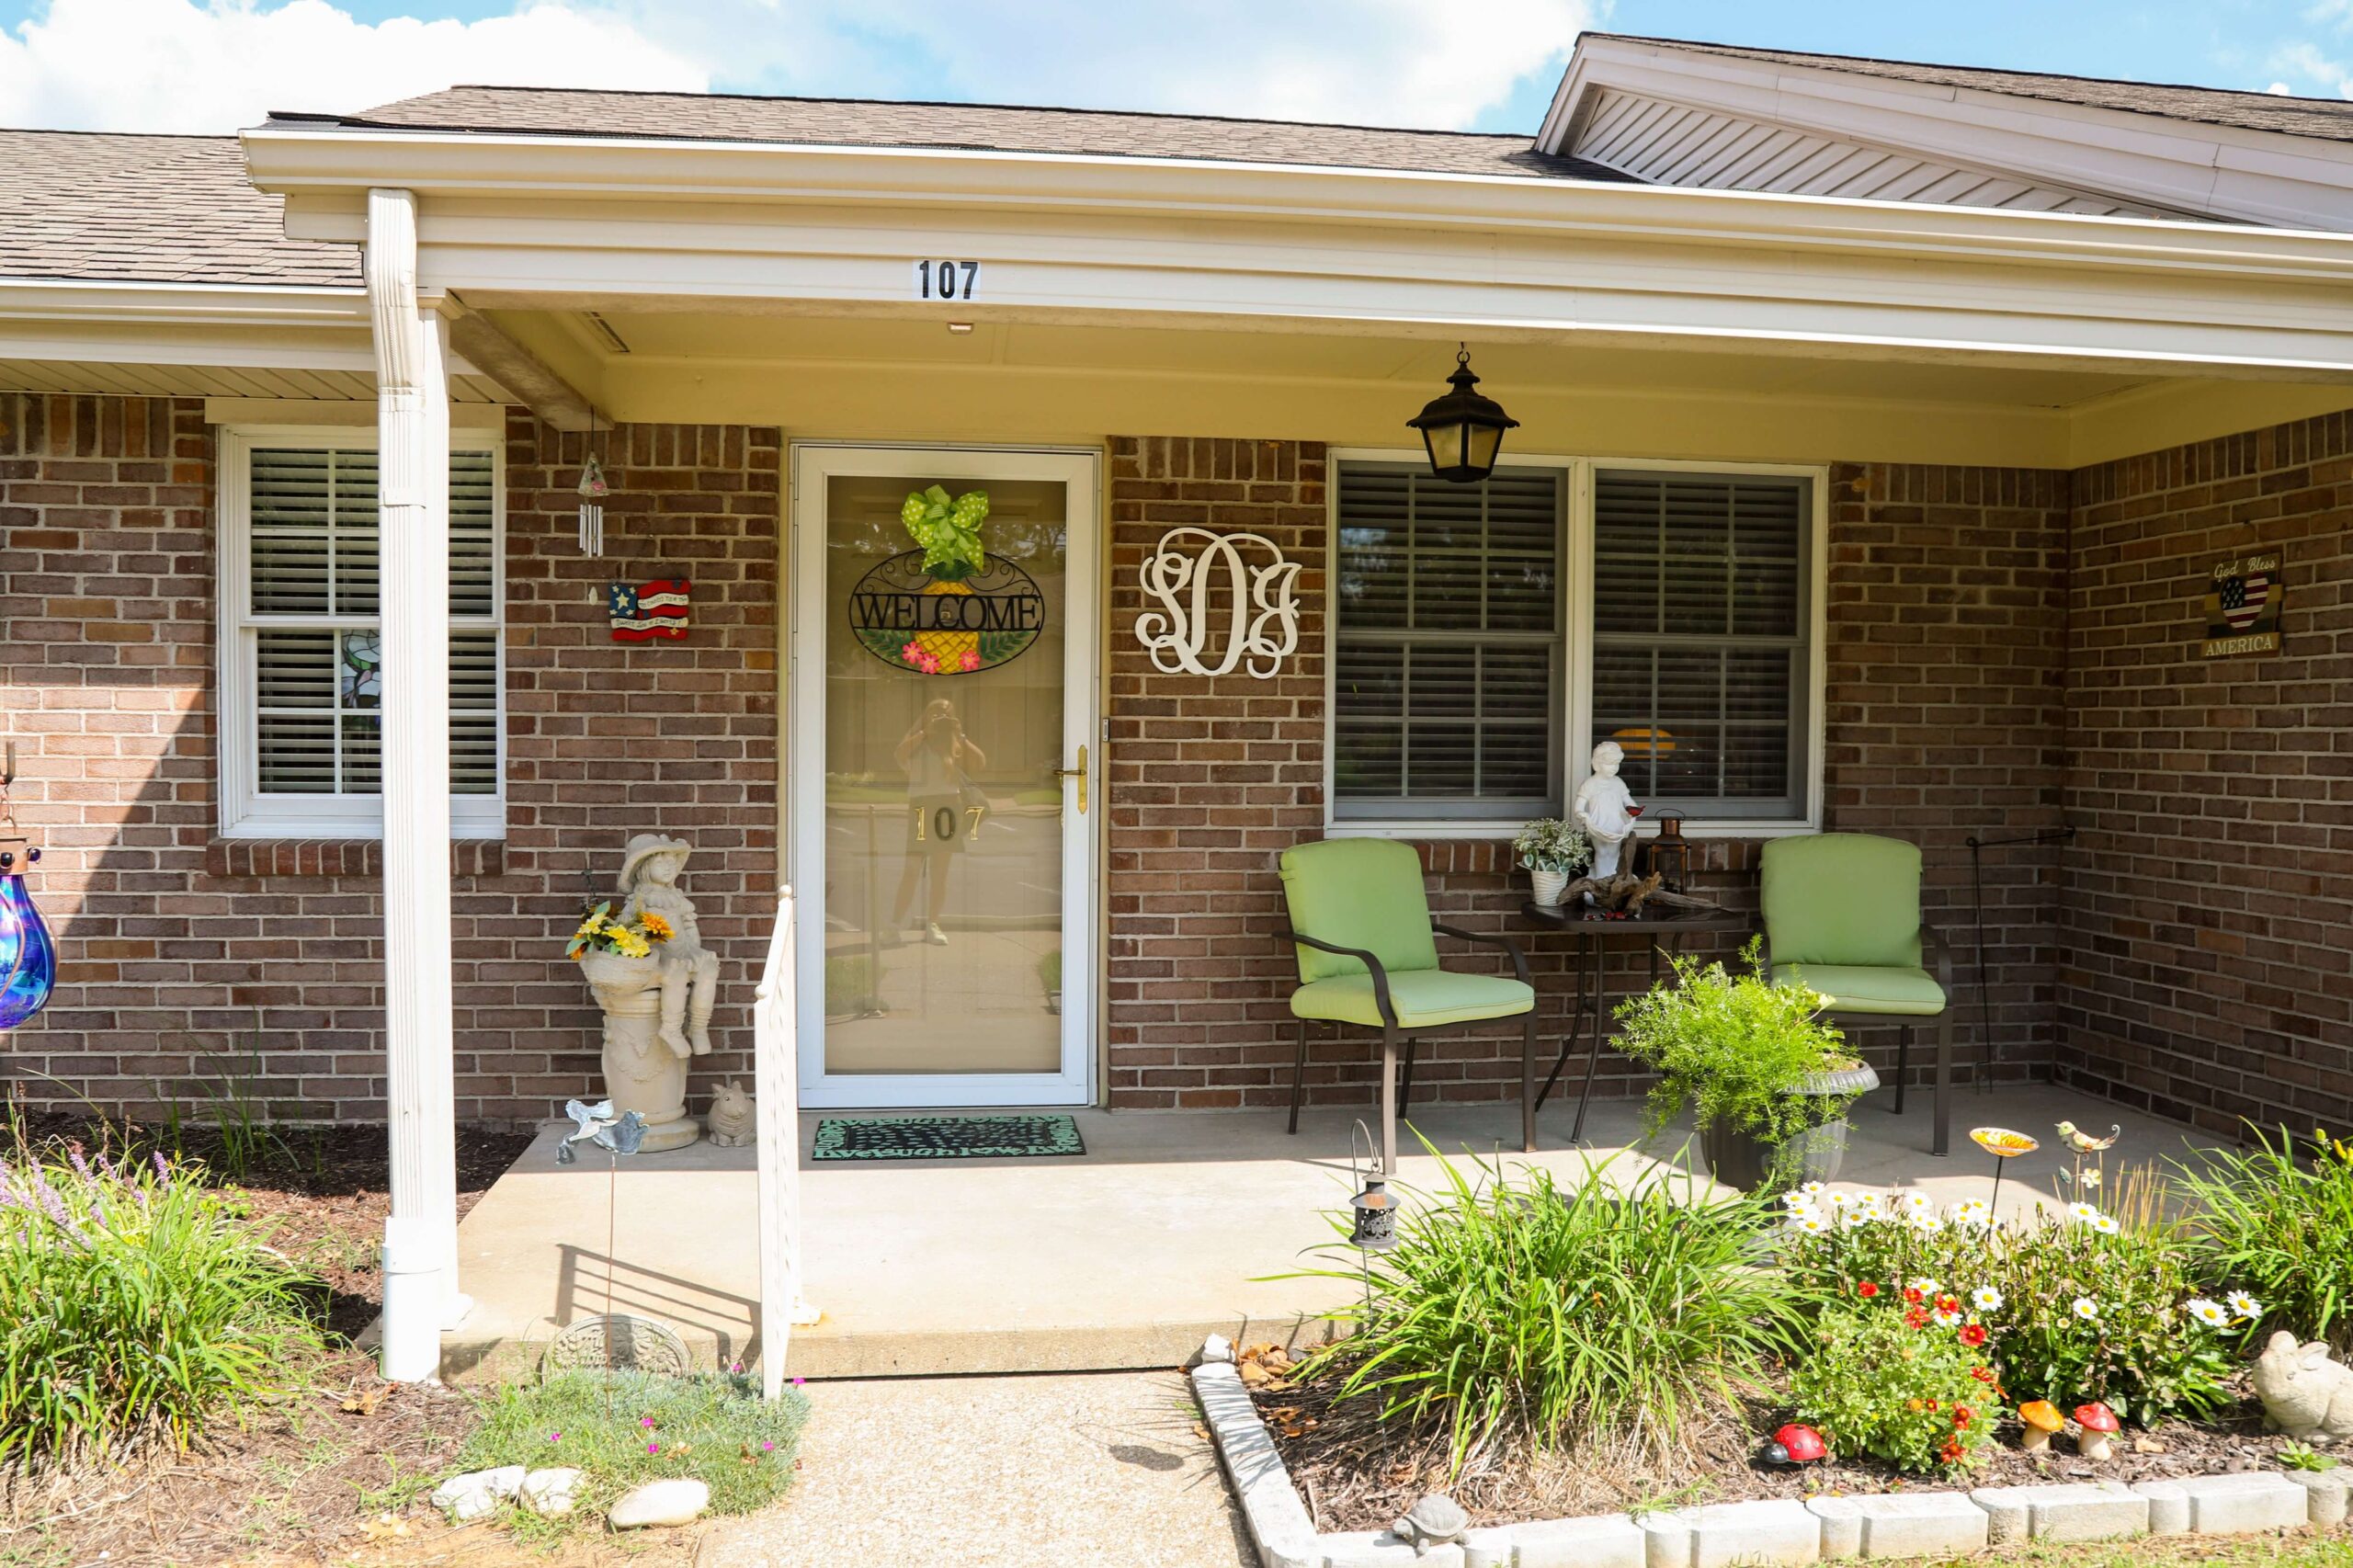
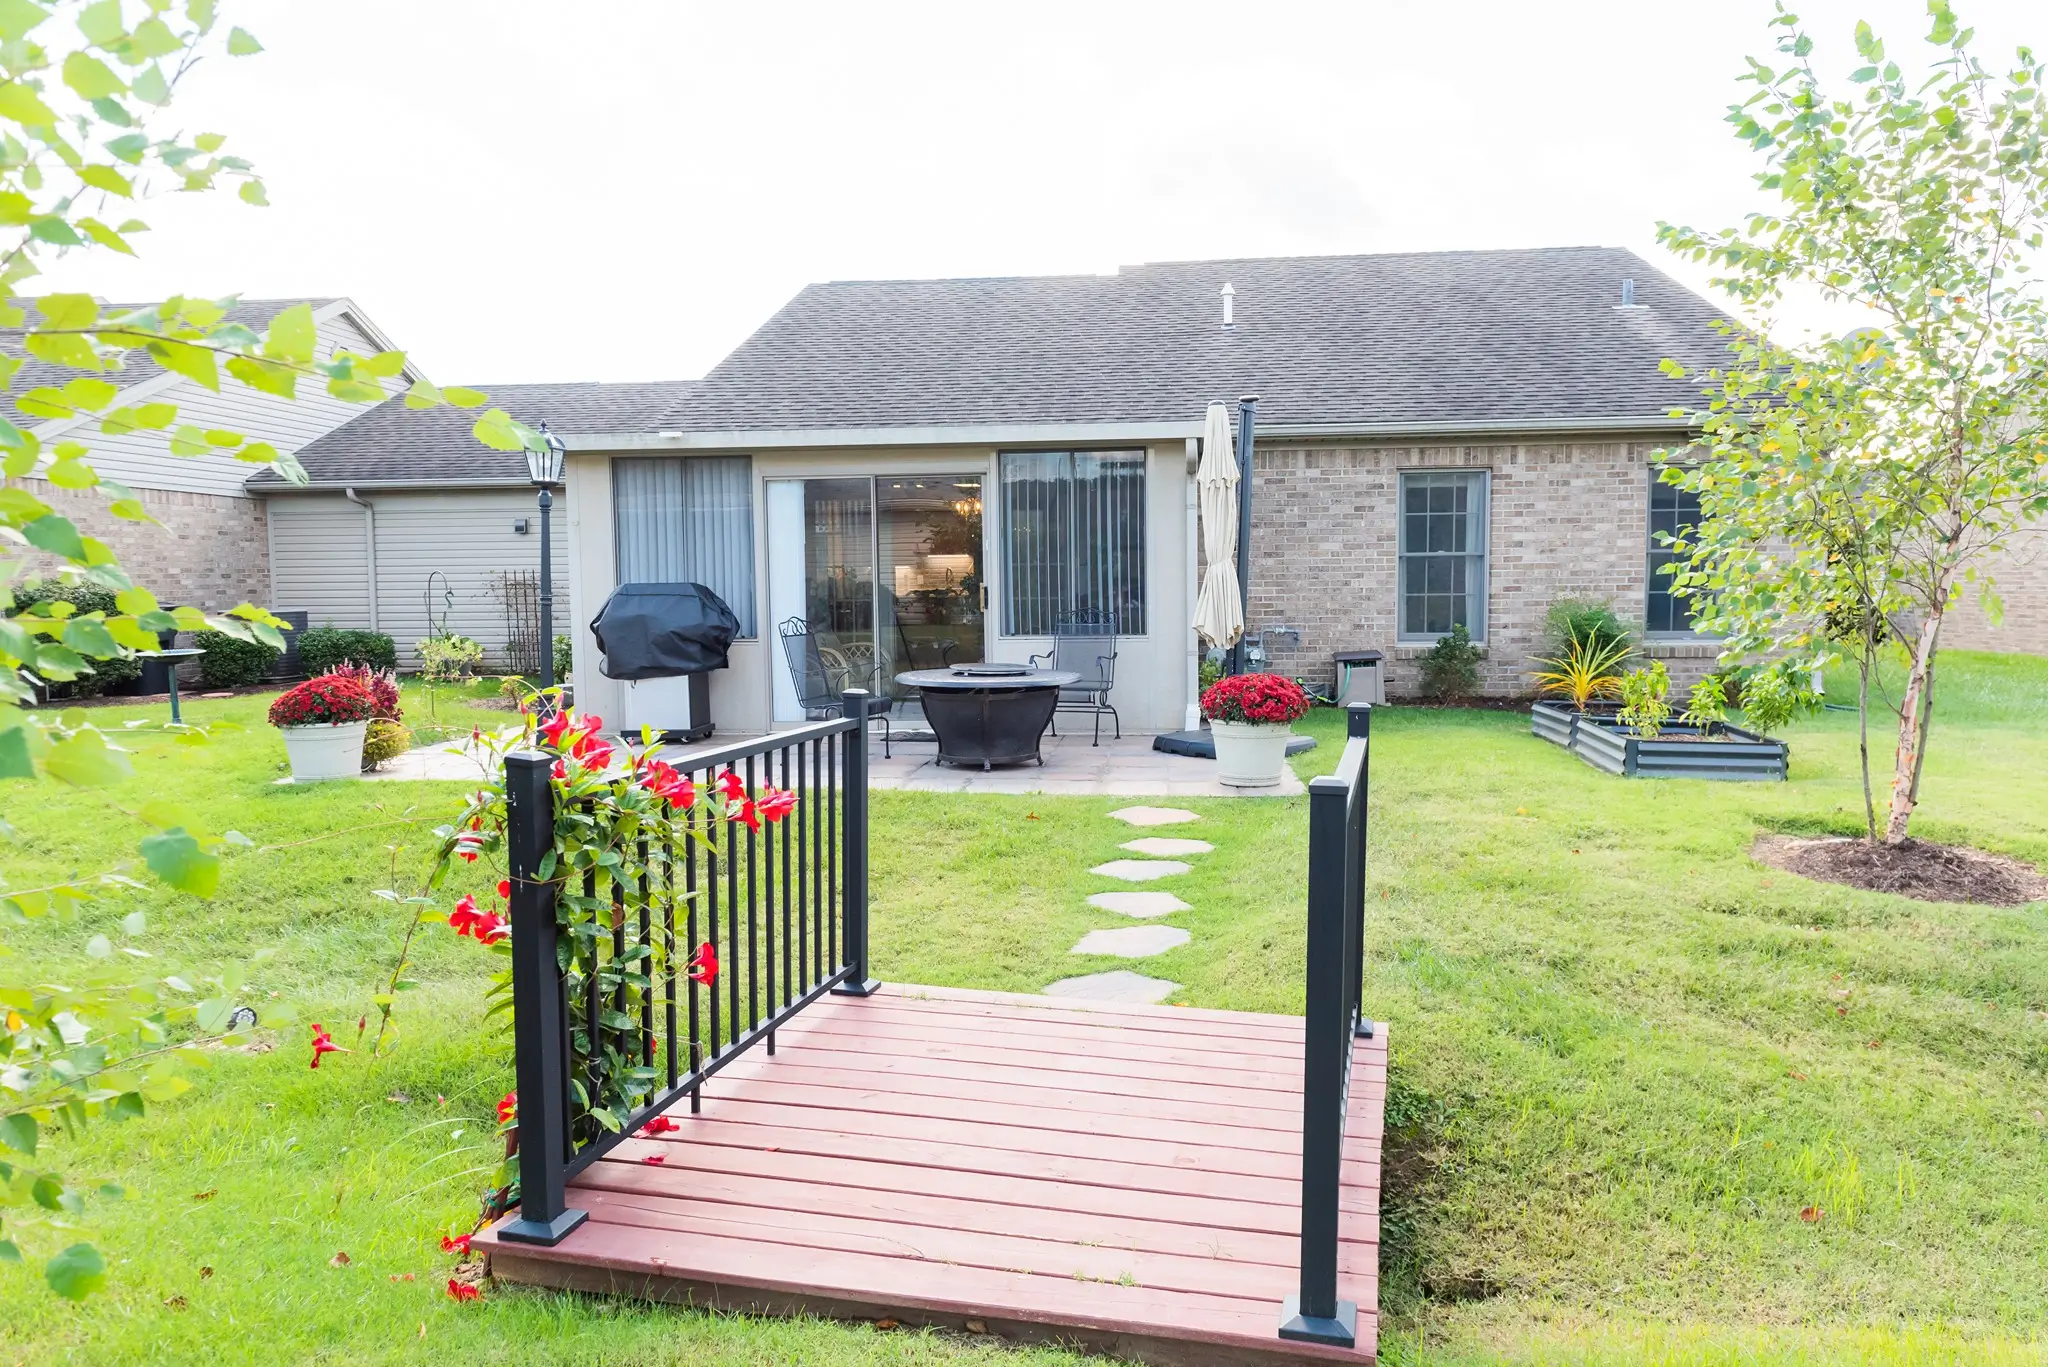
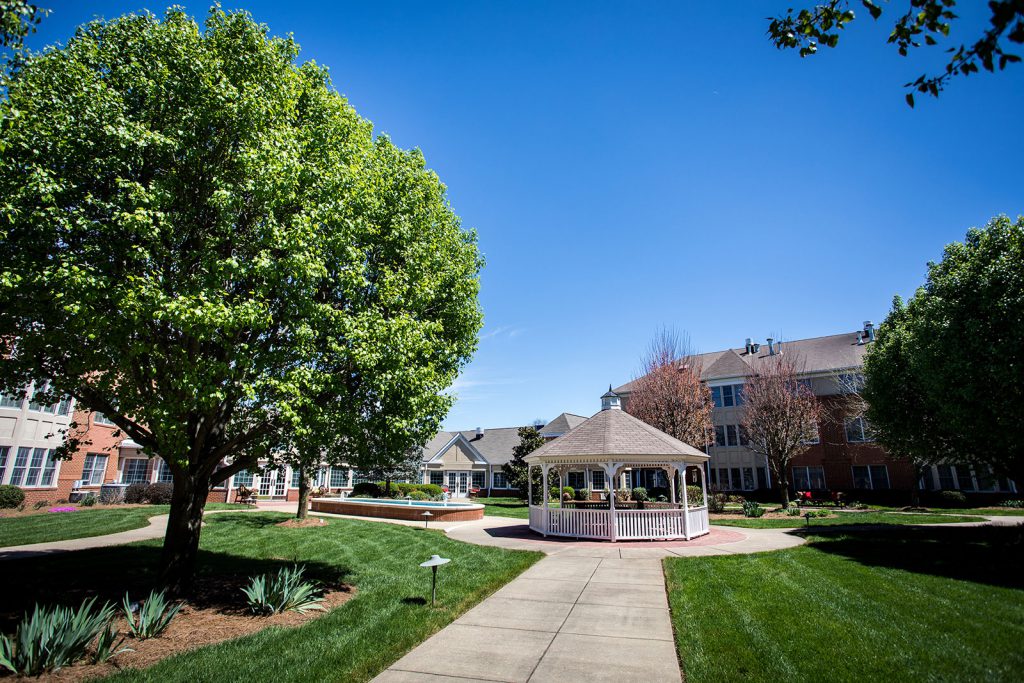
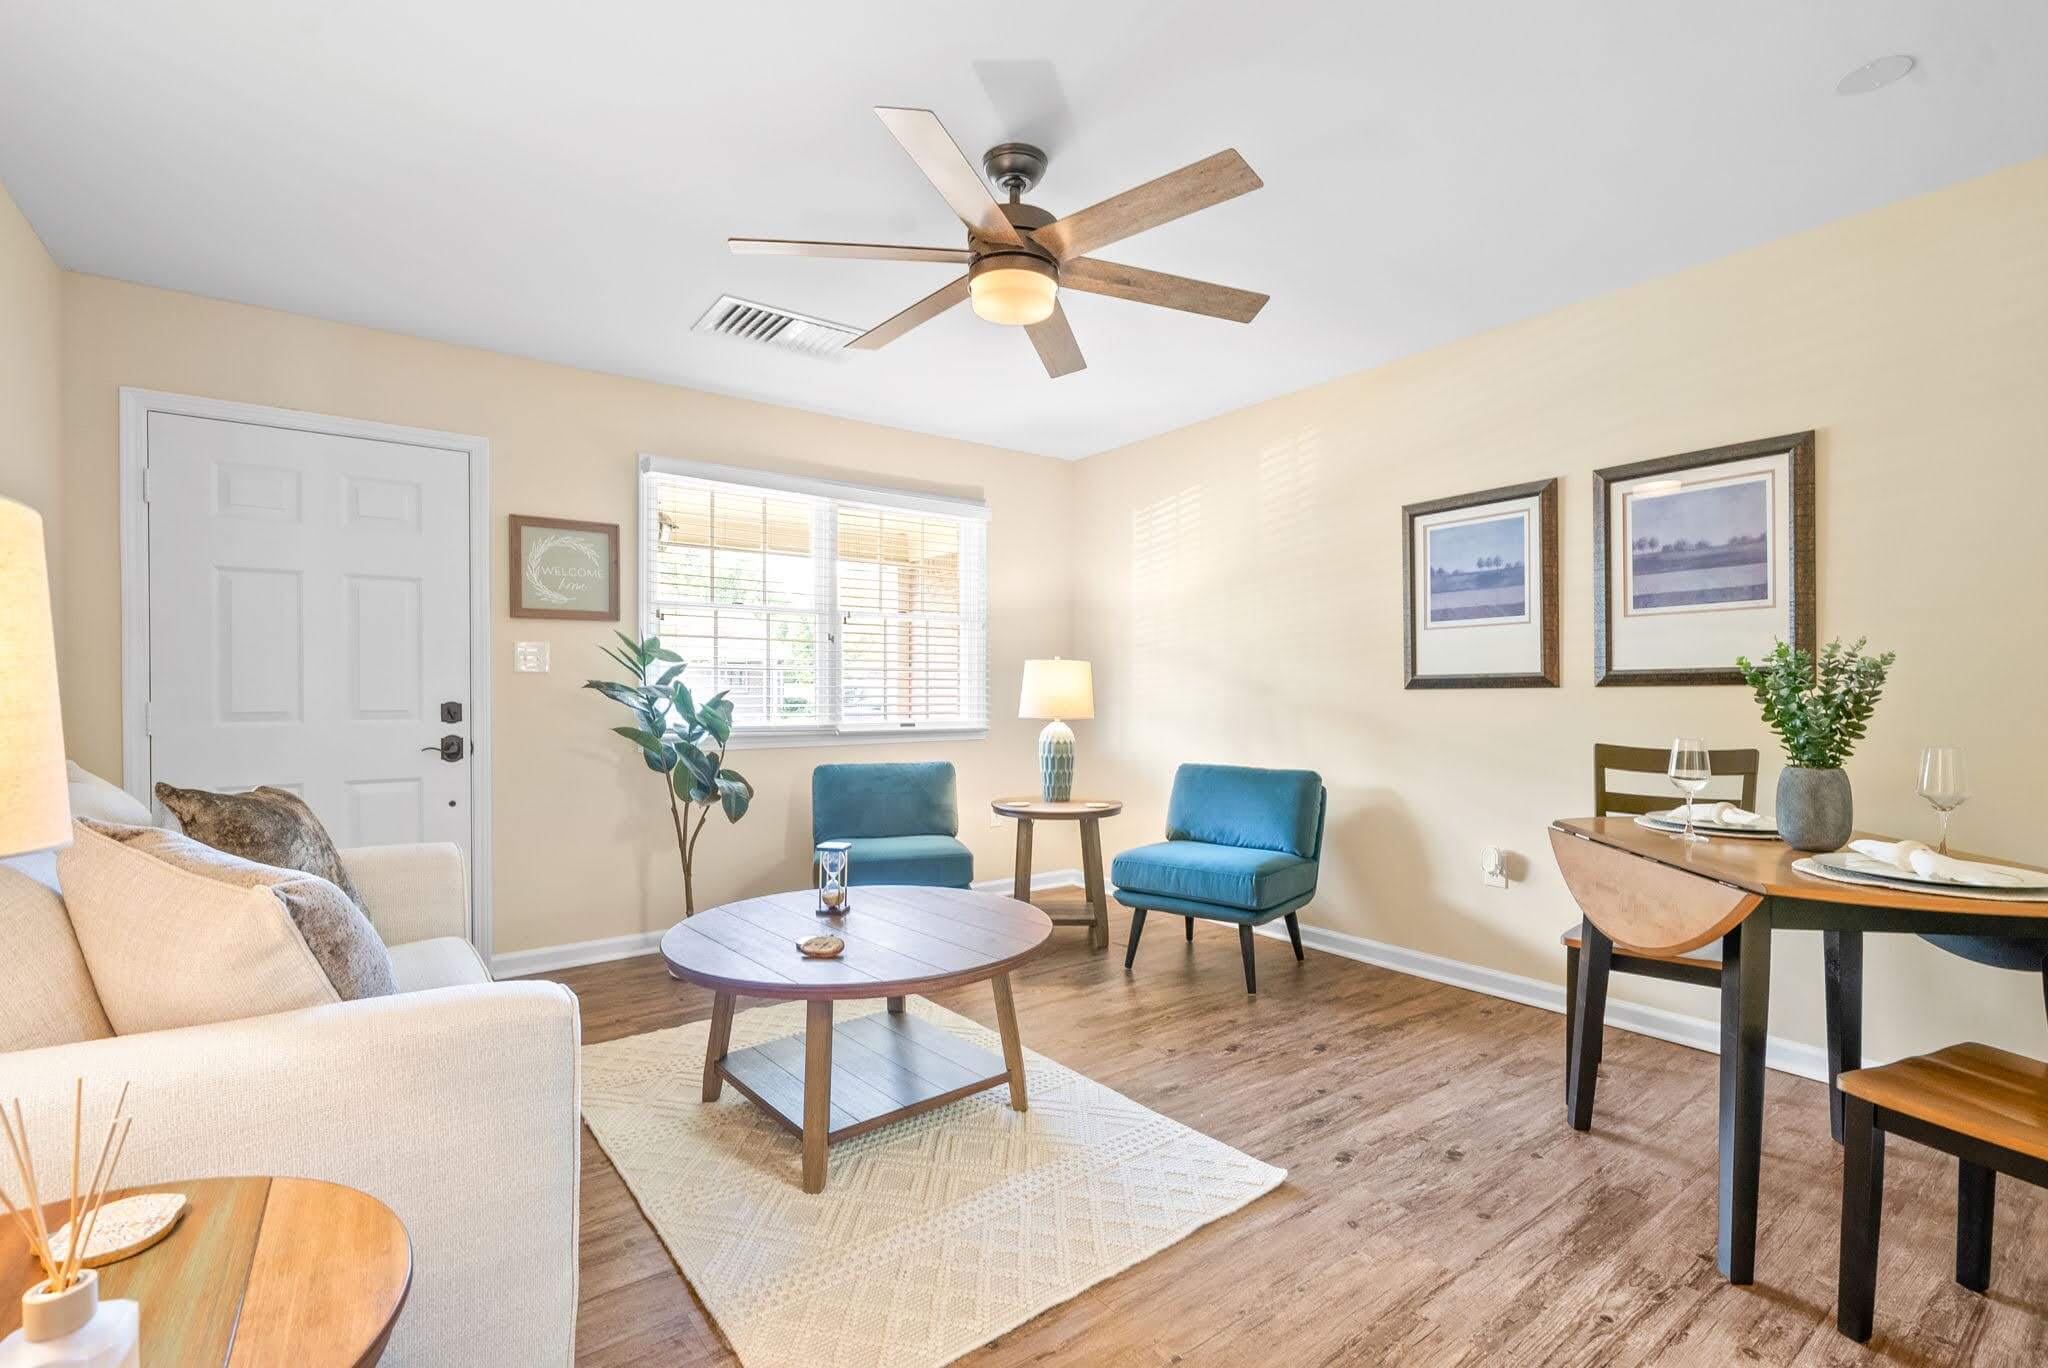
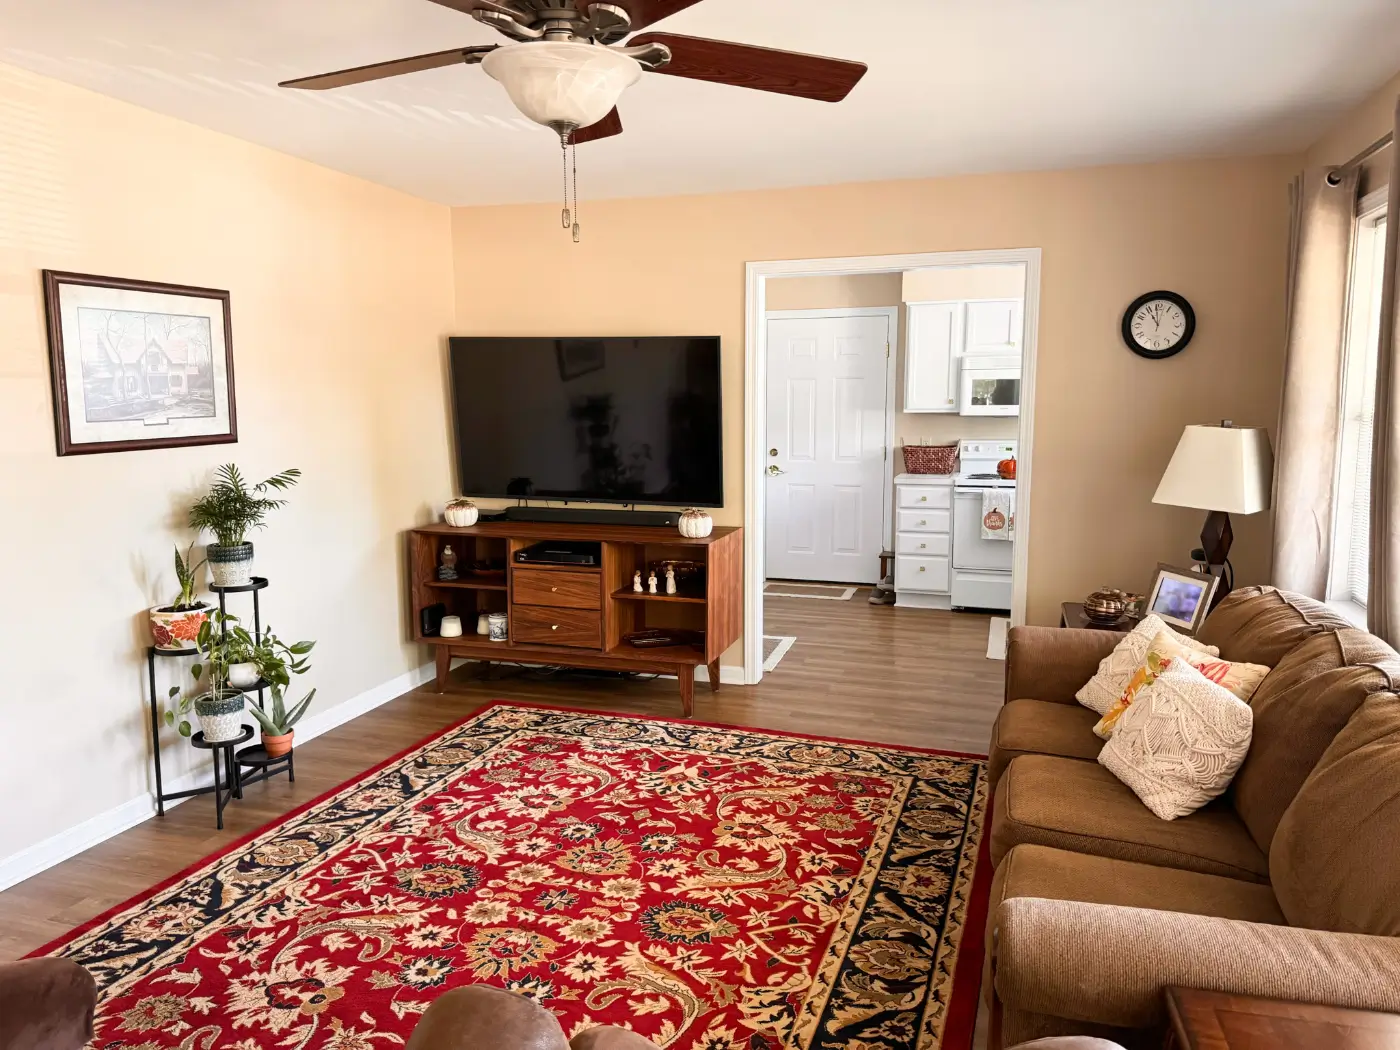
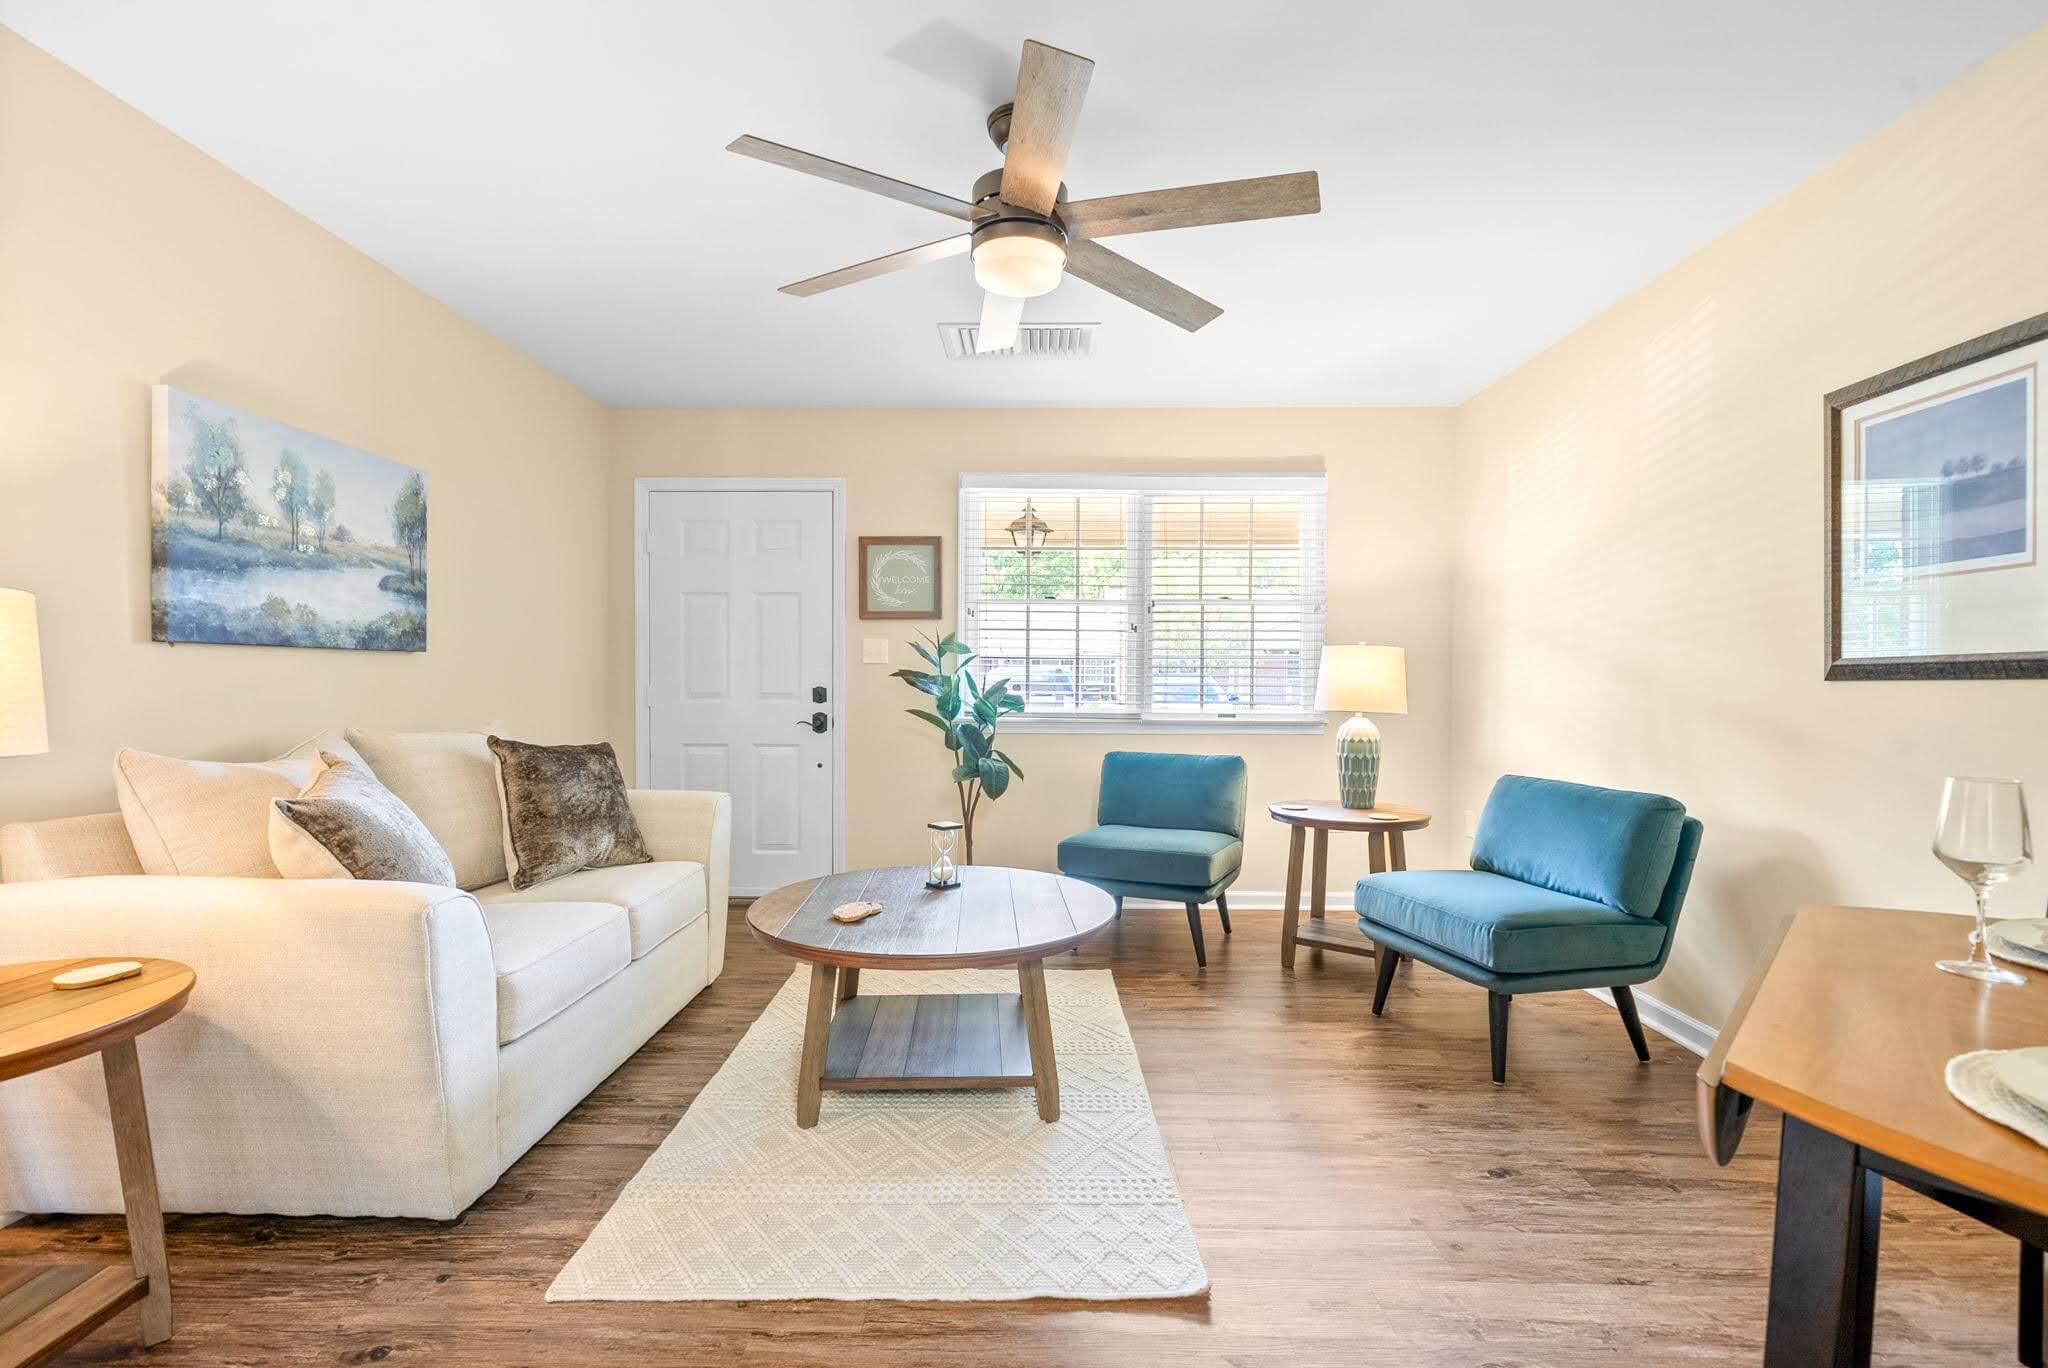
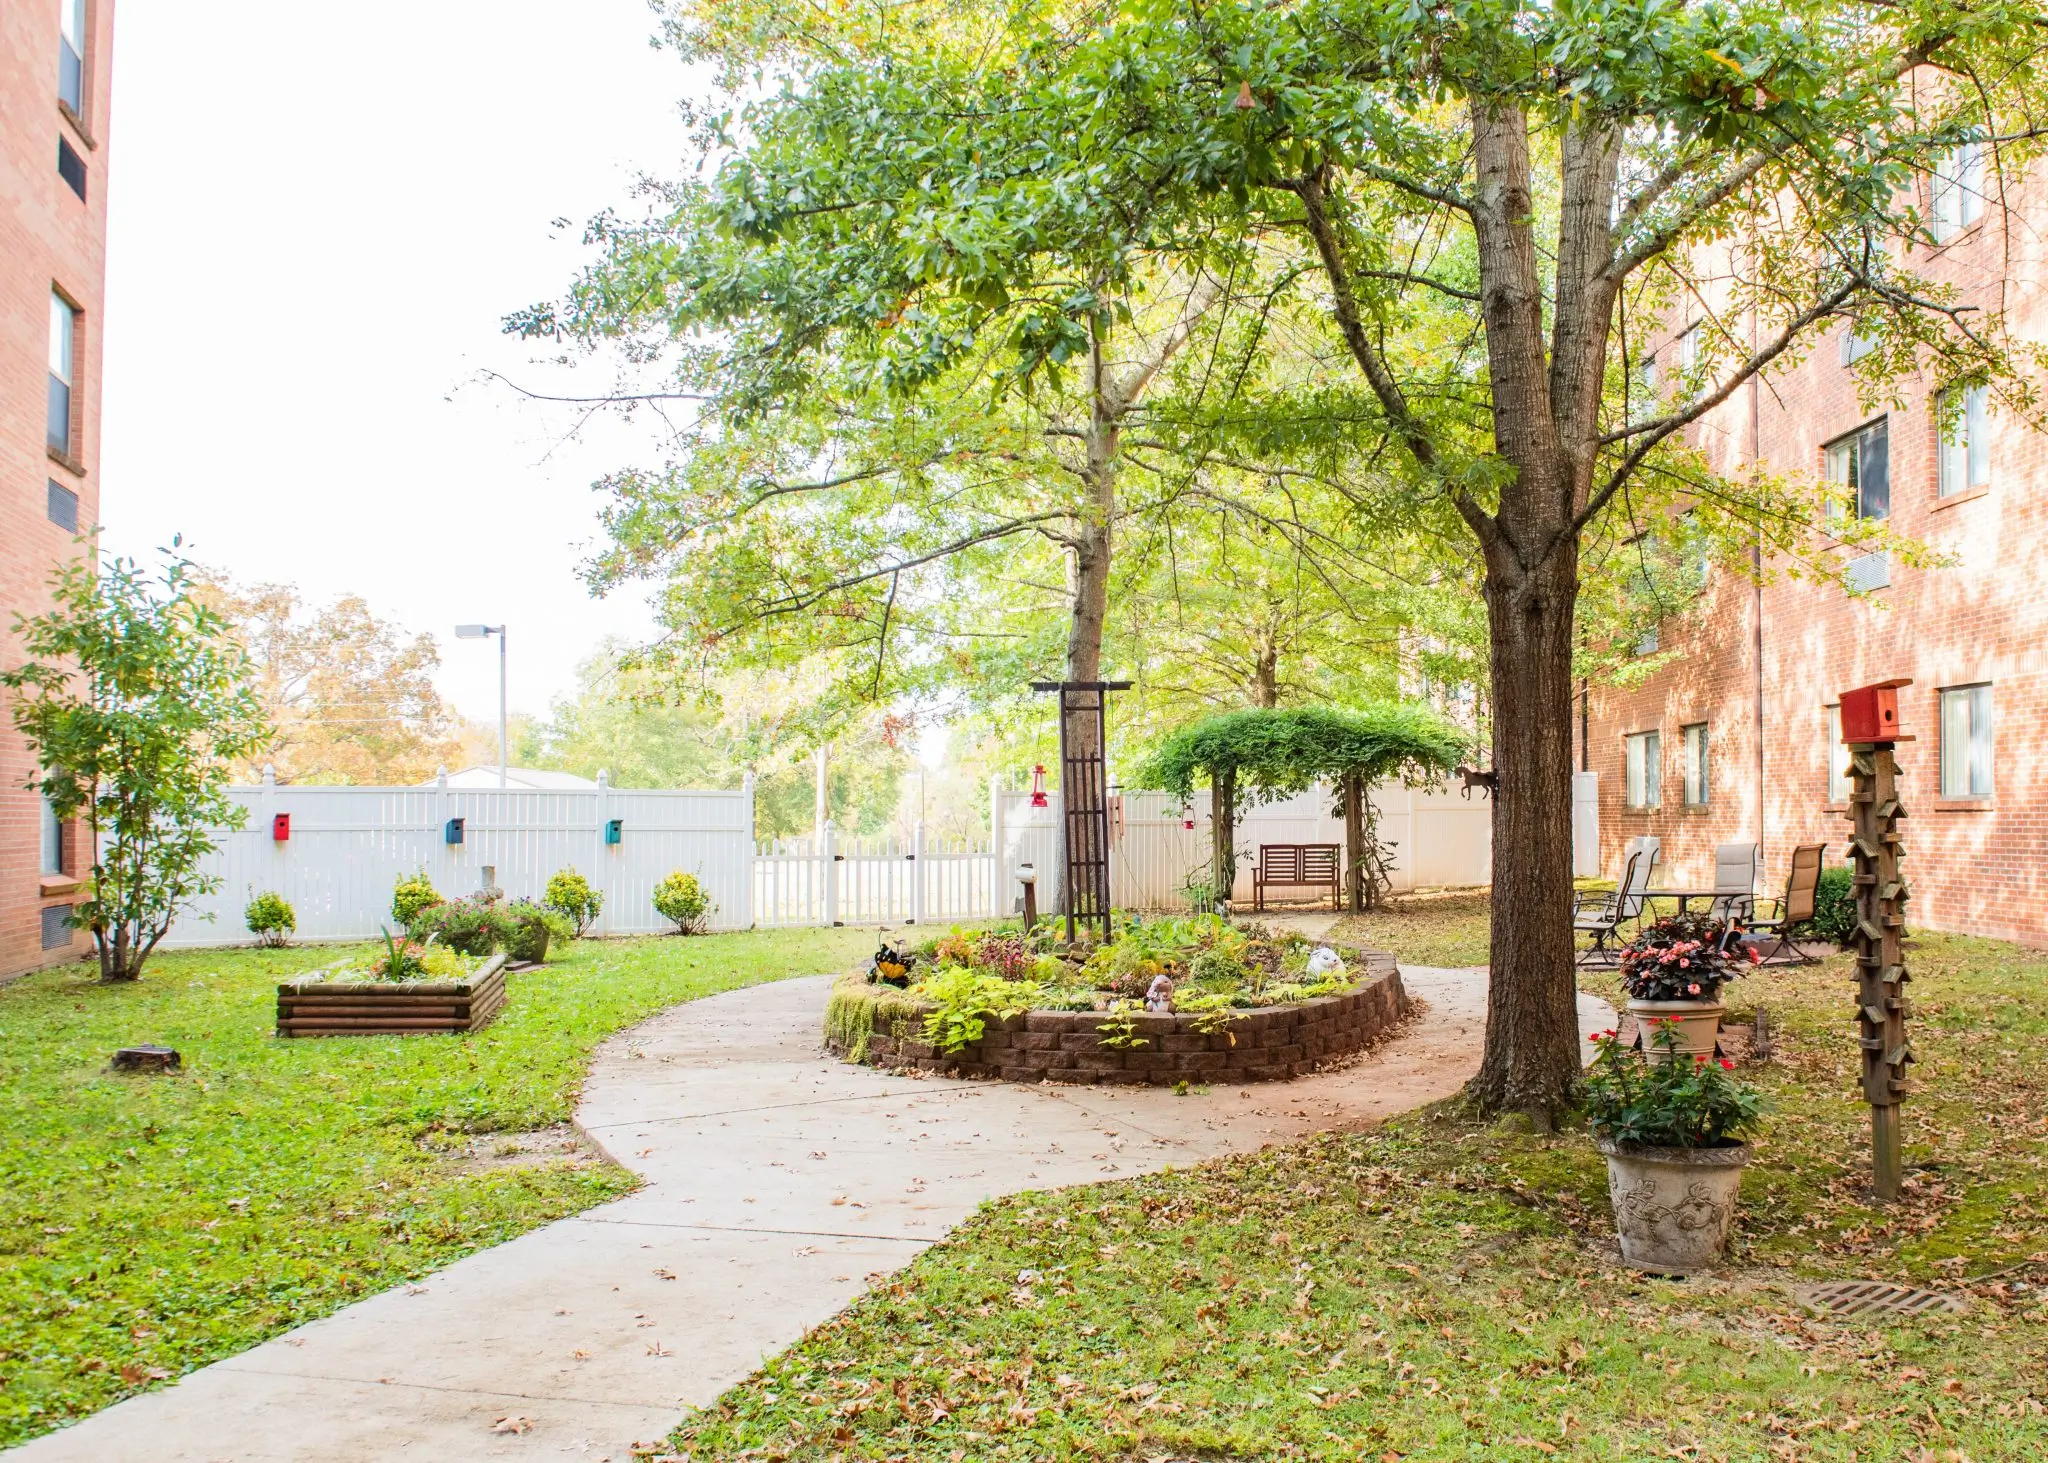
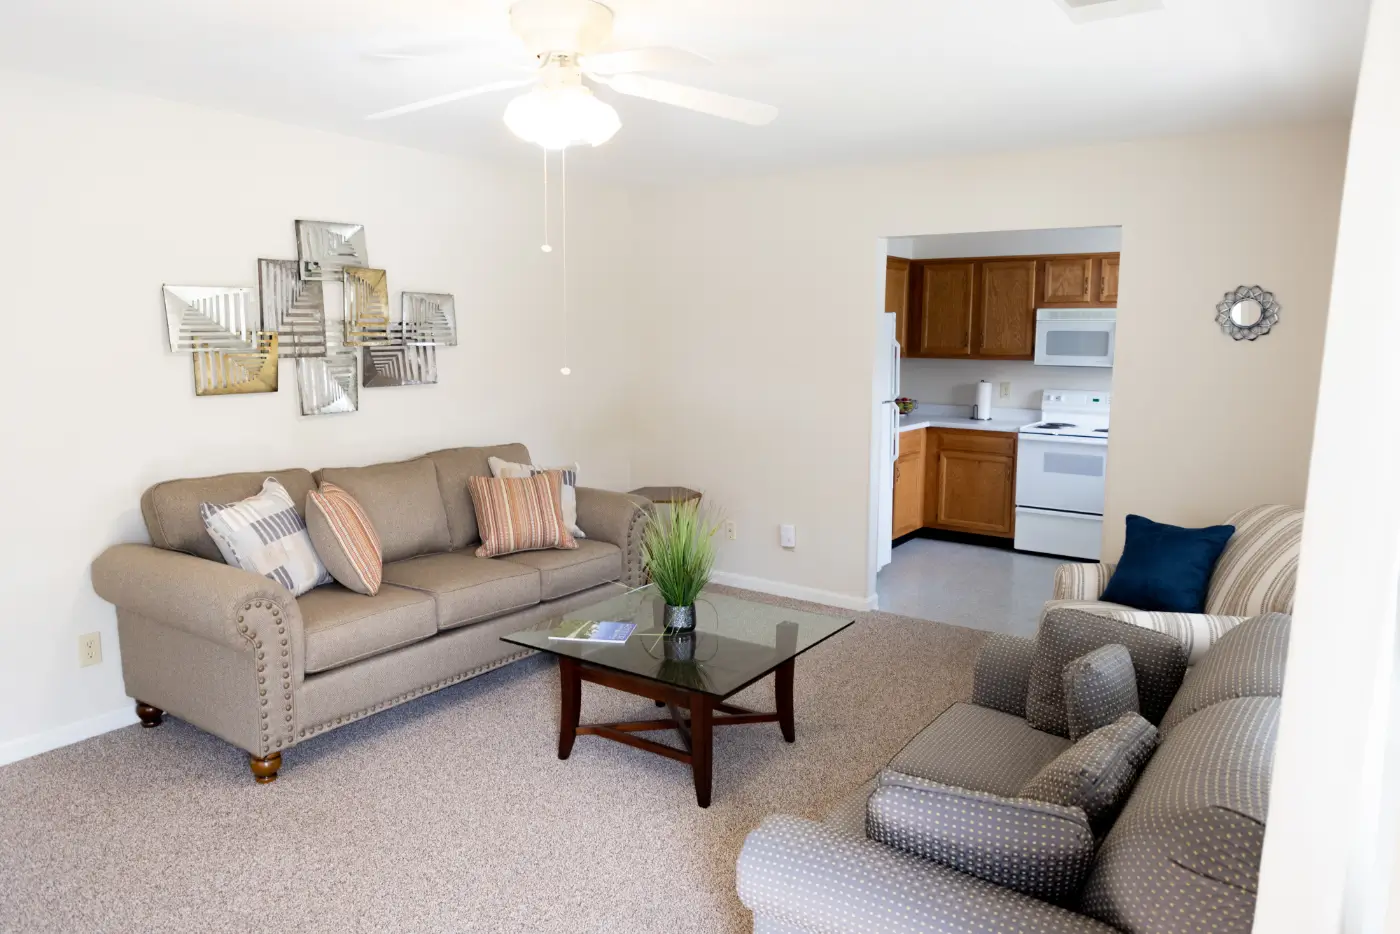
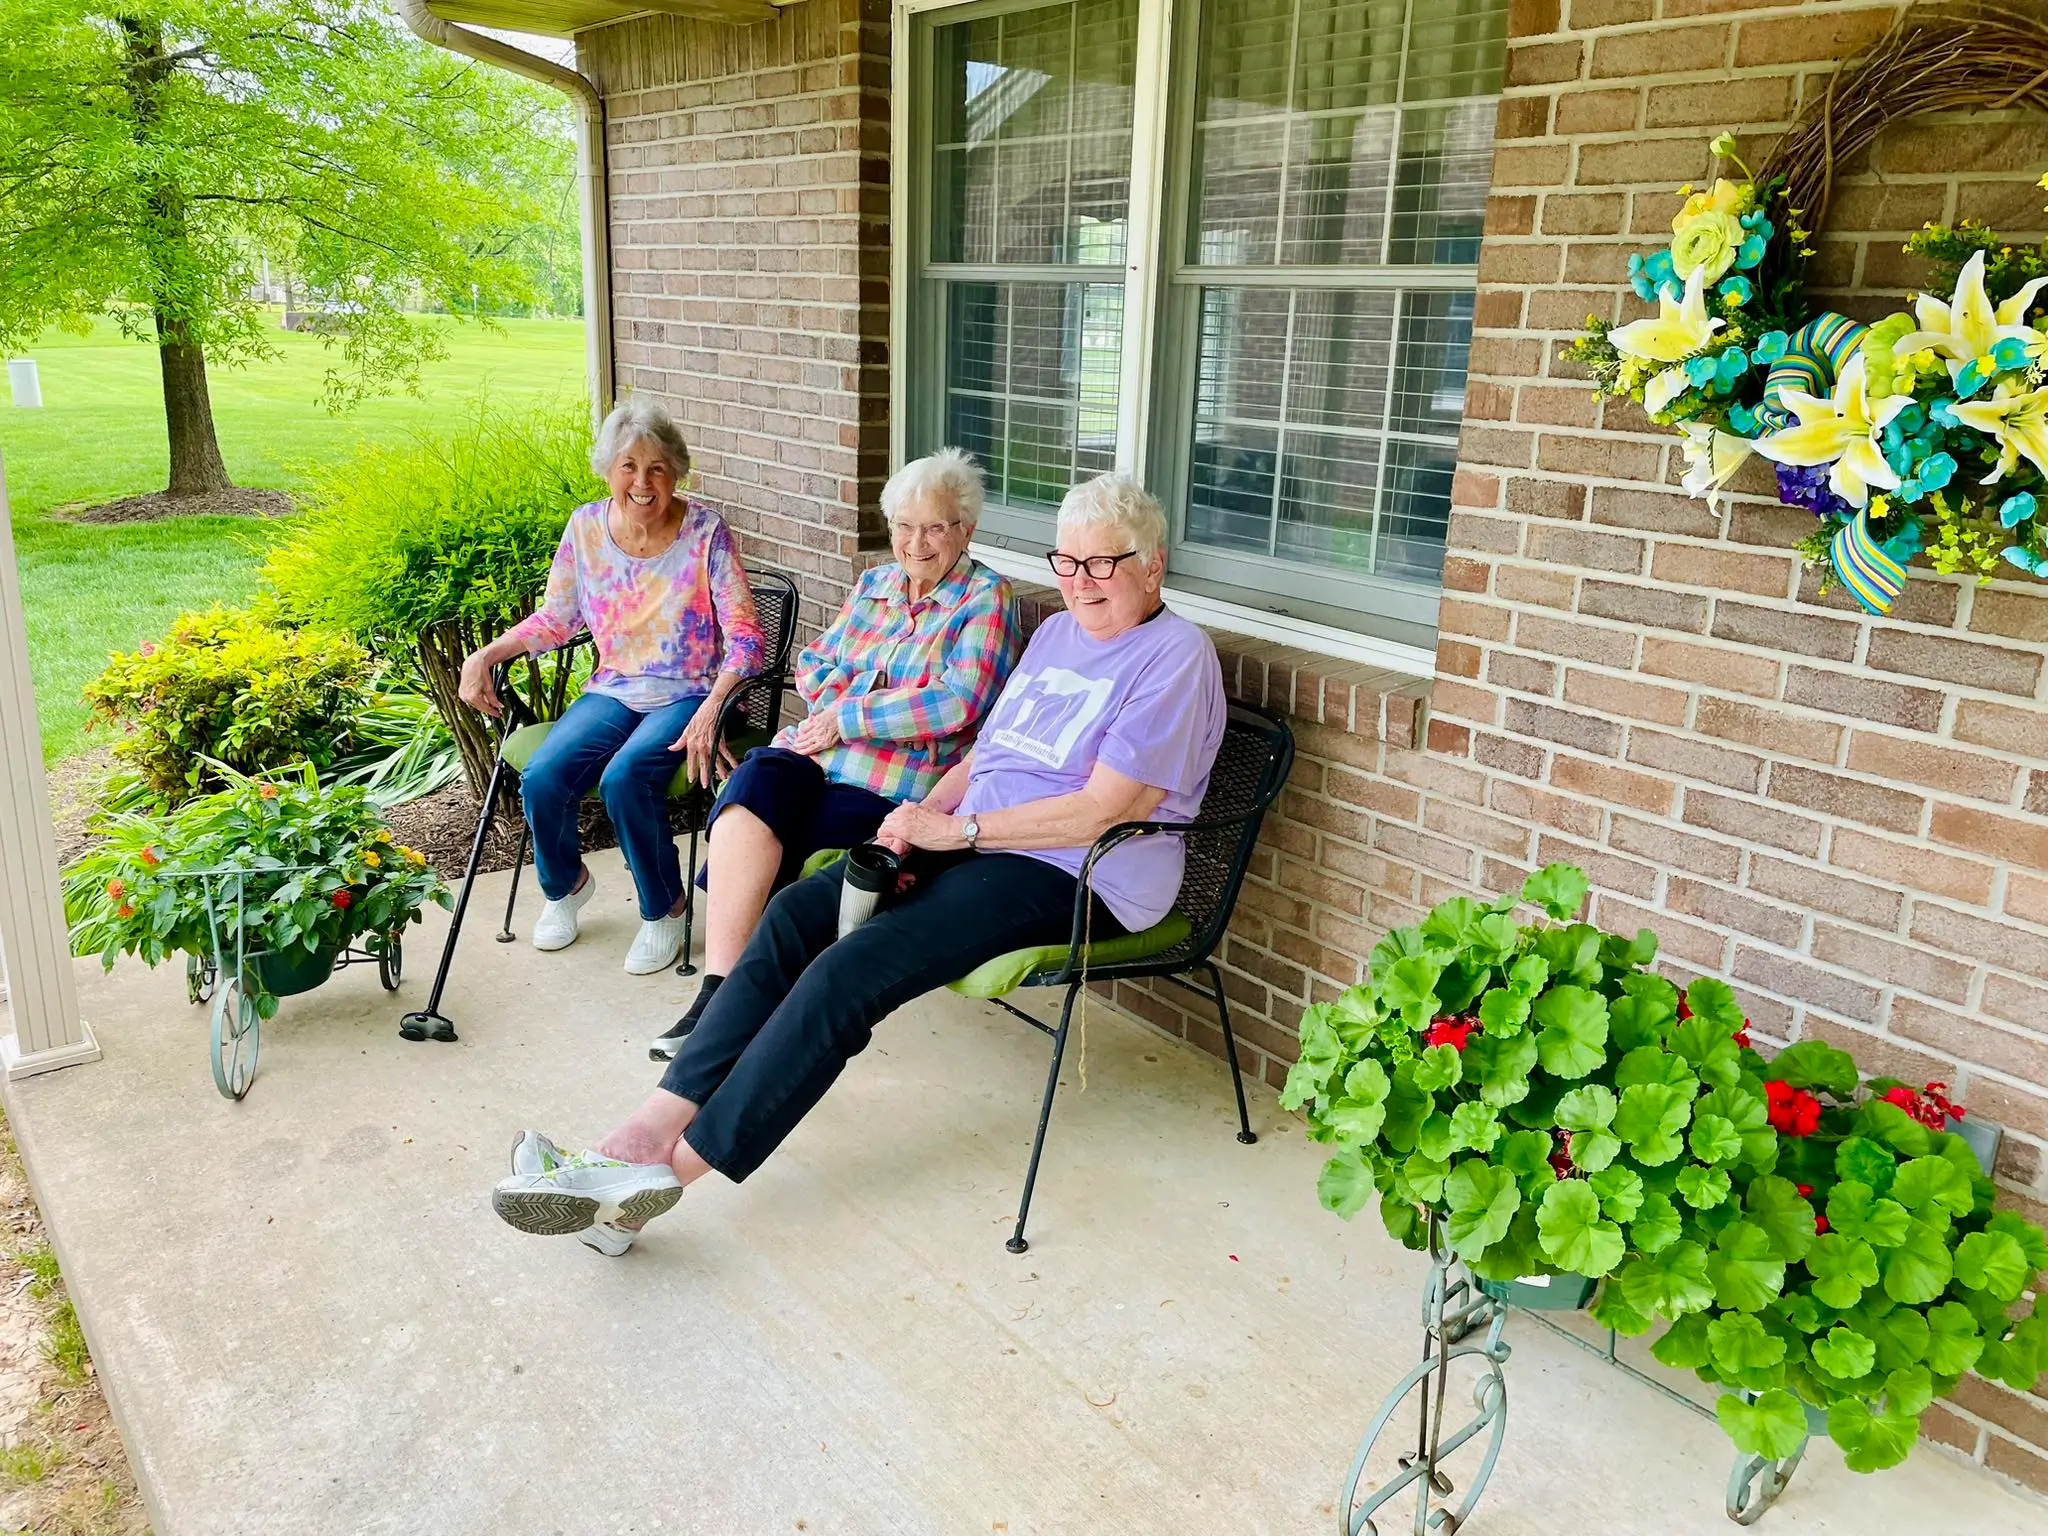
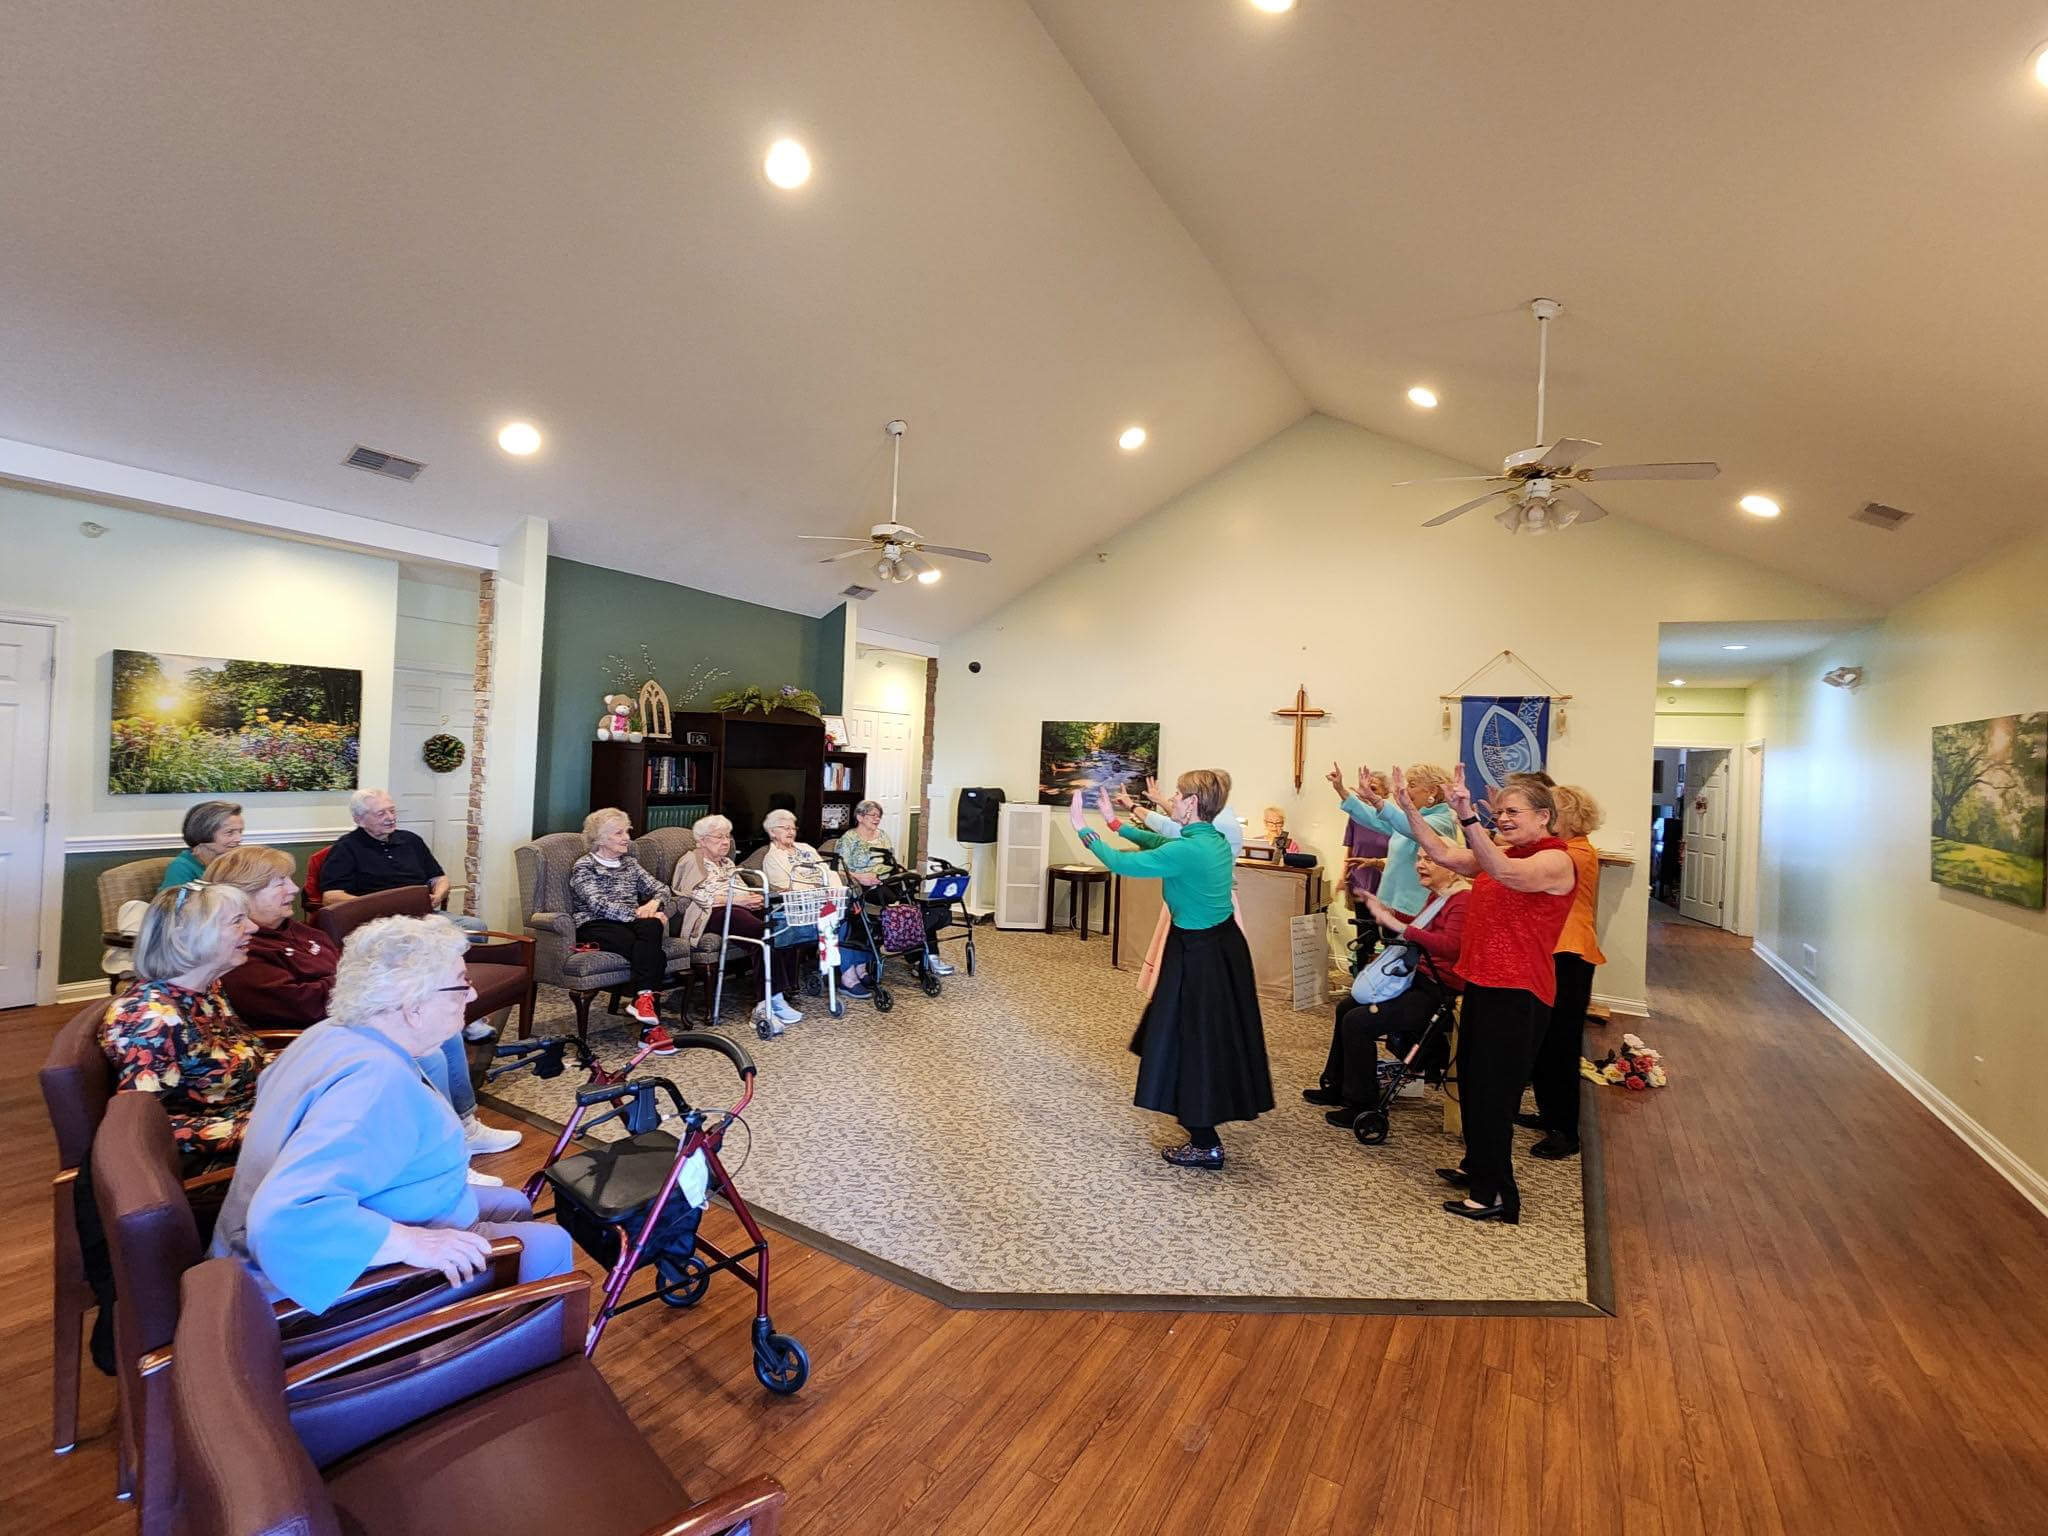
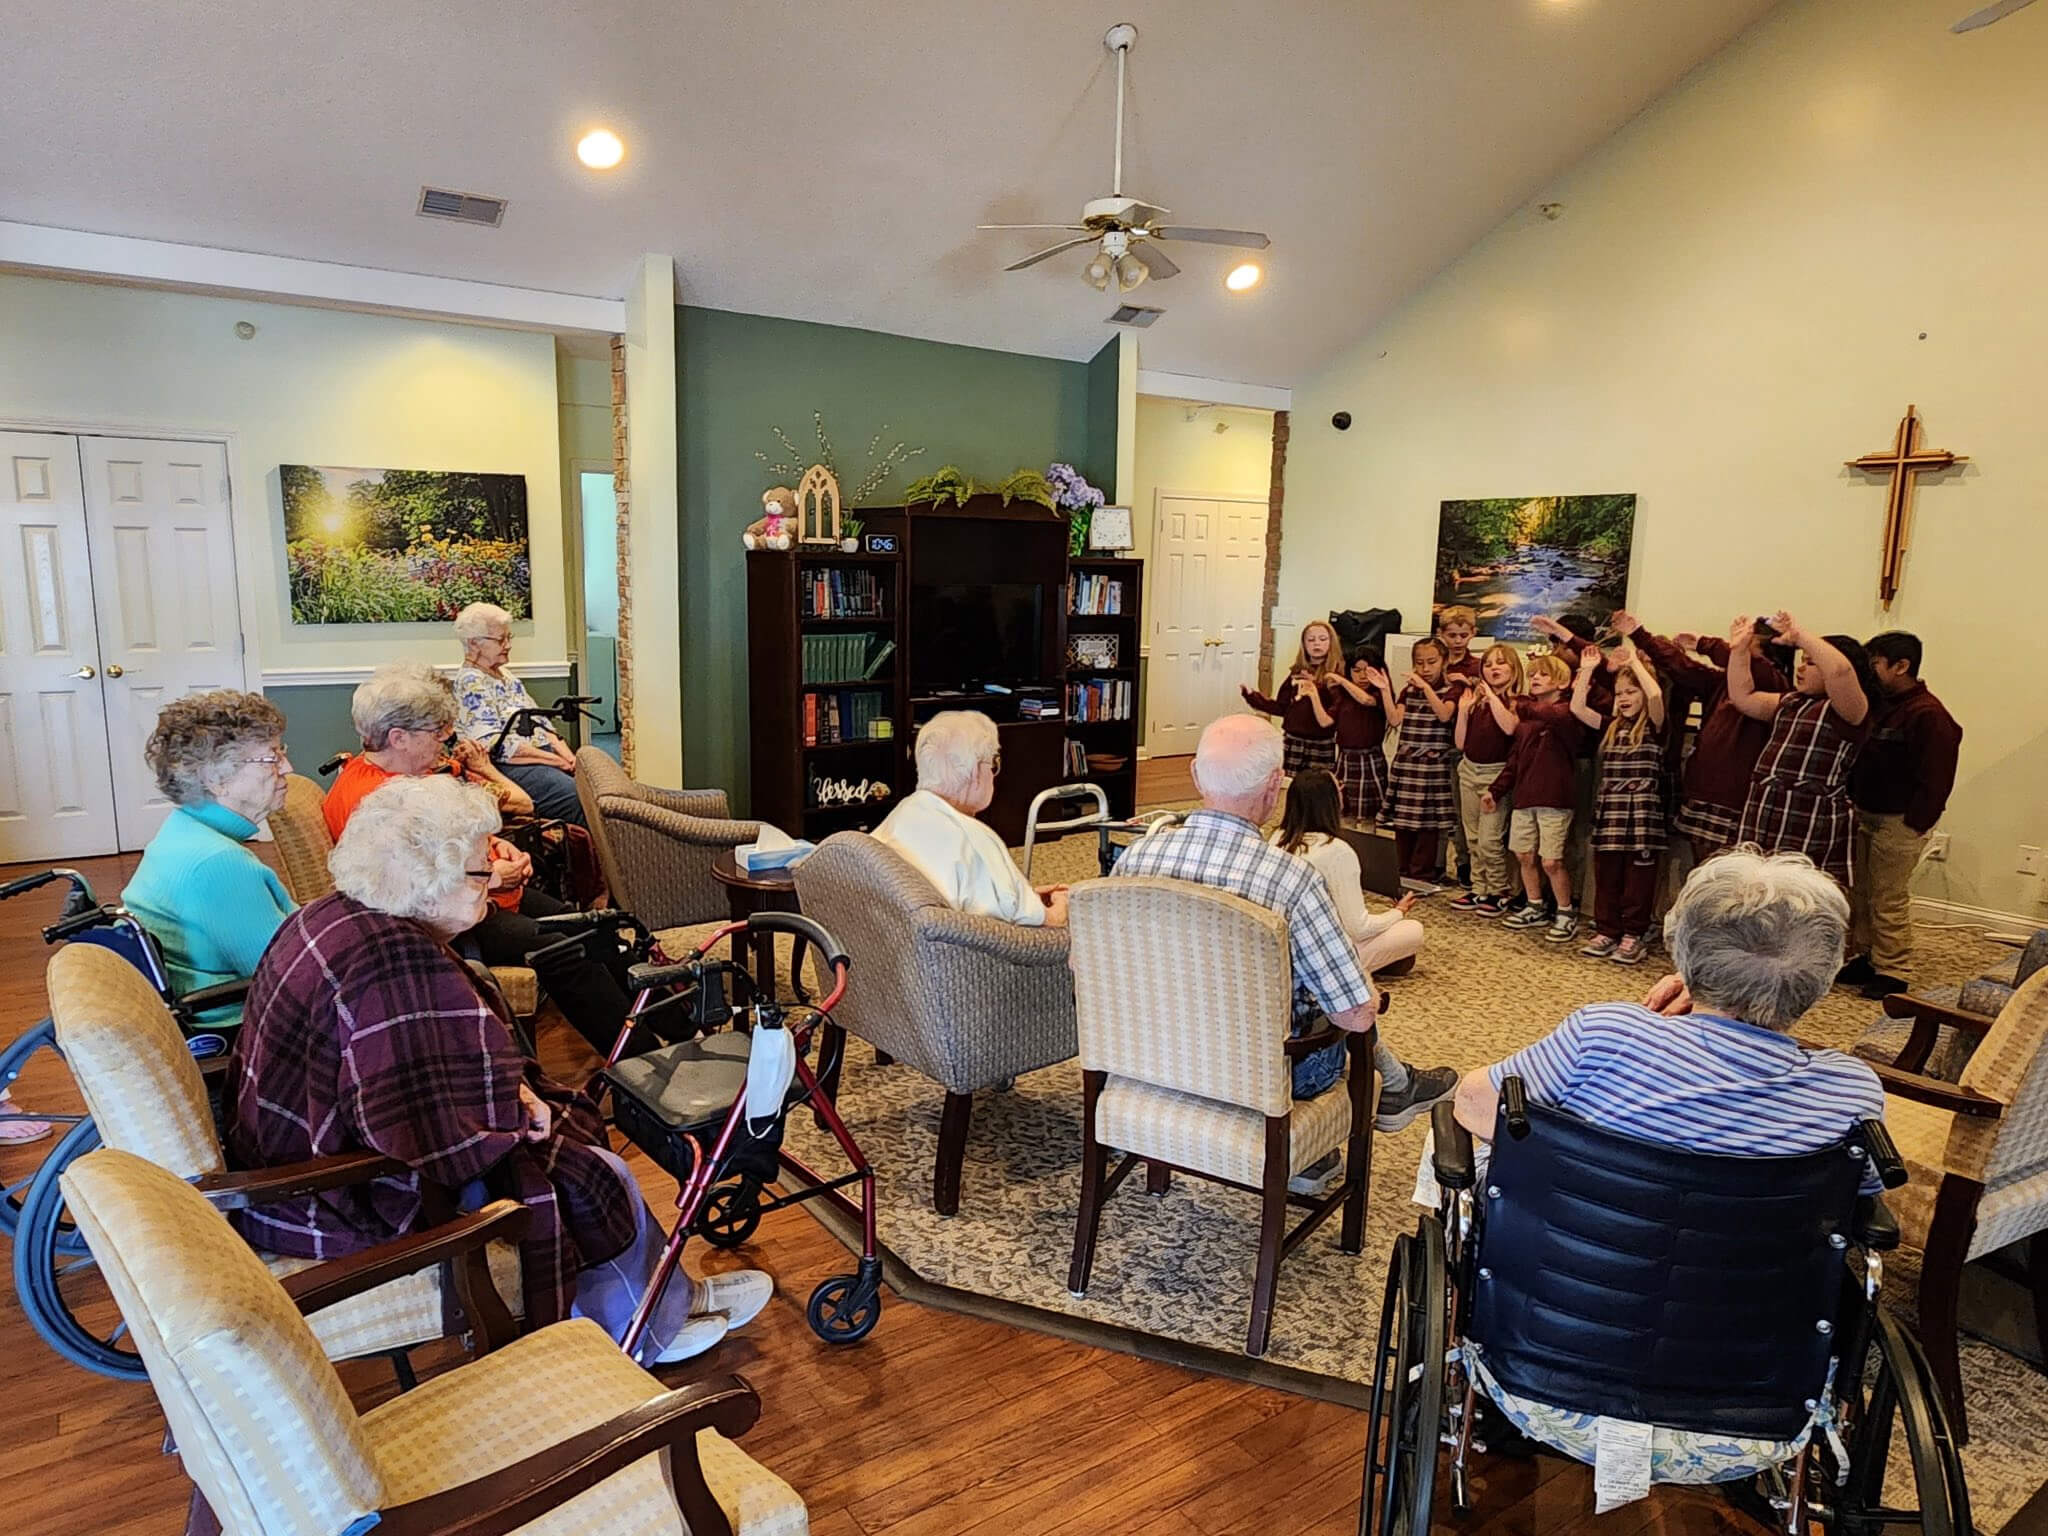
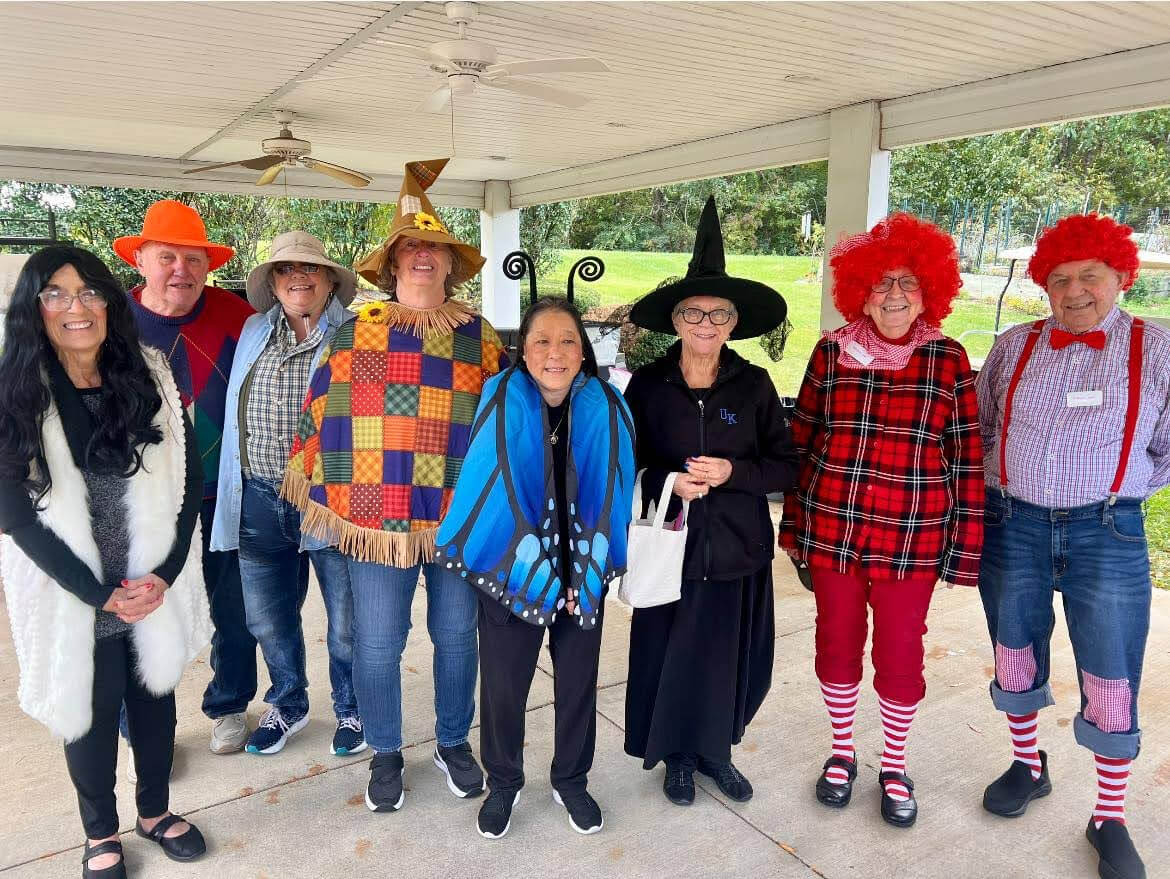
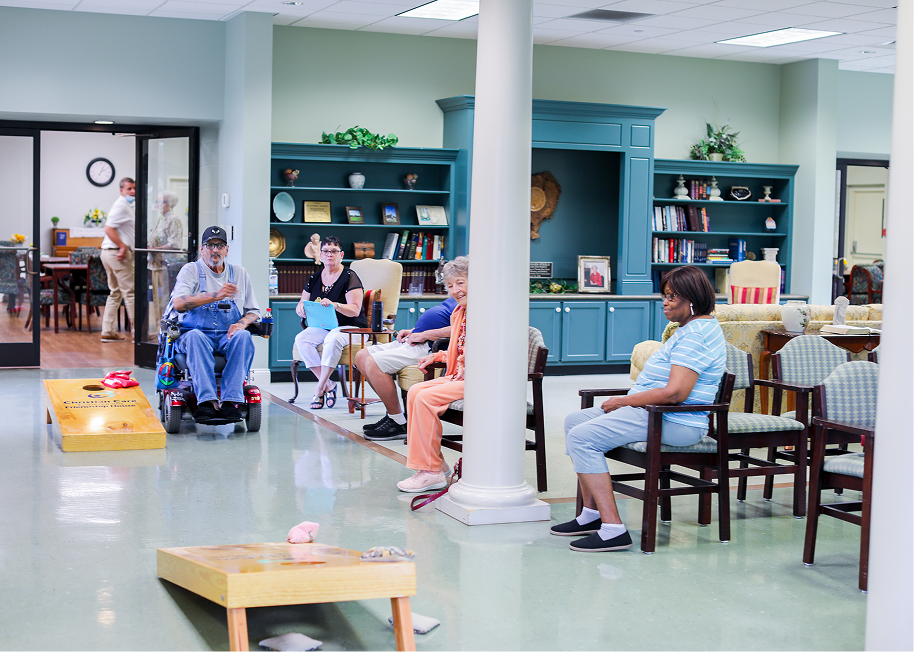
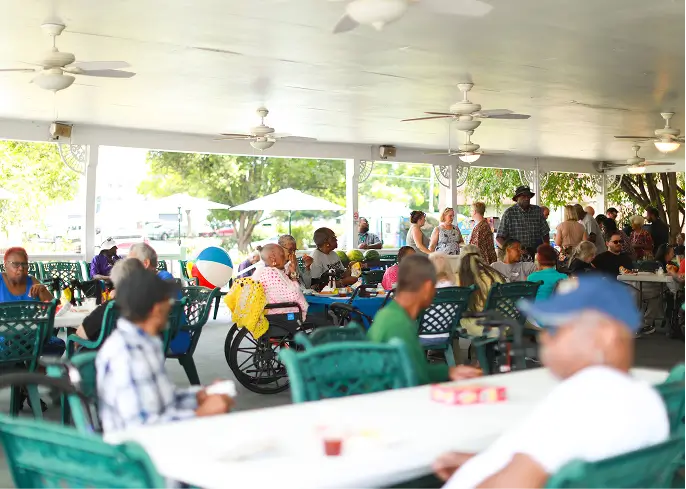
Daily life includes a full calendar of fitness classes, educational programming, and spiritual services, backed by a chapel, salon, walking paths, and an exercise room. That combination points toward a facility built around faith-based community life as much as clinical routine.
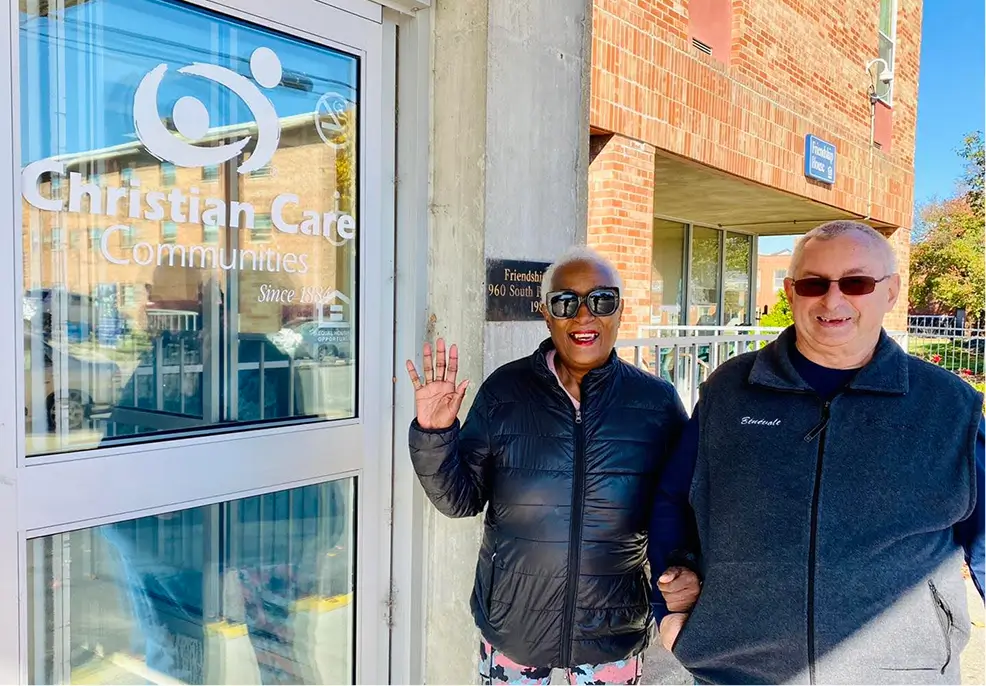
Christian Care Communities, Inc owns the facility. Between the near-full occupancy, the defined short-term rehab program, and the faith-centered daily structure, this reads as an established nursing home suited to residents who want both consistent clinical care and a strong sense of community around them.
| Staff type | Hours / Day / Resident | vs state avg |
|---|---|---|
|
Registered Nurse (RN)
| 30m per day | ▼ 34% State avg: 46m per day · National avg: 41m per day |
|
LPN / LVN
| 1h 11m per day | ▲ 45% State avg: 49m per day · National avg: 52m per day |
|
Nurse Aide
| 3h 33m per day | ▲ 46% State avg: 2h 26m per day · National avg: 2h 20m per day |
|
Weekend Total Nursing
| 4h 51m per day | ▲ 39% State avg: 3h 30m per day · National avg: 3h 26m per day |
|
Physical Therapist
| 6m per day | ▲ 44% State avg: 4m per day · National avg: 4m per day |
|
Weekend RN
| 19m per day | ▼ 39% State avg: 31m per day · National avg: 28m per day |
Reporting period: October 1 – December 31, 2025 (Q4 2025). Source: CMS Payroll-Based Journal report.
Manages medical care and health needs.
Assists with medical care and medications.
Helps with daily care and mobility.
Total hours from contractors
3,589 contractor hours this quarter
| Certified Nursing Assistant | 58 | 4 | 62 | 12,514 | 92 | 100% | 7.4 |
| Licensed Practical Nurse | 8 | 26 | 34 | 3,331 | 92 | 100% | 10 |
| Registered Nurse | 10 | 3 | 13 | 1,426 | 91 | 99% | 9.5 |
| RN Director of Nursing | 2 | 0 | 2 | 1,064 | 68 | 74% | 8.6 |
| Medication Aide/Technician | 2 | 0 | 2 | 726 | 67 | 73% | 10.5 |
| Dietitian | 2 | 0 | 2 | 522 | 64 | 70% | 8 |
| Physical Therapy Aide | 0 | 3 | 3 | 505 | 73 | 79% | 4.1 |
| Qualified Social Worker | 0 | 4 | 4 | 473 | 67 | 73% | 5.6 |
| Speech Language Pathologist | 0 | 2 | 2 | 431 | 73 | 79% | 5.5 |
| Nurse Practitioner | 1 | 0 | 1 | 358 | 56 | 61% | 6.4 |
| Respiratory Therapy Technician | 0 | 2 | 2 | 357 | 61 | 66% | 5.9 |
| Physical Therapy Assistant | 0 | 2 | 2 | 296 | 63 | 68% | 4.6 |
| Administrator | 1 | 0 | 1 | 240 | 54 | 59% | 4.4 |
| Clinical Nurse Specialist | 1 | 0 | 1 | 94 | 9 | 10% | 10.5 |
| Occupational Therapy Aide | 0 | 1 | 1 | 91 | 14 | 15% | 6.5 |
| Occupational Therapy Assistant | 0 | 1 | 1 | 31 | 12 | 13% | 2.6 |
| Medical Director | 0 | 1 | 1 | 30 | 13 | 14% | 2.3 |
Federal penalties imposed by CMS for regulatory violations, including civil money penalties (fines) and denials of payment for new Medicare/Medicaid admissions.
Source: CMS Penalties Database
No penalties in the past 3 years
No civil money penalties or payment denials were reported in the last 3 years.
These measures show how residents usually do over time at this home, based on health outcomes and preventive care.
Kentucky average: 10.5
Kentucky average: 18.9
Kentucky average: 16.8%
Kentucky average: 20.5%
Kentucky average: 3.8%
Kentucky average: 5.8%
Kentucky average: 1.9%
Kentucky average: 6.8%
Kentucky average: 14.3%
Kentucky average: 15.6%
Kentucky average: 93.9%
Kentucky average: 96.2%
Kentucky average: 1.87
Kentucky average: 2.19
Kentucky average: 83.7%
Kentucky average: 1.9%
Kentucky average: 83.6%
Kentucky average: 24.5%
Kentucky average: 13.9%
Kentucky average: 0.8%
Kentucky average: 53.7%
Kentucky average: 50.6%
Quality measures are calculated from Minimum Data Set (MDS) assessments. For most measures, lower percentages indicate better care quality.
48% of new residents, usually for short-term rehab.
28% of new residents, often for short stays.
24% of new residents, often for long-term daily care.
Source: CMS Long-Term Care Facility Characteristics (Data as of Jan 2026)
Residents meet regularly to discuss policies, care quality, and activities
State-approved Nurse Aide Training and Competency Evaluation Program on-site
Part of a Continuing Care Retirement Community offering multiple care levels
Organized group of residents that meets regularly to discuss facility policies, quality of life, and activities.
Data sourced from CMS Long-Term Care Facility Characteristics quarterly report. Payer mix reflects the current resident census by primary payment source.
Historical financial and operational data for Christian Health Center of Bowling Green from 2011–2023, based on CMS SNF Cost Reports.
Key figures below are for fiscal year ending in 12/2023.
Based on CMS SNF Cost Report for fiscal year ending in 12/2023.
No pets allowed
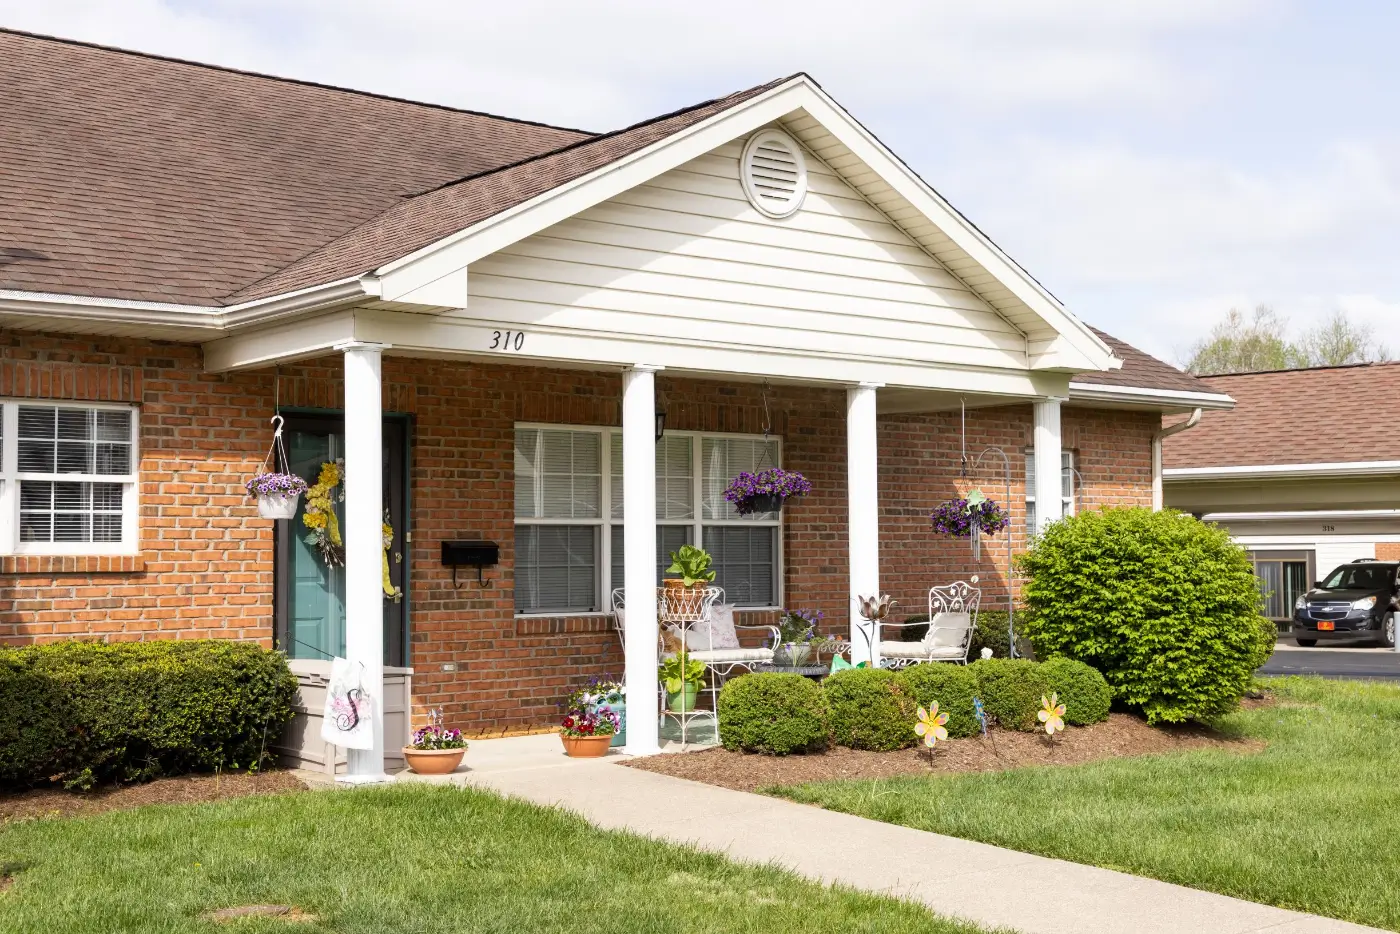
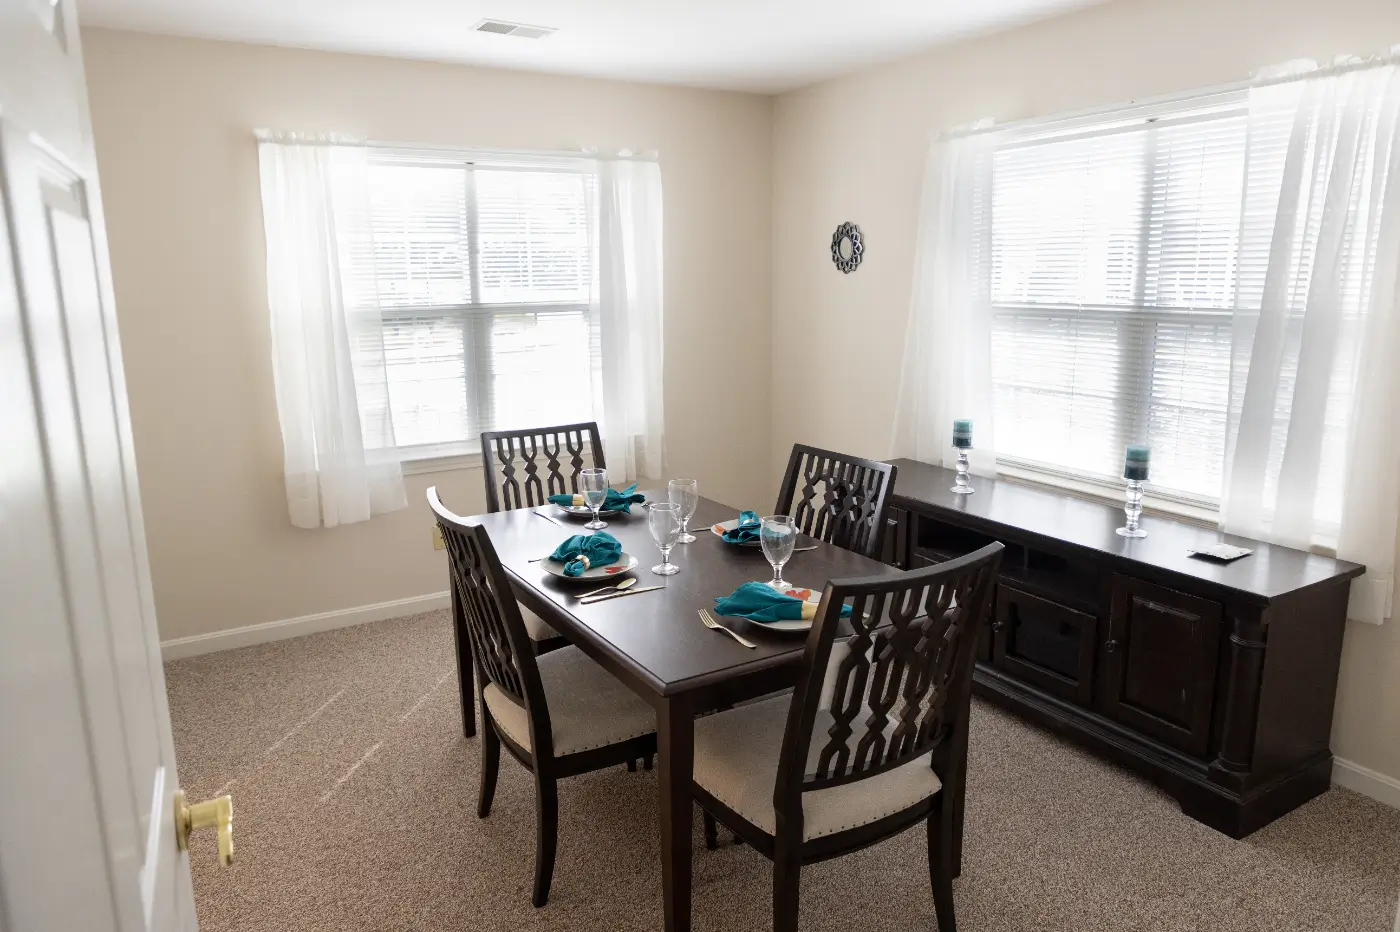
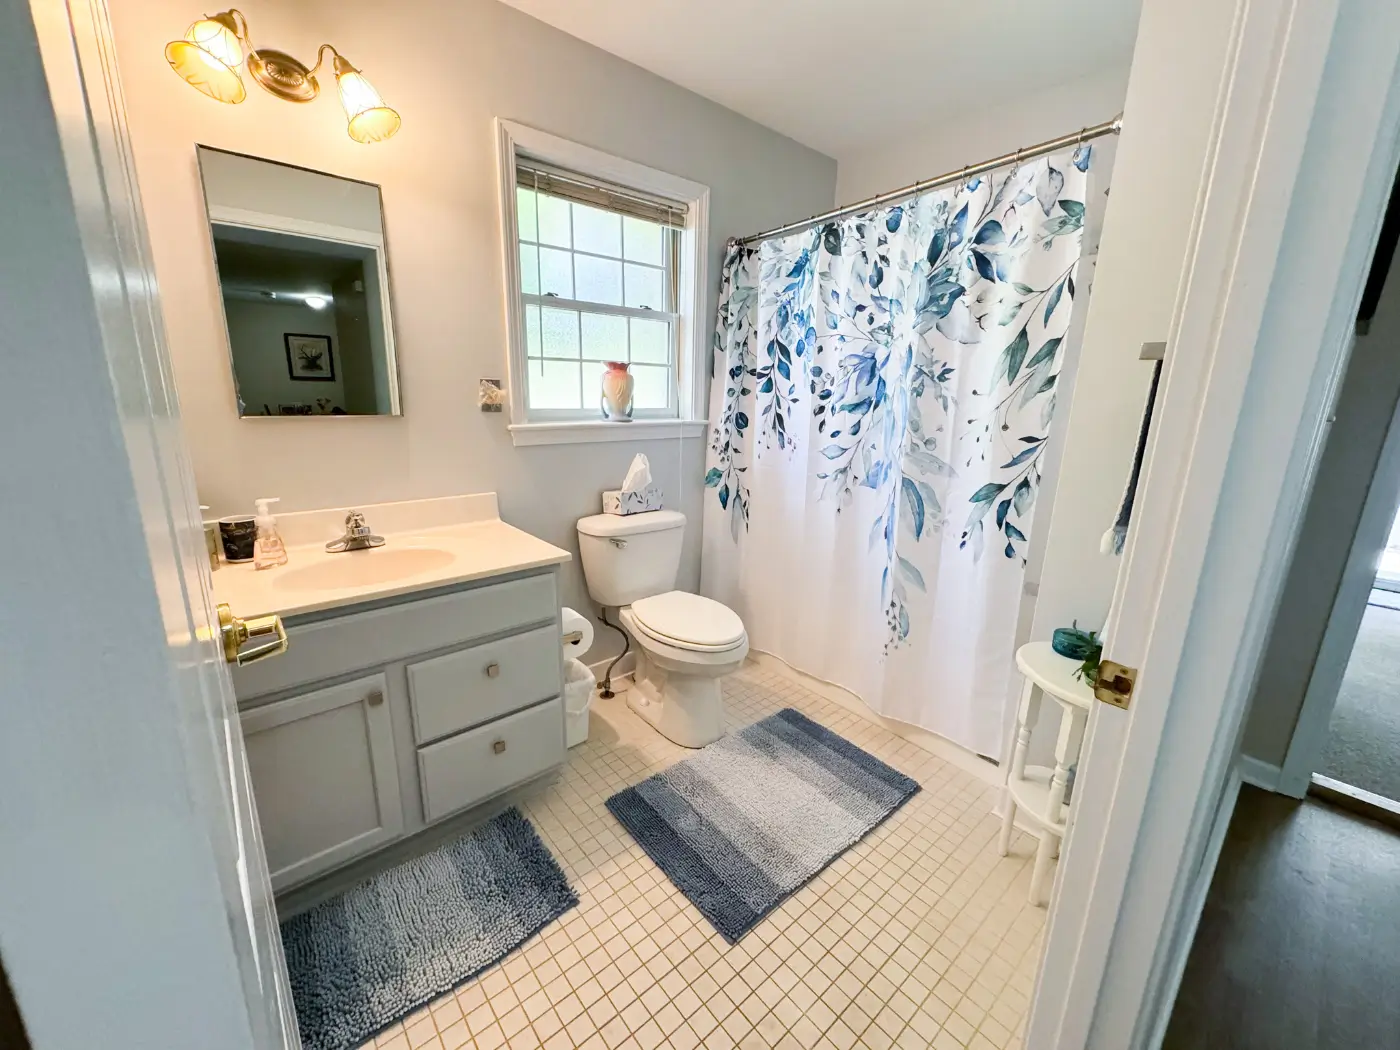
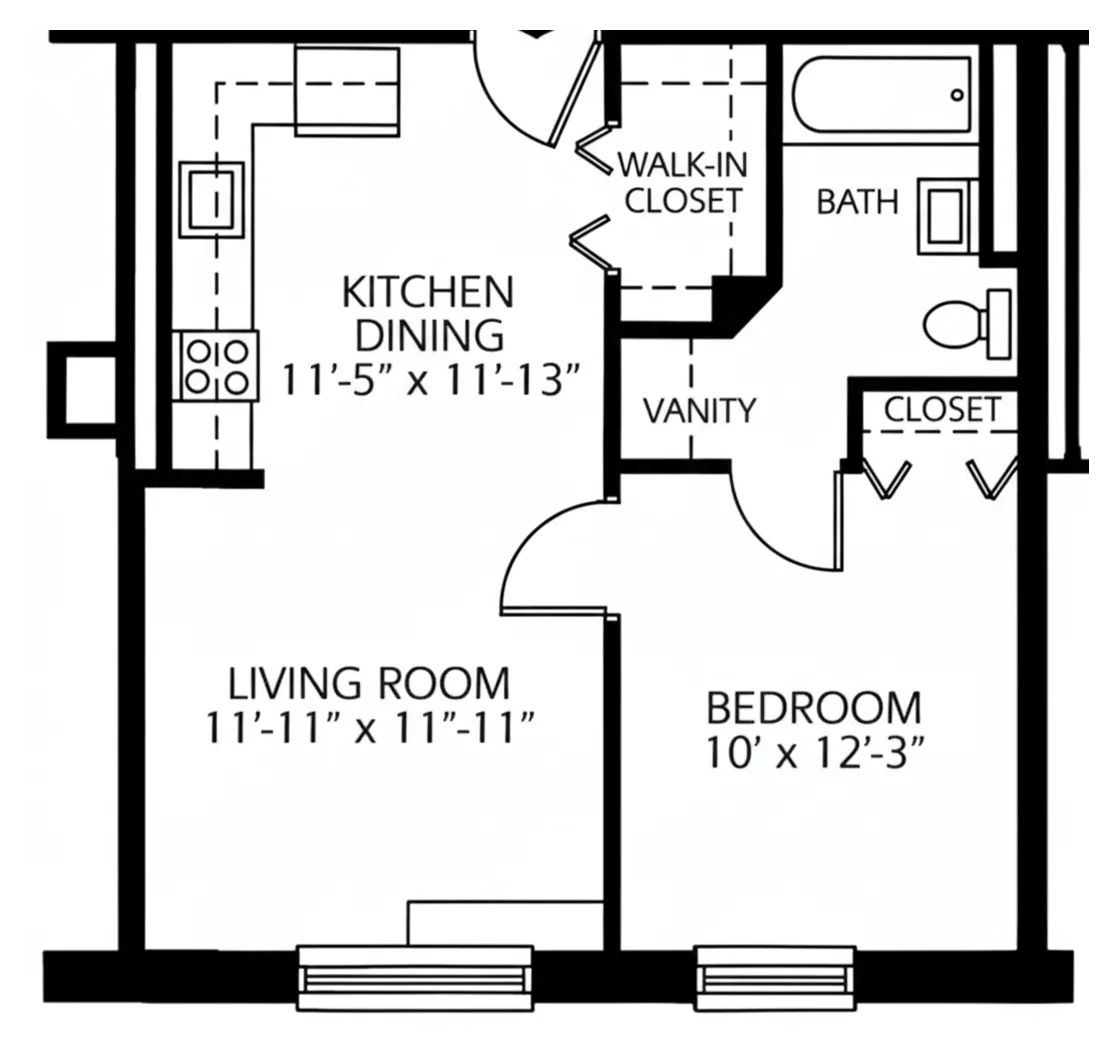
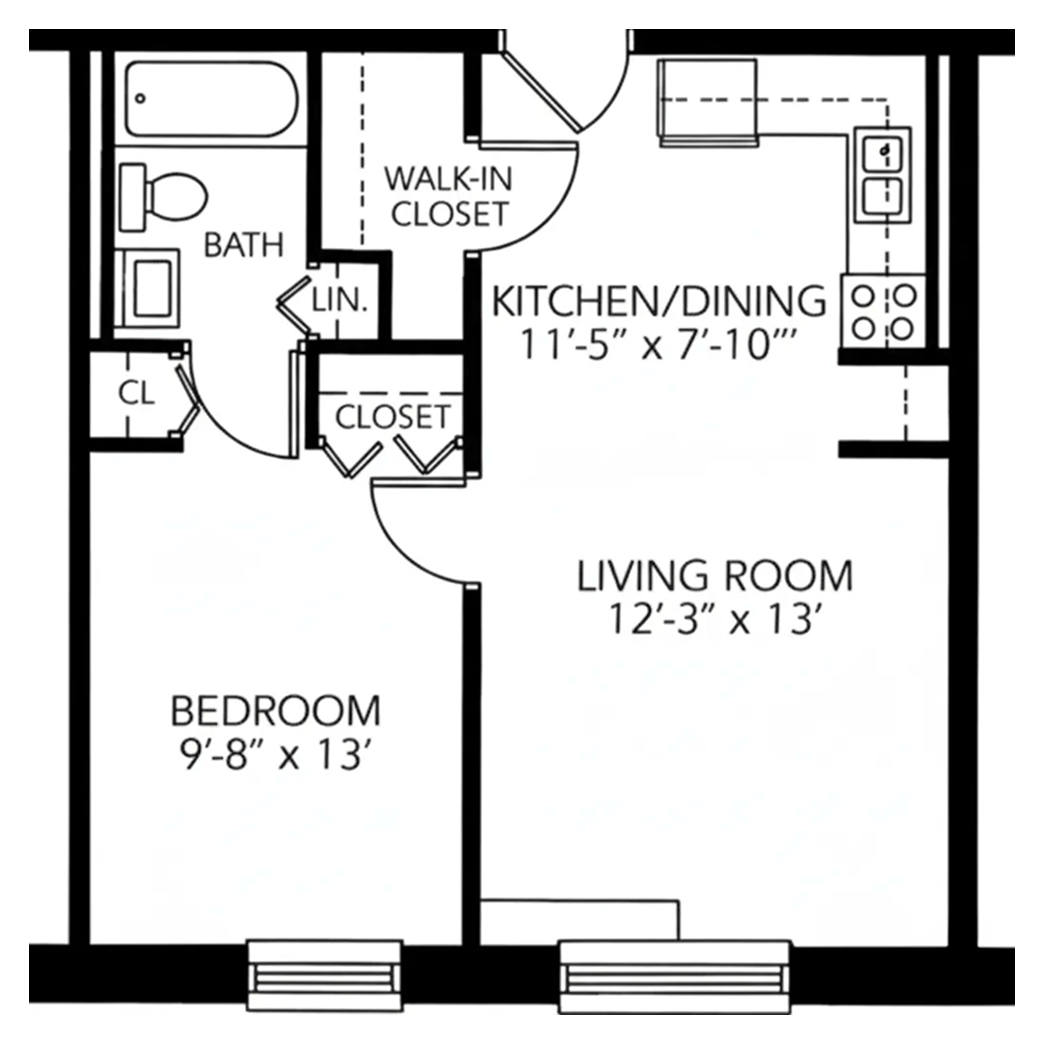
Housing Options: Private Rooms / Semi-Private Rooms
Building Type: Single-story
Transportation Services
Fitness and Recreation
Most residents typically stay for a few weeks or months before returning home or moving on.
New residents most often arrive under Medicare (48% of admissions), and a typical Medicare stay runs around 1 months.
Coverage residents most often arrive under.
Coverage residents most often leave under.

![]() 1.9 miles from city center
1.9 miles from city center
![]() Estimated distance in miles from Bowling Green's city center to Christian Health Center of Bowling Green's address, calculated via Google Maps.
Estimated distance in miles from Bowling Green's city center to Christian Health Center of Bowling Green's address, calculated via Google Maps.
Add your location
Info below is compiled from CMS reports & the KY Cabinet for Health & Family Services (CHFS), senior community websites & trusted data sources such as Walk Score & BBB.
Communities are listed from highest to lowest based on our ranking methodology.
| Magnolia Village | NH SNF | Bowling Green (Eastland Park) | 60
Facility
60
KY AVG
82
Rank
#223 / 341 |
96.7%
Facility
96.7%
KY AVG
84.3
Rank
#15 / 168 | +15% | 2.56
Facility
2.56
KY AVG
3.75
Rank
#176 / 189 | -32% | -32% | $0
Facility
$0
KY AVG
$65.4k
Rank
#1 / 195 | 8
Facility
8
KY AVG
13.5
Rank
#47 / 191 | 4.0
Facility
4.0
KY AVG
4.4
Rank
#89 / 191 | - | 58 | - |
37
Facility
37
KY AVG
41
Rank
#237 / 423 | Magnolia Village Health Center LLC | $6.8MFiscal year ending 12/2023
Facility
$6.8MFiscal year ending 12/2023
KY AVG
$10.5M
Rank
#148 / 192 | $2.8MFiscal year ending 12/2023
Facility
$2.8MFiscal year ending 12/2023
KY AVG
$4.0M
Rank
#130 / 192 | 41.2%Fiscal year ending 12/2023
Facility
41.2%Fiscal year ending 12/2023
KY AVG
40.7%
Rank
#67 / 192 | 185435 | ||||
| Edmonson Center | NH SNF | Brownsville | 74
Facility
74
KY AVG
82
Rank
#181 / 341 |
97.3%
Facility
97.3%
KY AVG
84.3
Rank
#13 / 168 | +15% | 3.47
Facility
3.47
KY AVG
3.75
Rank
#66 / 189 | -41% | -8% | $0
Facility
$0
KY AVG
$65.4k
Rank
#1 / 195 | 11
Facility
11
KY AVG
13.5
Rank
#87 / 191 | 5.5
Facility
5.5
KY AVG
4.4
Rank
#142 / 191 | 3 | 72 | - |
43
Facility
43
KY AVG
41
Rank
#206 / 423 | Edmonson Health Center LLC | $8.4MFiscal year ending 12/2023
Facility
$8.4MFiscal year ending 12/2023
KY AVG
$10.5M
Rank
#97 / 192 | $3.5MFiscal year ending 12/2023
Facility
$3.5MFiscal year ending 12/2023
KY AVG
$4.0M
Rank
#90 / 192 | 42%Fiscal year ending 12/2023
Facility
42%Fiscal year ending 12/2023
KY AVG
40.7%
Rank
#96 / 192 | 185401 | ||||
| Hopkins Center | NH SNF | Woodburn | 50
Facility
50
KY AVG
82
Rank
#258 / 341 |
84.6%
Facility
84.6%
KY AVG
84.3
Rank
#108 / 168 | 0% | 2.67
Facility
2.67
KY AVG
3.75
Rank
#173 / 189 | -33% | -29% | $0
Facility
$0
KY AVG
$65.4k
Rank
#1 / 195 | 8
Facility
8
KY AVG
13.5
Rank
#47 / 191 | 2.7
Facility
2.7
KY AVG
4.4
Rank
#36 / 191 | - | 42 | - |
7
Facility
7
KY AVG
41
Rank
#382 / 423 | - | $5.4M*Fiscal year ending 10/2022These figures are from this home's most recent complete cost report — an older period than most facilities report. Compare with that in mind.
Facility
$5.4M*Fiscal year ending 10/2022These figures are from this home's most recent complete cost report — an older period than most facilities report. Compare with that in mind.
KY AVG
$10.5M
Rank
#172 / 192 | $2.6M*Fiscal year ending 10/2022These figures are from this home's most recent complete cost report — an older period than most facilities report. Compare with that in mind.
Facility
$2.6M*Fiscal year ending 10/2022These figures are from this home's most recent complete cost report — an older period than most facilities report. Compare with that in mind.
KY AVG
$4.0M
Rank
#154 / 192 | 47.7%*Fiscal year ending 10/2022These figures are from this home's most recent complete cost report — an older period than most facilities report. Compare with that in mind.
Facility
47.7%*Fiscal year ending 10/2022These figures are from this home's most recent complete cost report — an older period than most facilities report. Compare with that in mind.
KY AVG
40.7%
Rank
#39 / 192 | 185167 | ||||
| Signature Healthcare of Bowling Green | NH HOS MC PC RC SNF | Bowling Green | 176
Facility
176
KY AVG
82
Rank
#11 / 341 |
79.1%
Facility
79.1%
KY AVG
84.3
Rank
#133 / 168 | -6% | 3.27
Facility
3.27
KY AVG
3.75
Rank
#91 / 189 | -34% | -13% | $0
Facility
$0
KY AVG
$65.4k
Rank
#1 / 195 | 13
Facility
13
KY AVG
13.5
Rank
#103 / 191 | 4.3
Facility
4.3
KY AVG
4.4
Rank
#101 / 191 | - | 139 | - |
64
Facility
64
KY AVG
41
Rank
#79 / 423 | Shc Ky Holdings LLC | $15.3MFiscal year ending 12/2023
Facility
$15.3MFiscal year ending 12/2023
KY AVG
$10.5M
Rank
#21 / 192 | $5.2MFiscal year ending 12/2023
Facility
$5.2MFiscal year ending 12/2023
KY AVG
$4.0M
Rank
#48 / 192 | 34%Fiscal year ending 12/2023
Facility
34%Fiscal year ending 12/2023
KY AVG
40.7%
Rank
#153 / 192 | 185089 | ||||
| Christian Health Center of Bowling Green | NH AL IL MC SNF | Bowling Green | 45
Facility
45
KY AVG
82
Rank
#269 / 341 |
89.8%
Facility
89.8%
KY AVG
84.3
Rank
#77 / 168 | +7% | 4.61
Facility
4.61
KY AVG
3.75
Rank
#16 / 189 | -10% | +23% | $0
Facility
$0
KY AVG
$65.4k
Rank
#1 / 195 | 2
Facility
2
KY AVG
13.5
Rank
#3 / 191 | 1.0
Facility
1.0
KY AVG
4.4
Rank
#1 / 191 | - | 40 | - |
28
Facility
28
KY AVG
41
Rank
#292 / 423 | Christian Care Communities, Inc | $6.3MFiscal year ending 12/2023
Facility
$6.3MFiscal year ending 12/2023
KY AVG
$10.5M
Rank
#123 / 192 | $2.6MFiscal year ending 12/2023
Facility
$2.6MFiscal year ending 12/2023
KY AVG
$4.0M
Rank
#158 / 192 | 40.6%Fiscal year ending 12/2023
Facility
40.6%Fiscal year ending 12/2023
KY AVG
40.7%
Rank
#166 / 192 | 185419 |
Christian Health Center of Bowling Green is located in Bowling Green, Kentucky.
Here are the financial assistance programs available to residents in Kentucky.
Christian Health Center of Bowling Green has a walk score of 28. Somewhat walkable. A few nearby services may be reachable on foot, but most trips require transportation.
Christian Health Center of Bowling Green's occupancy is 93.6%.
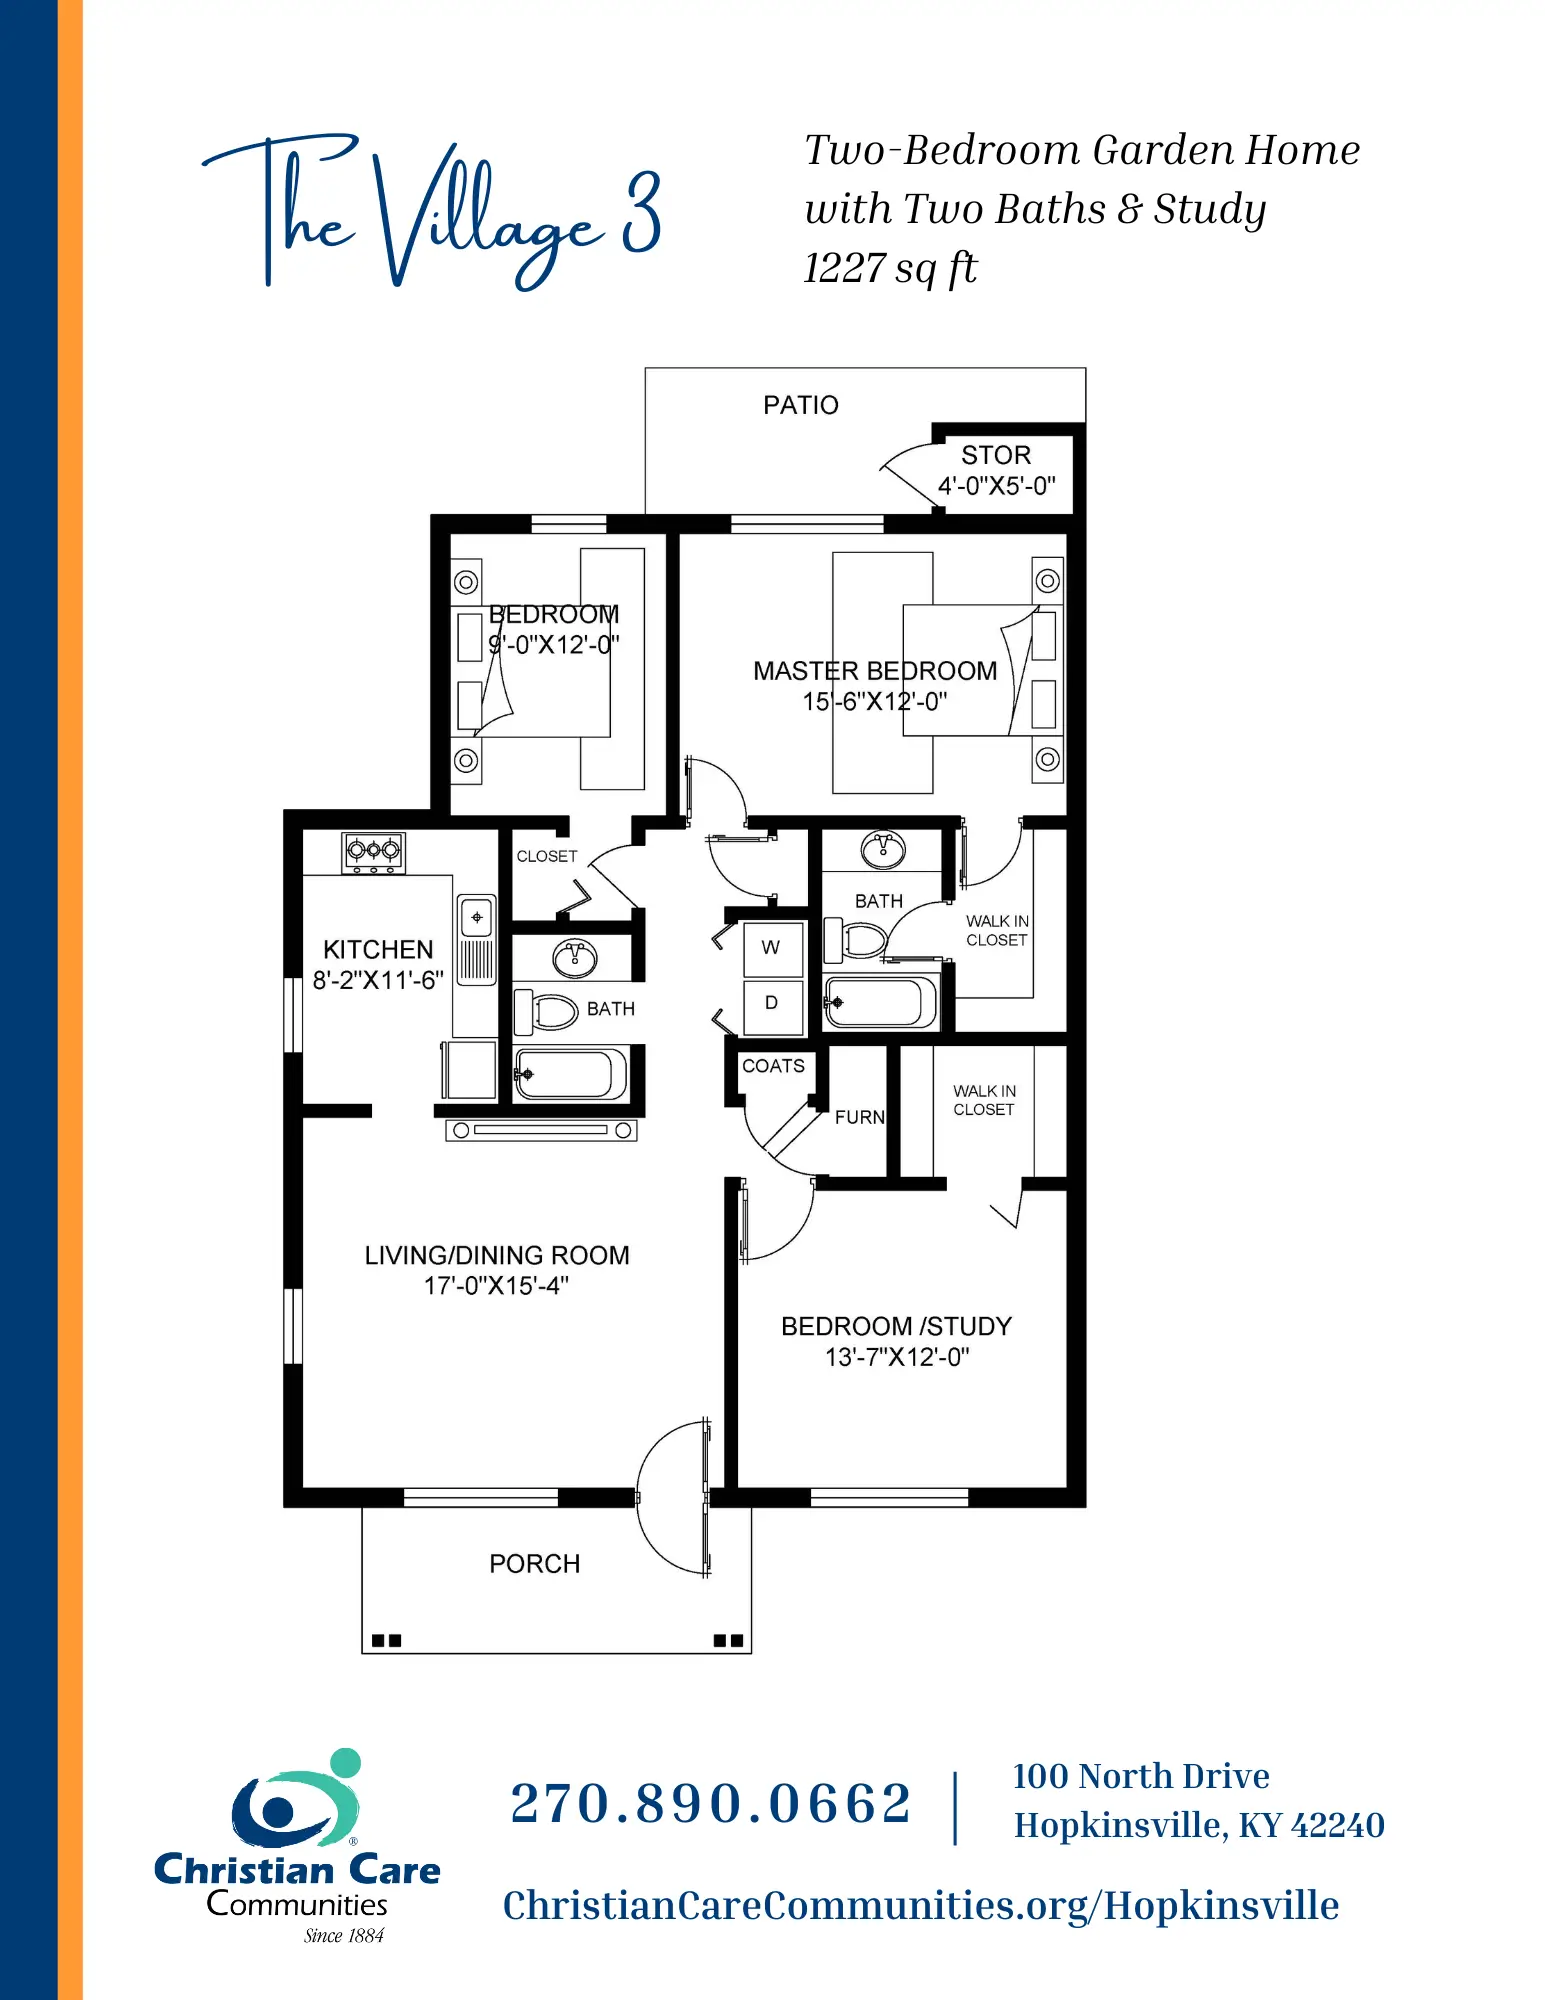
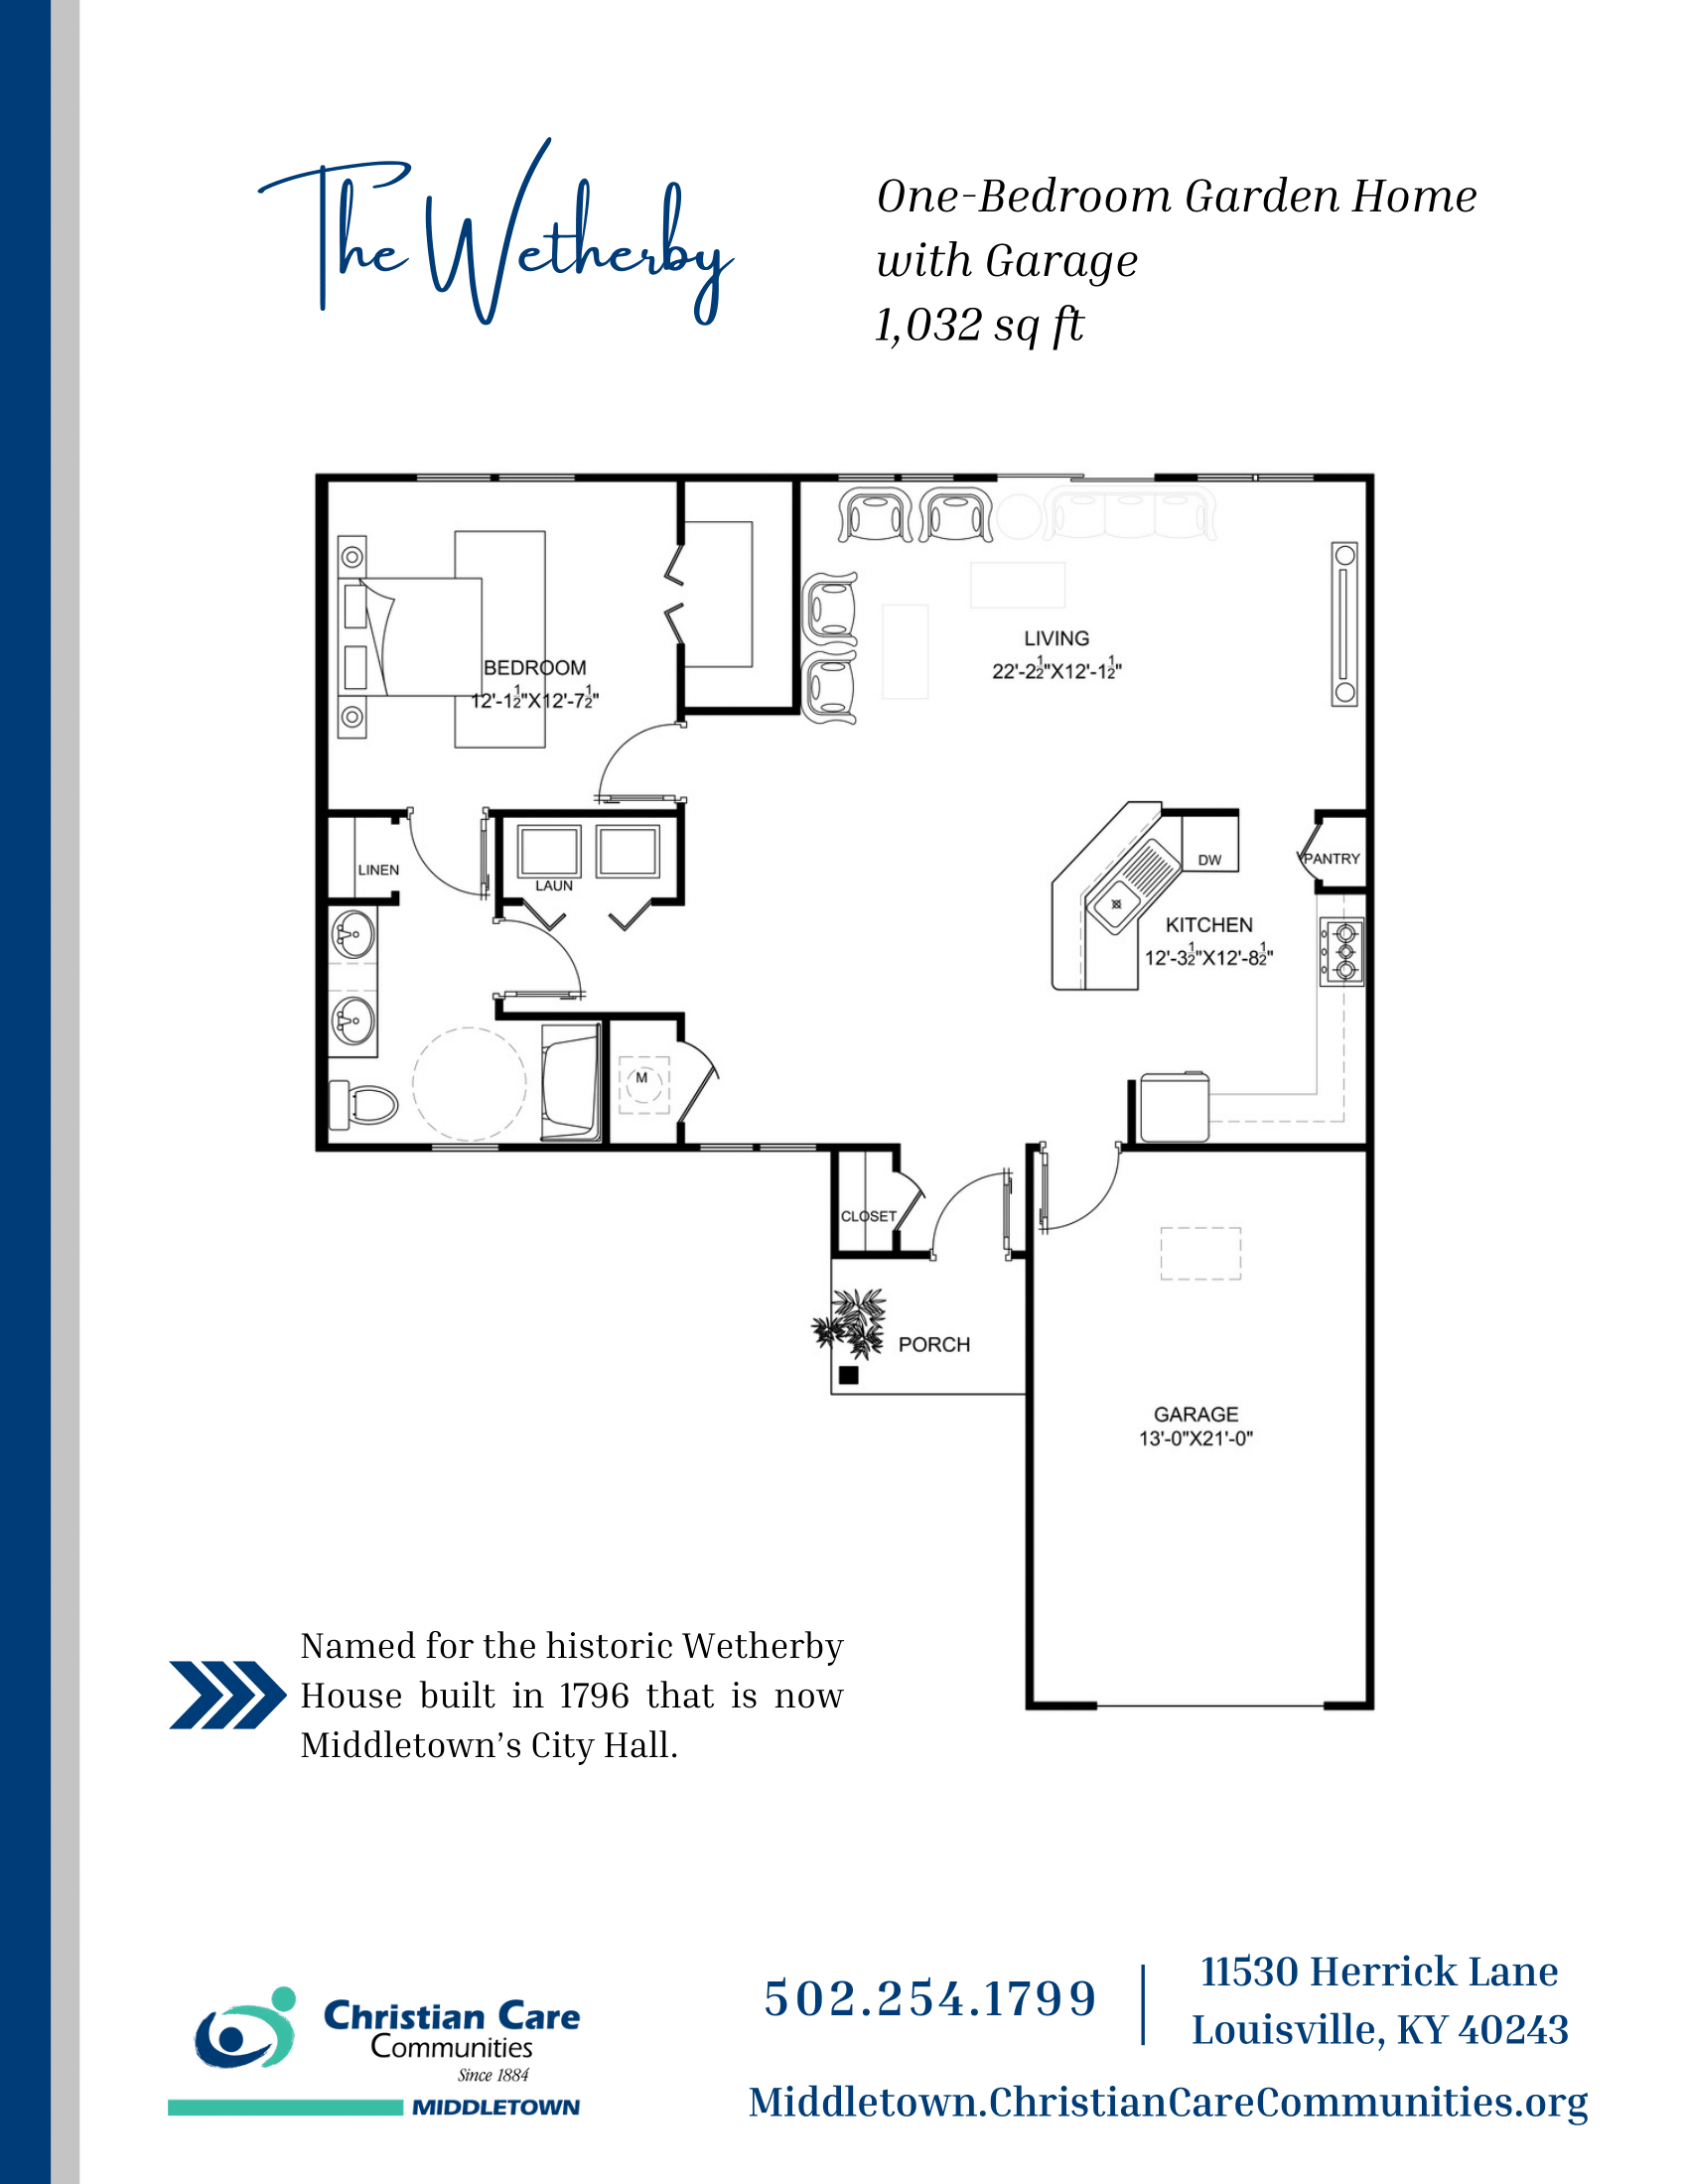
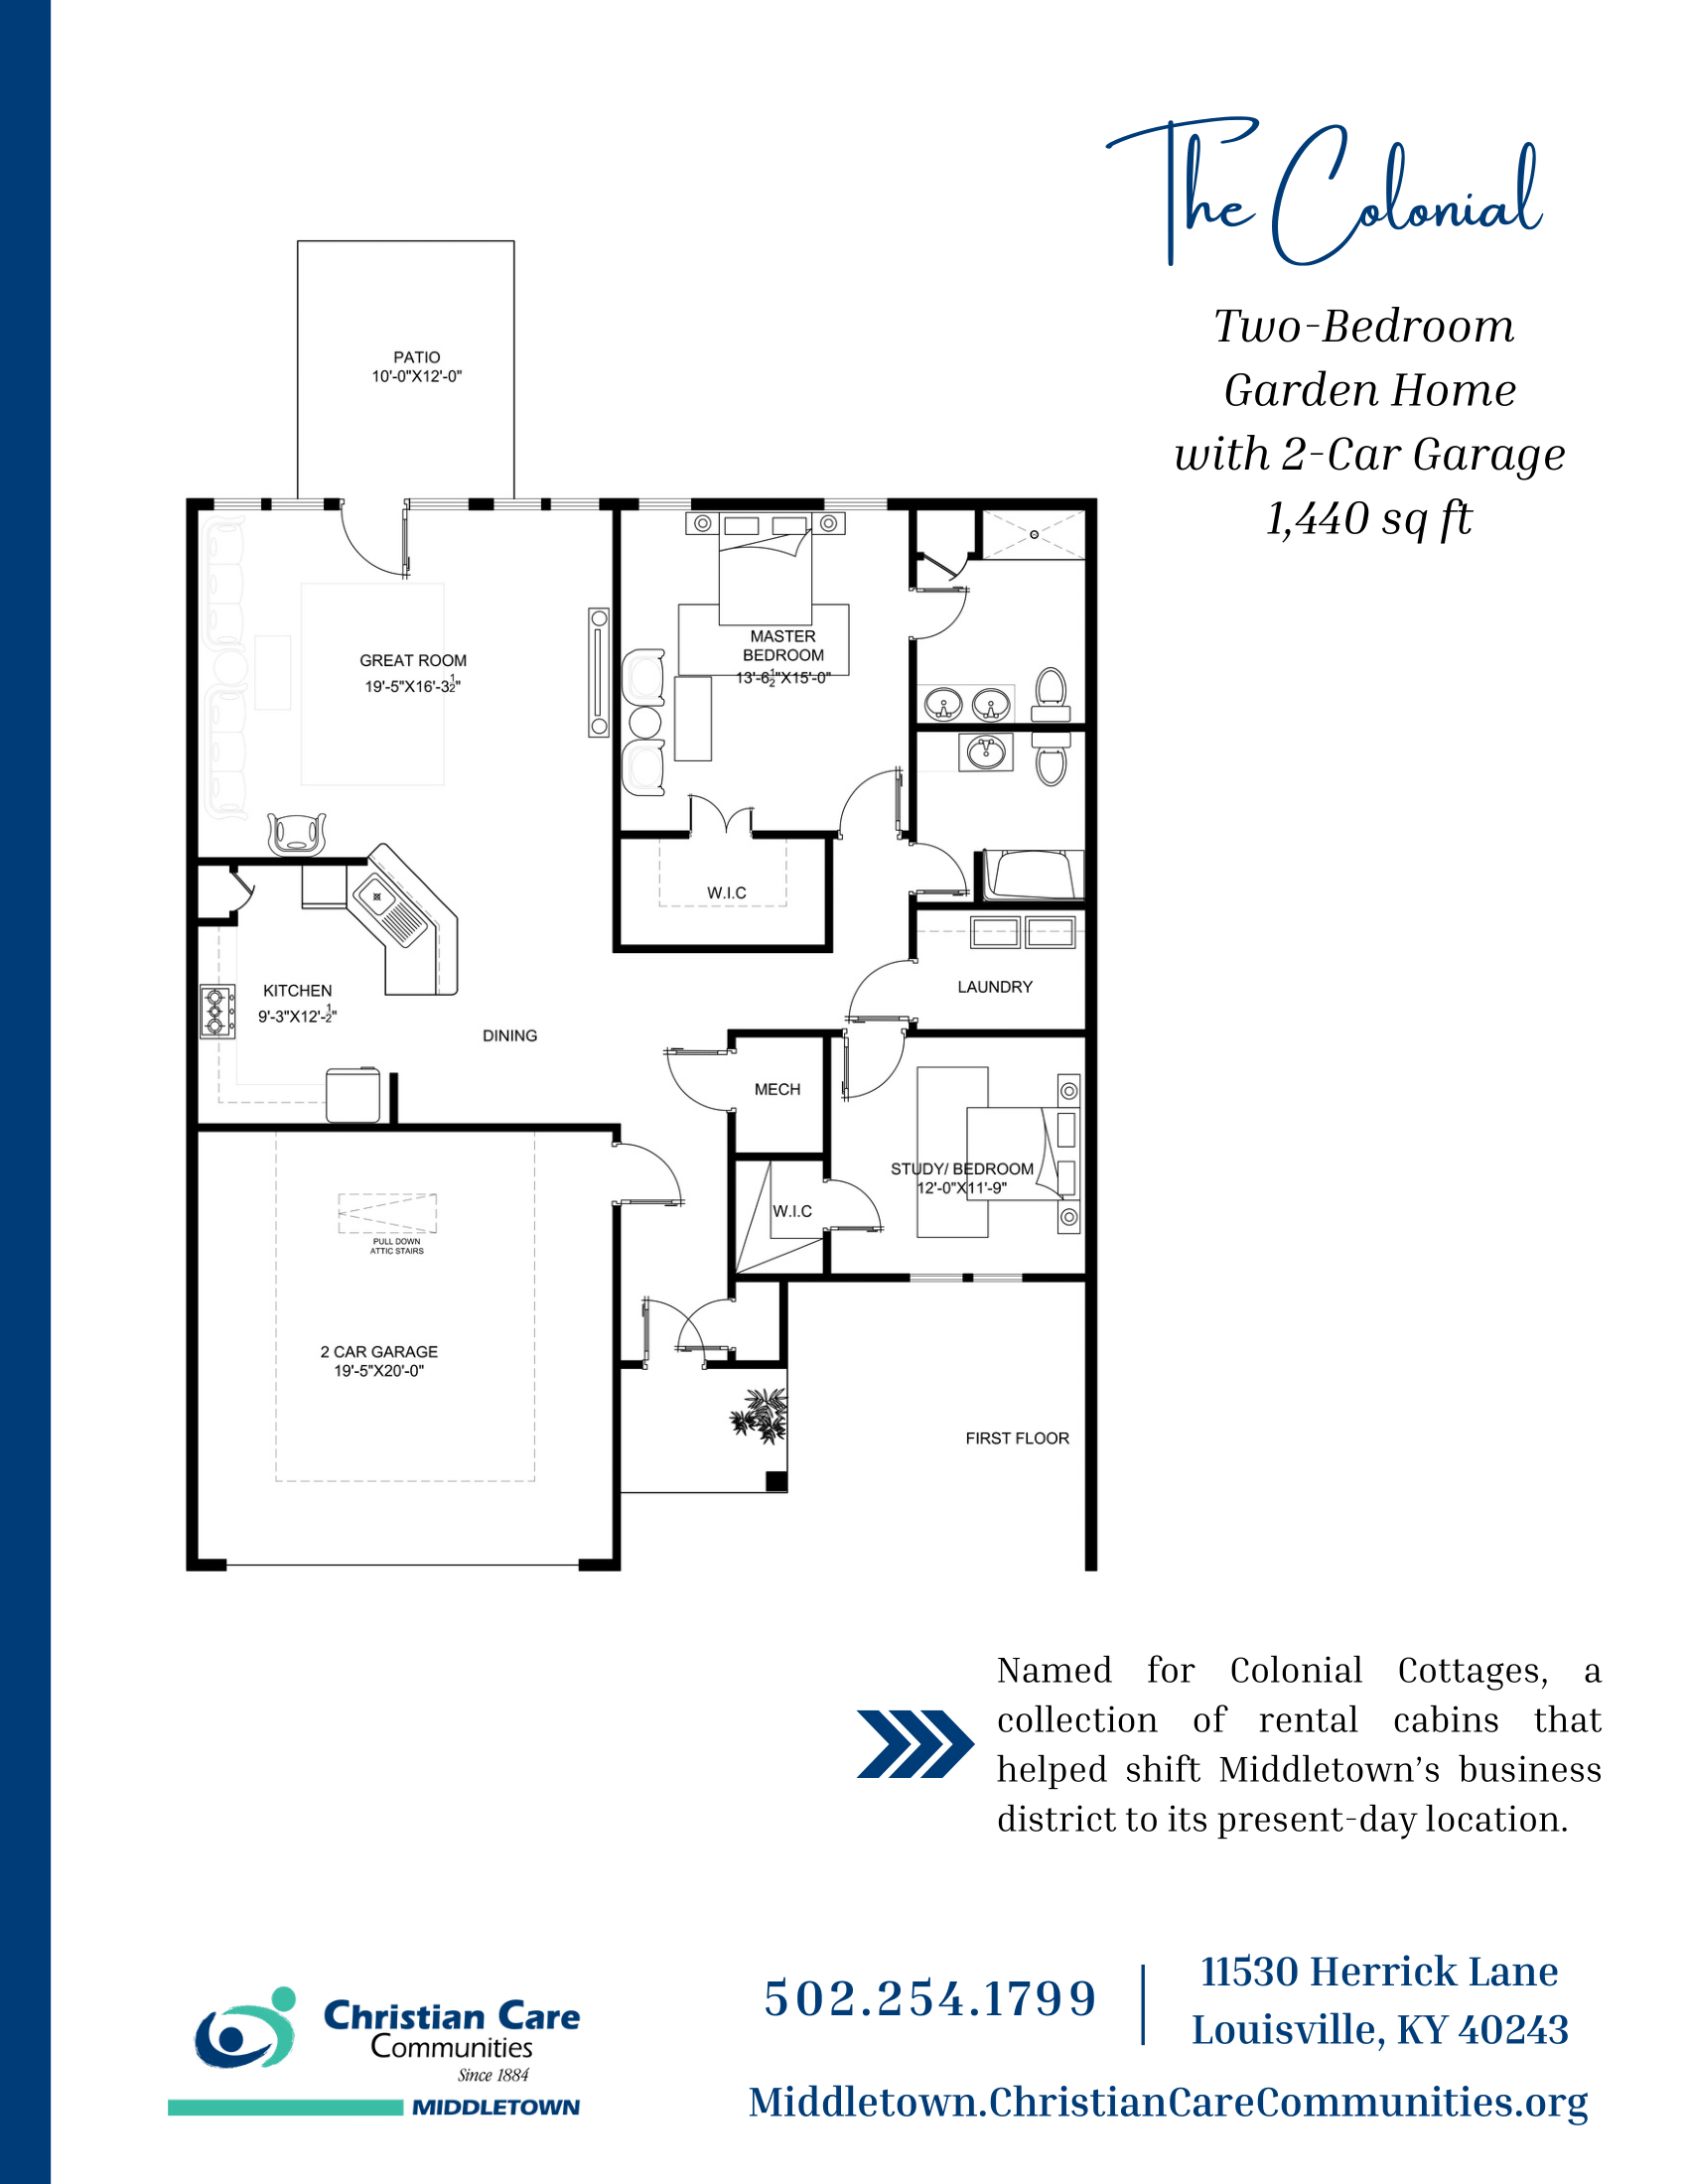
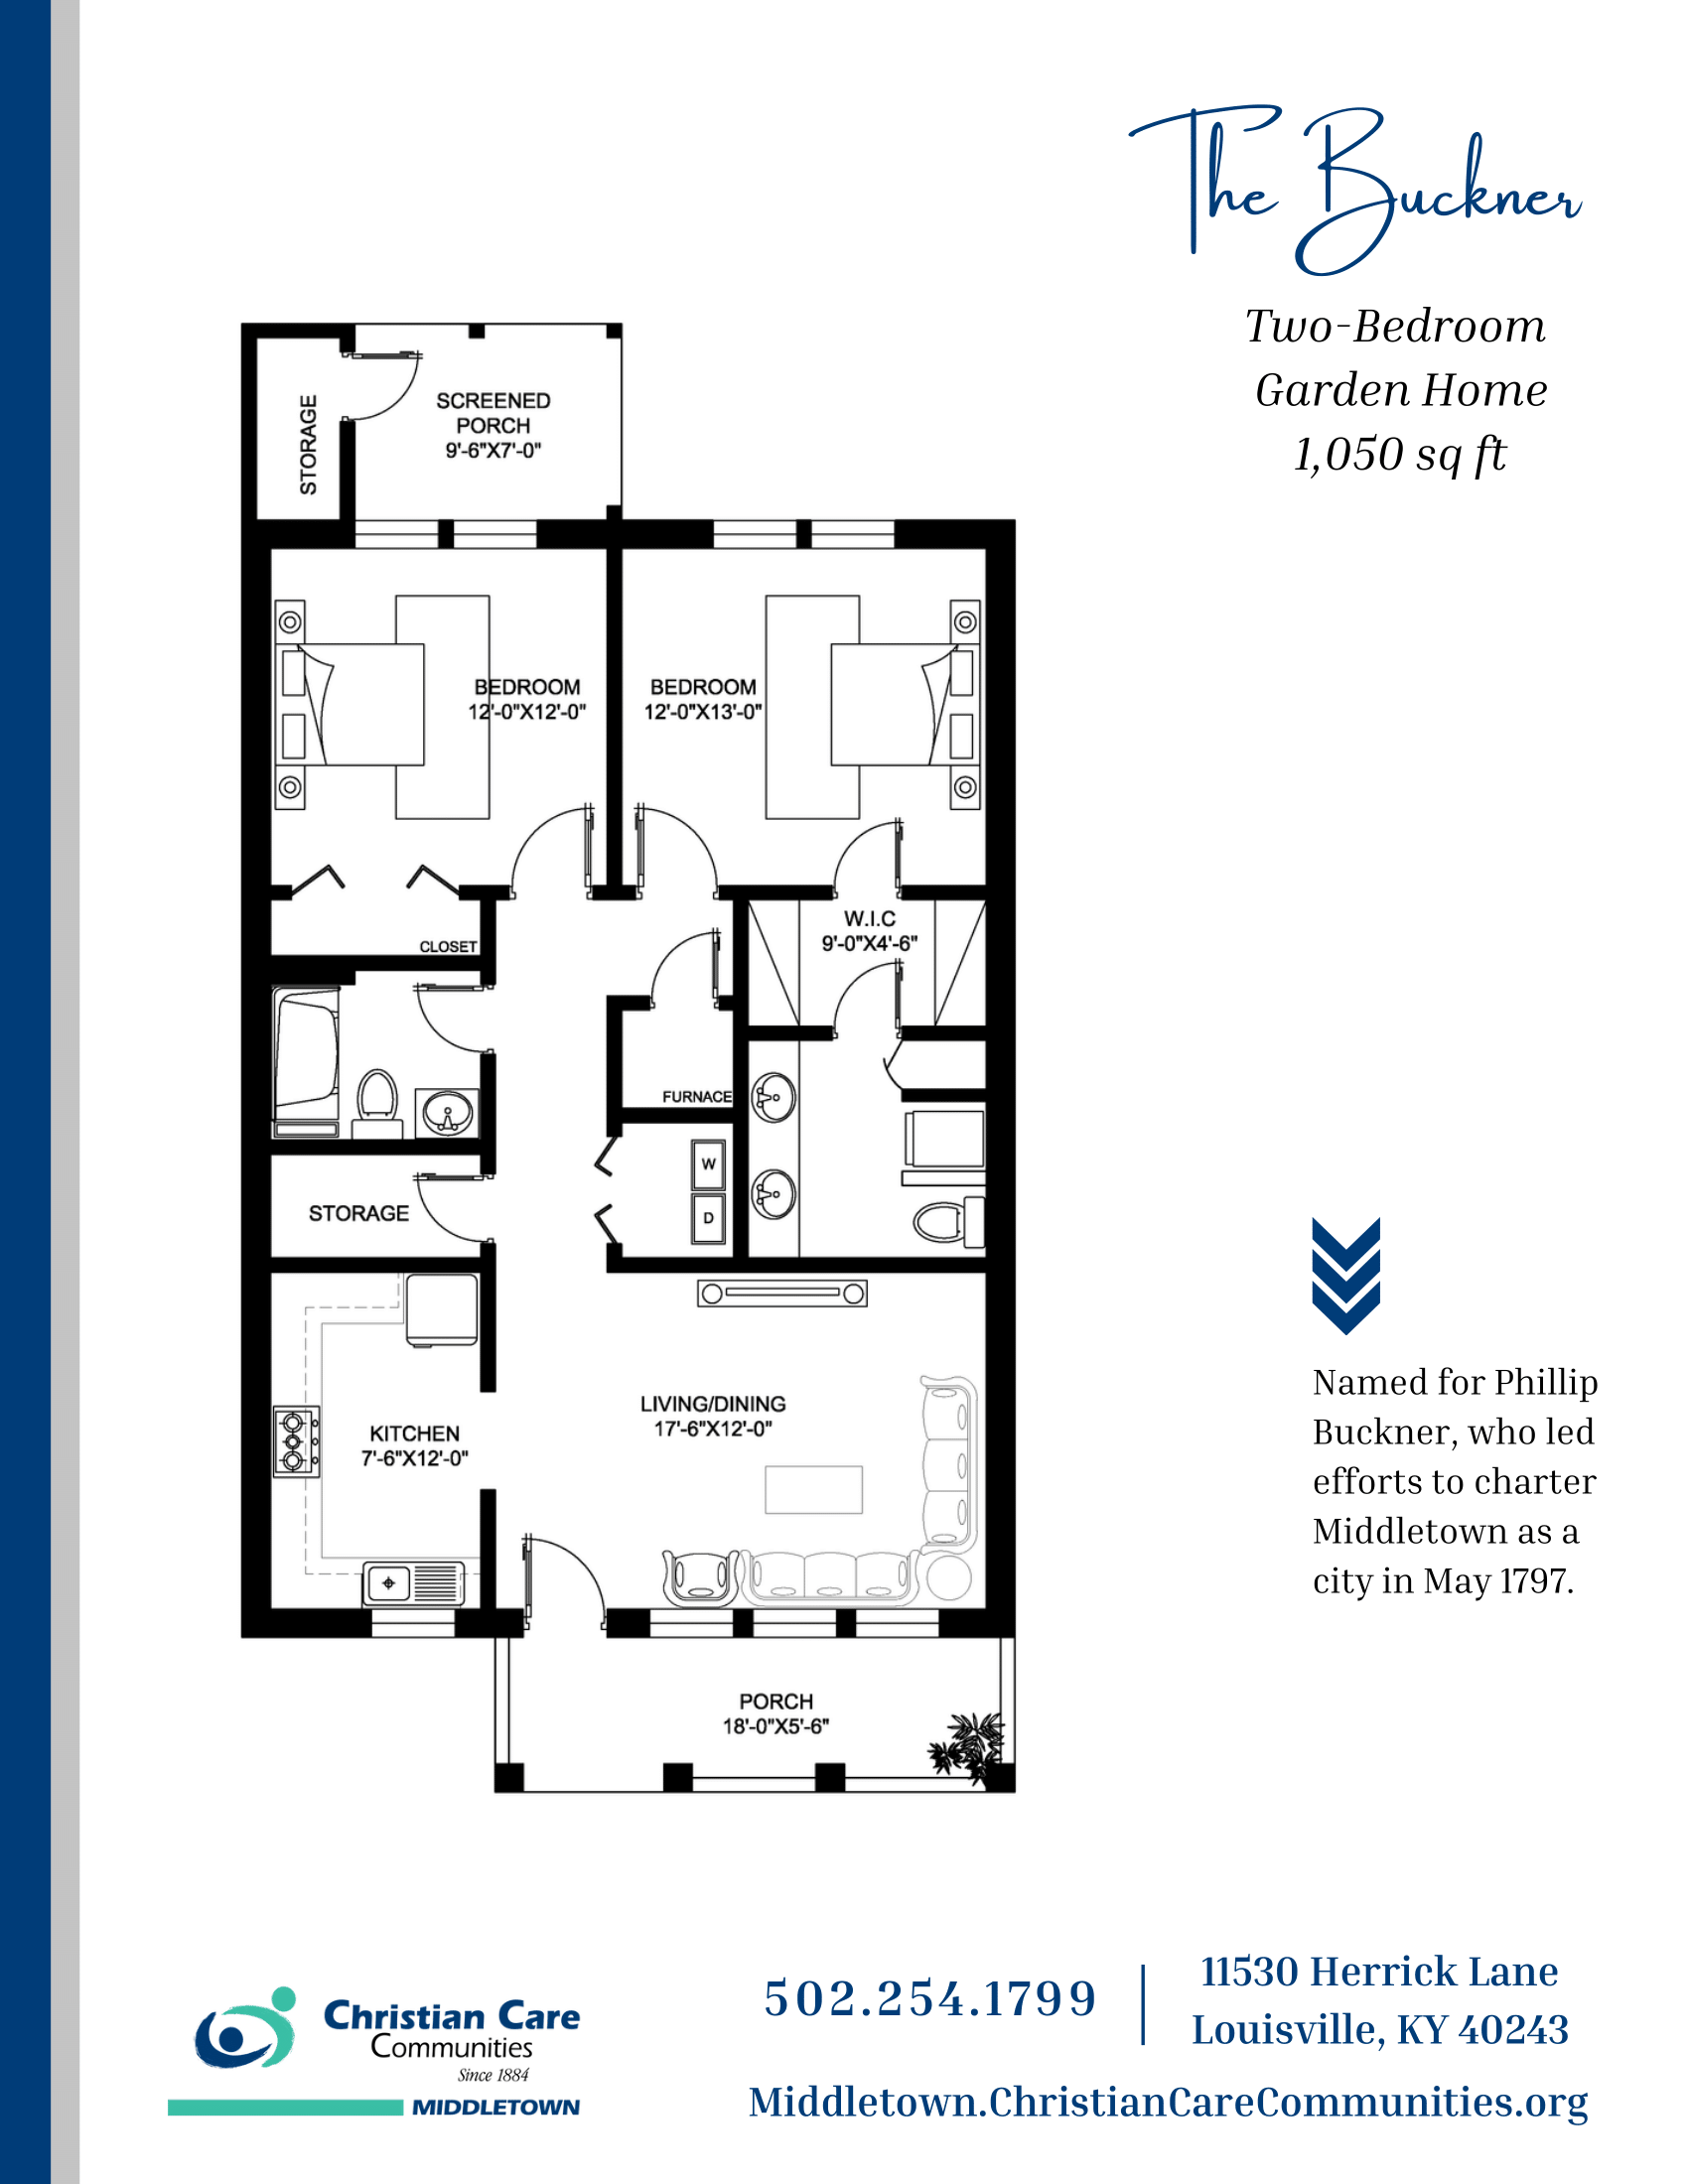
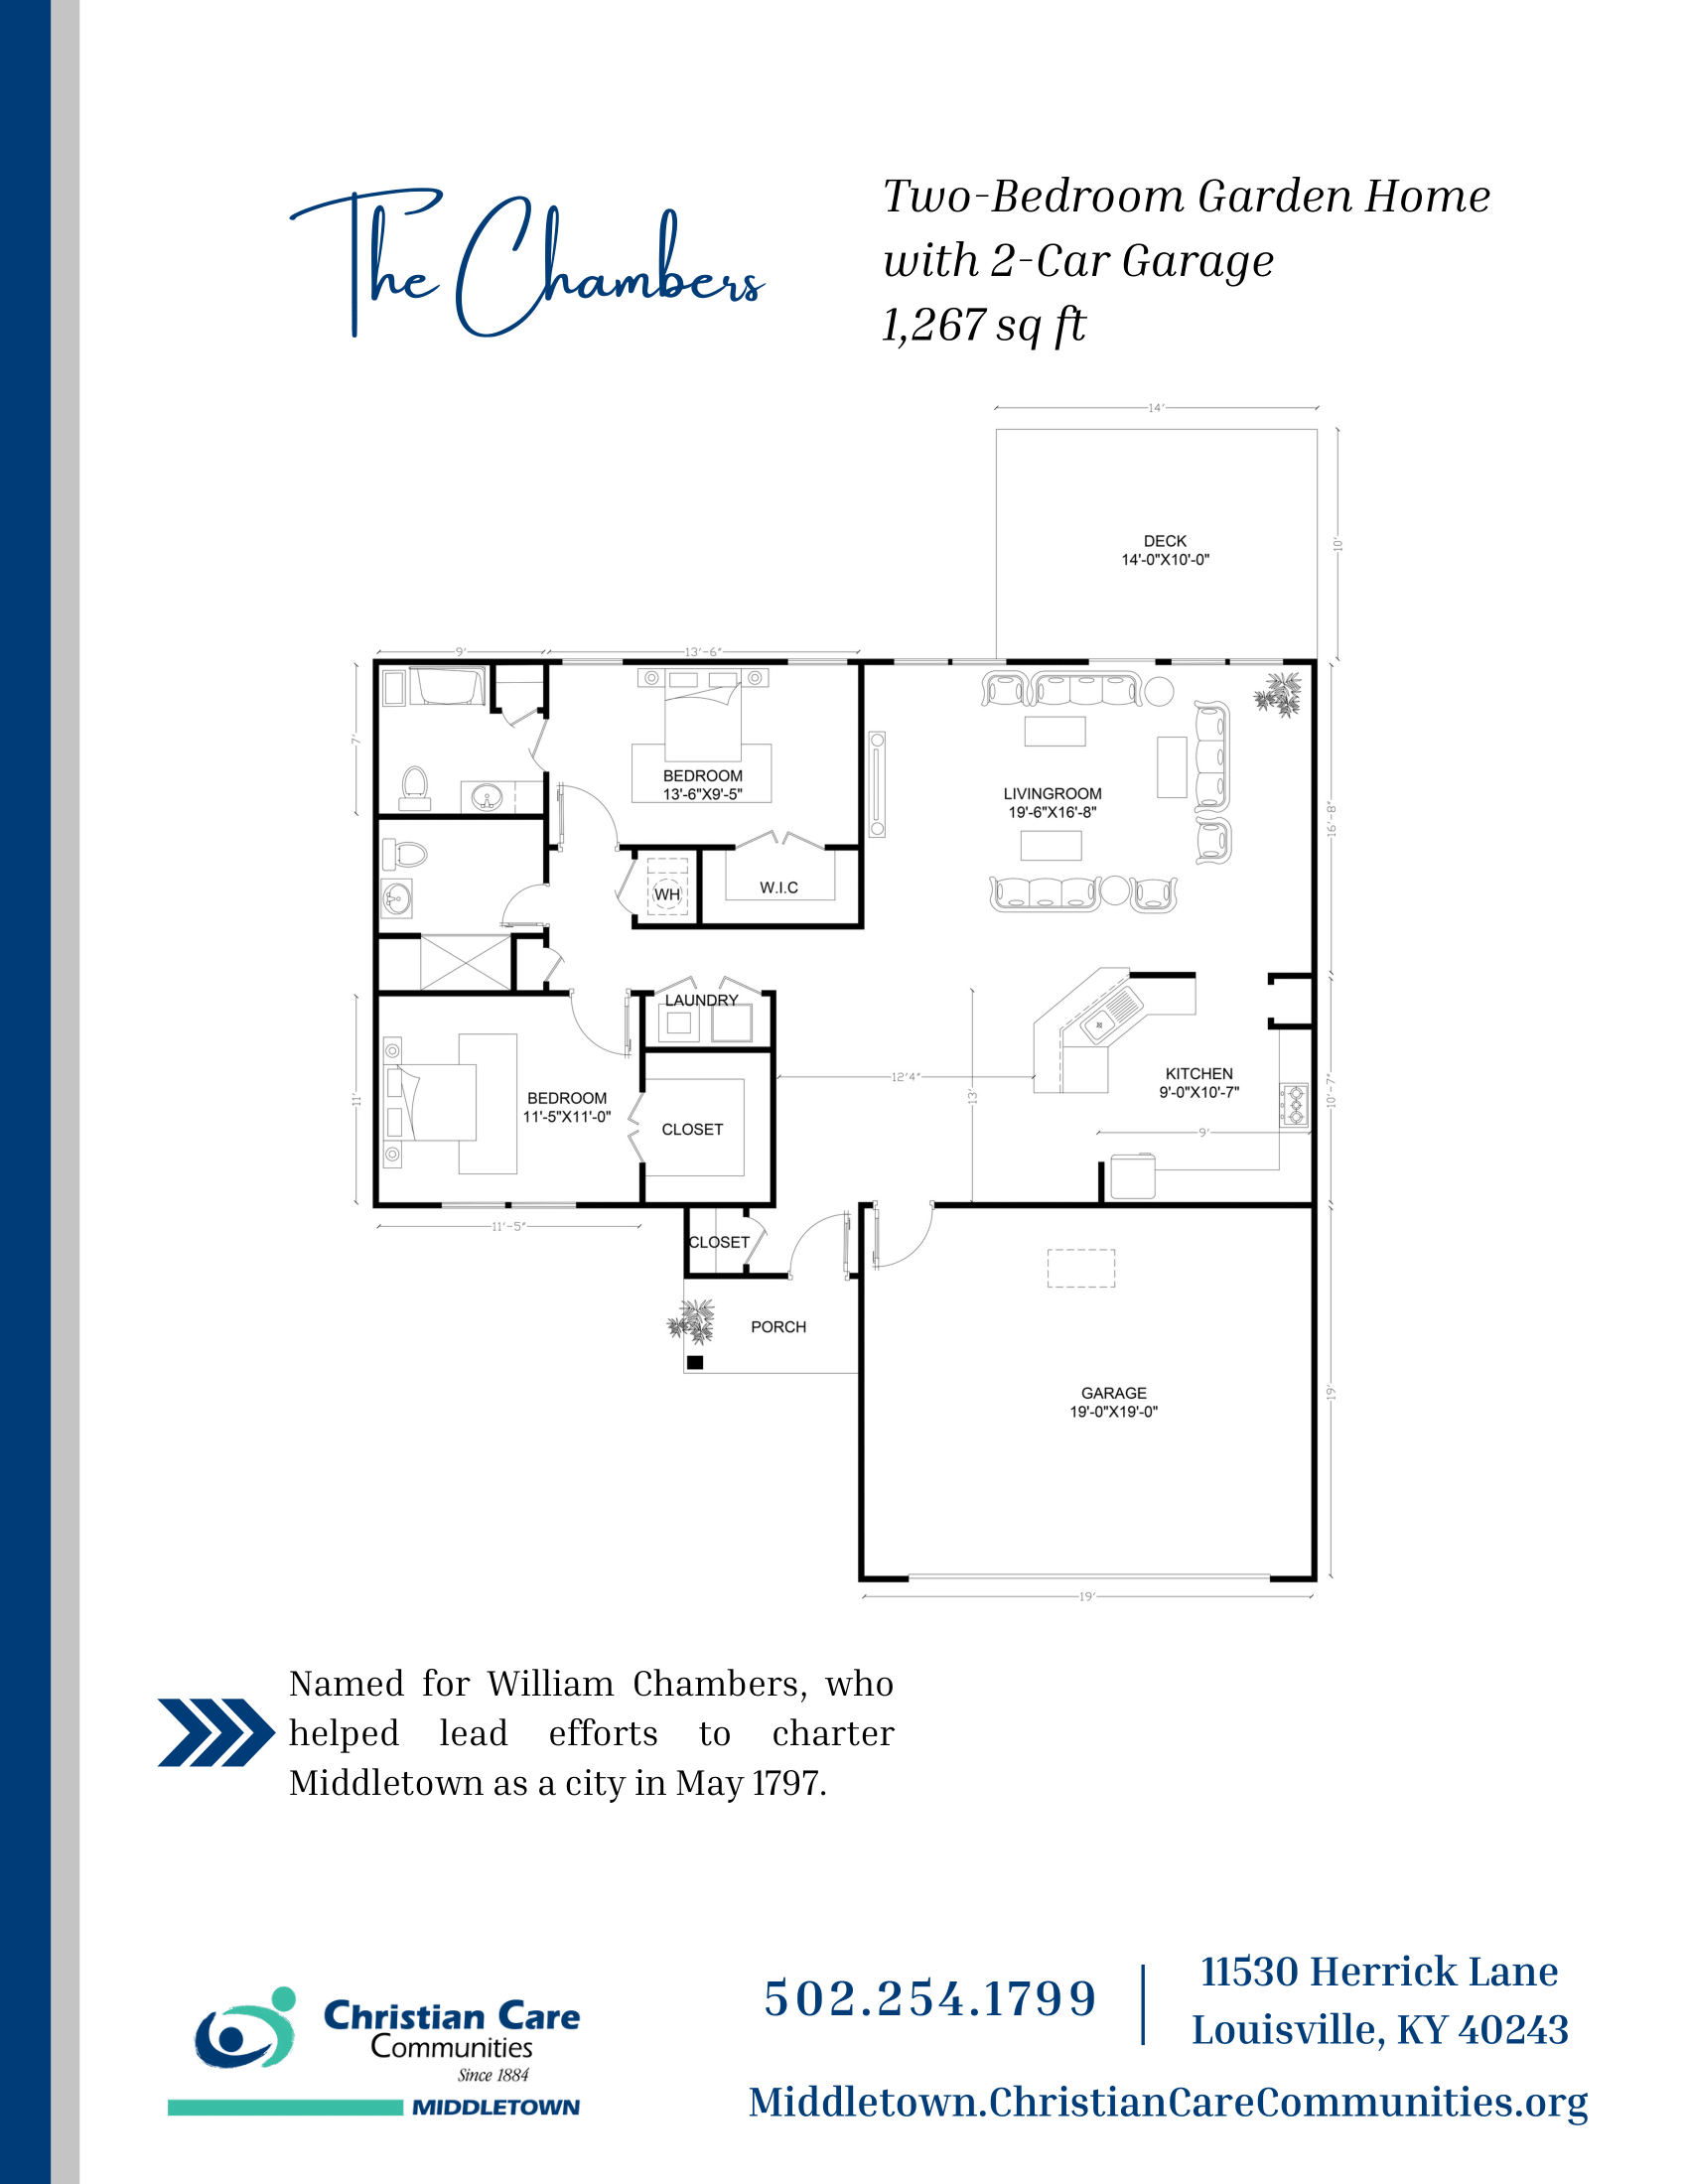
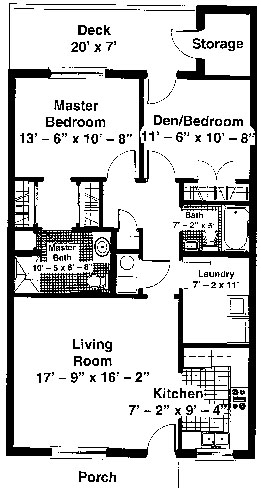
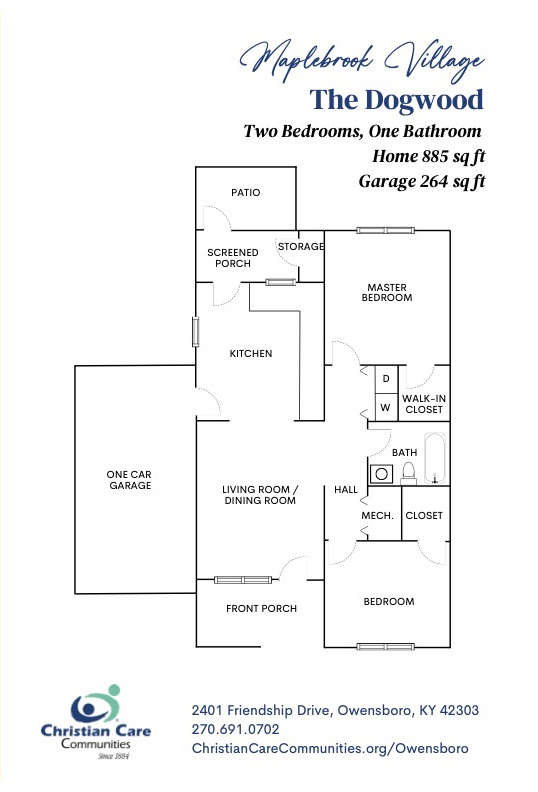
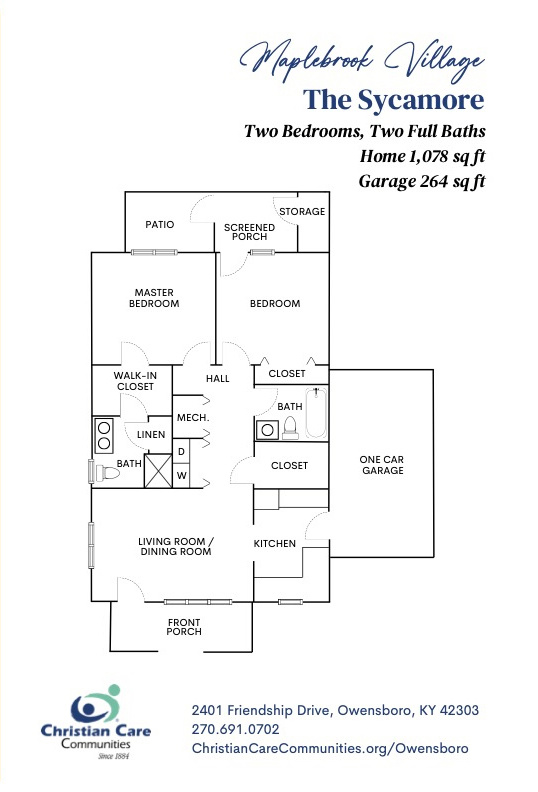
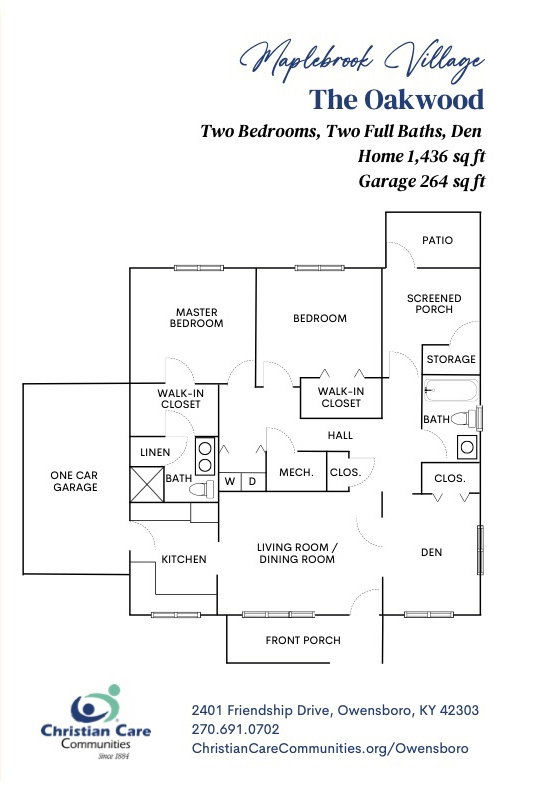
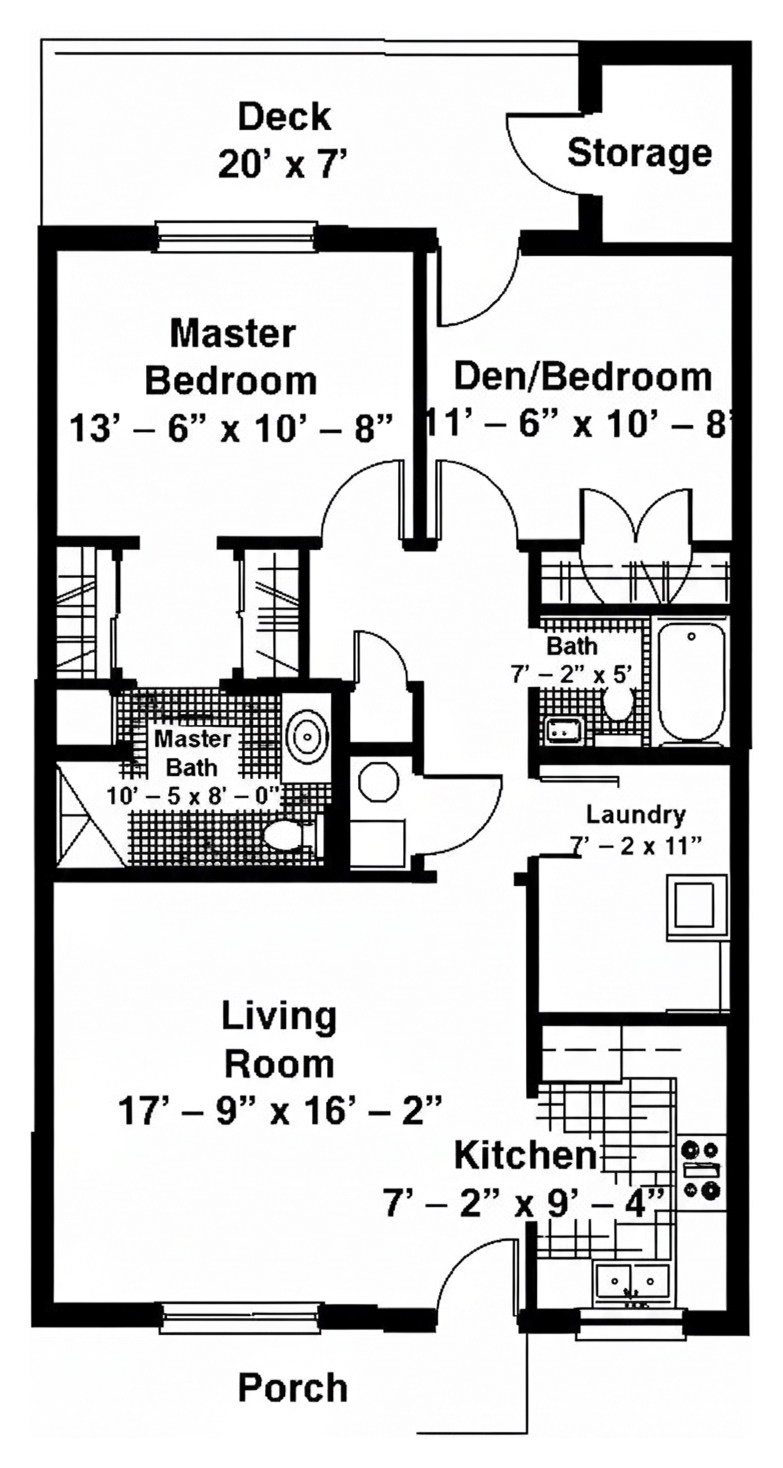
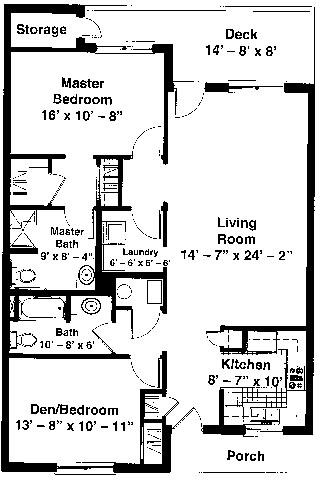
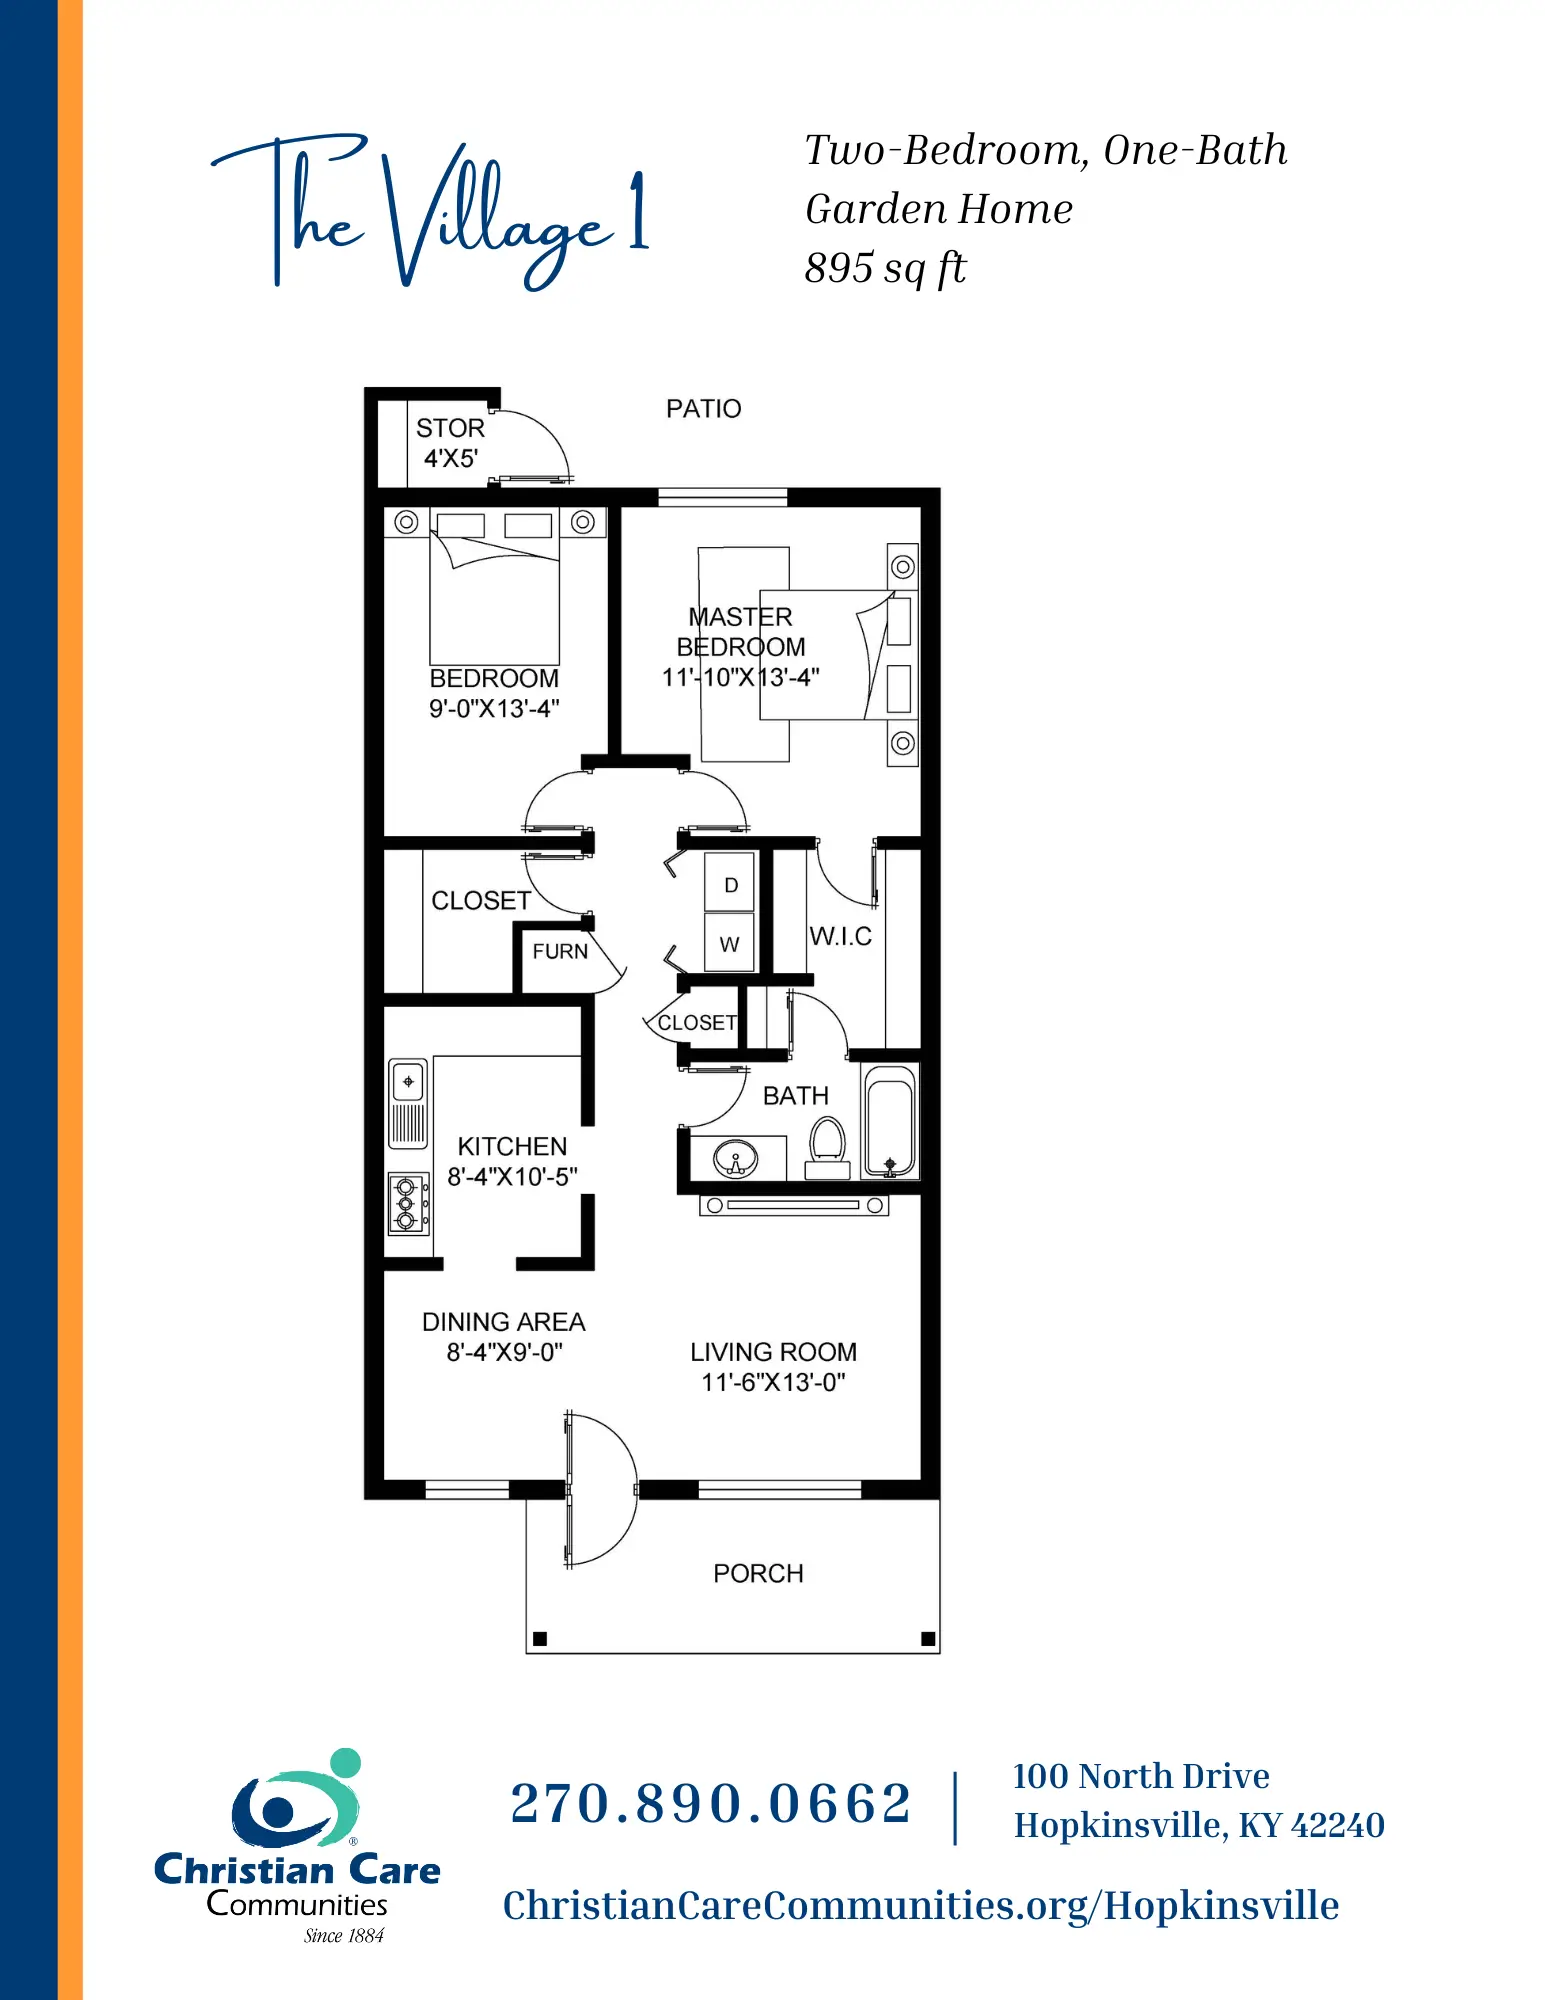
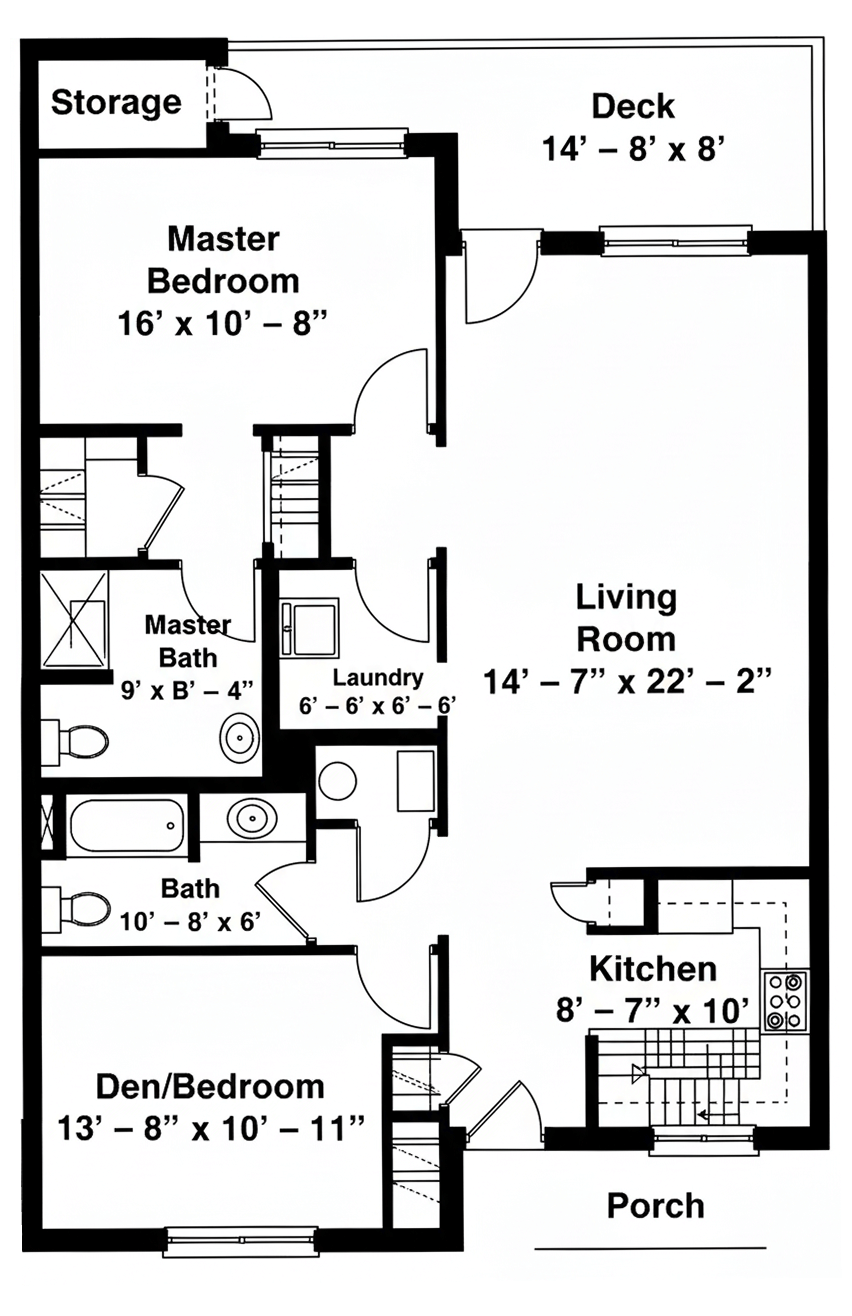
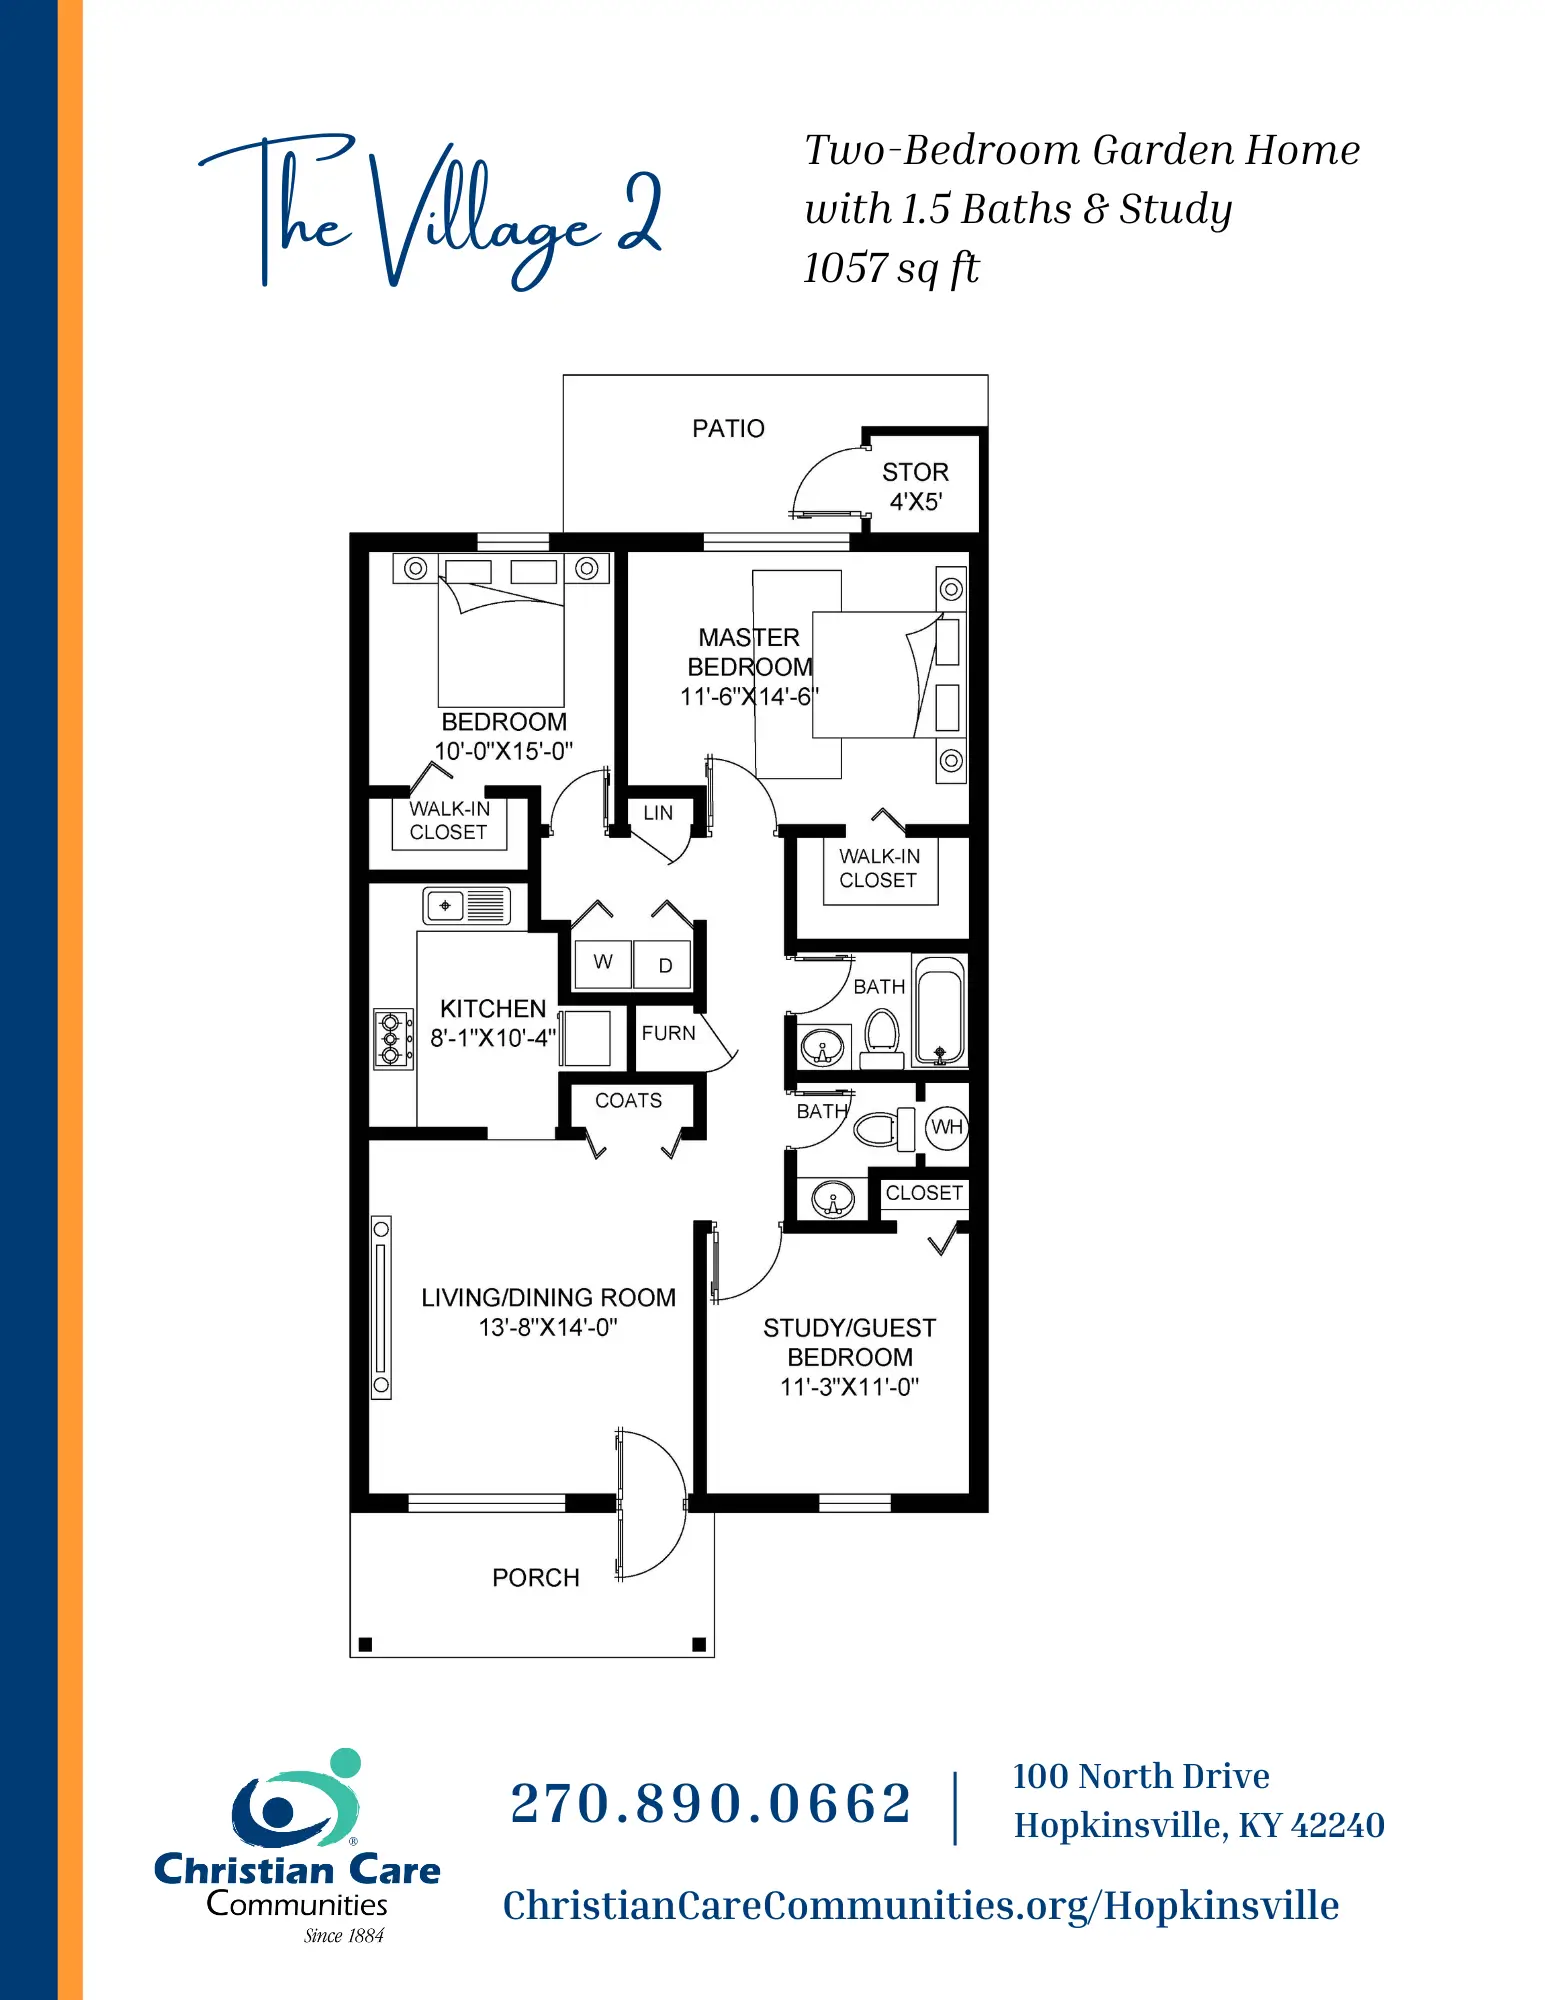
Yes — see the floorplan options available at Christian Health Center of Bowling Green on this page.
No, Christian Health Center of Bowling Green has a no-pet policy.
Christian Health Center of Bowling Green is registered as a non-profit.
Yes — there are 125 photos of Christian Health Center of Bowling Green in the photo gallery on this page.
Christian Health Center of Bowling Green is located at 1880 Westen St, Bowling Green, KY 42104.
Care Cost Calculator: See Prices in Your Area
Nursing Home Data Explorer
Don’t Wait Too Long: 7 Red Flag Signs Your Parent Needs Assisted Living Now
The True Cost of Assisted Living in 2025 – And How Families Are Paying For It
Understanding Senior Living Costs: Pricing Models, Discounts & Financial Assistance


