


Total staff
83
Employees
77
Contractors
6
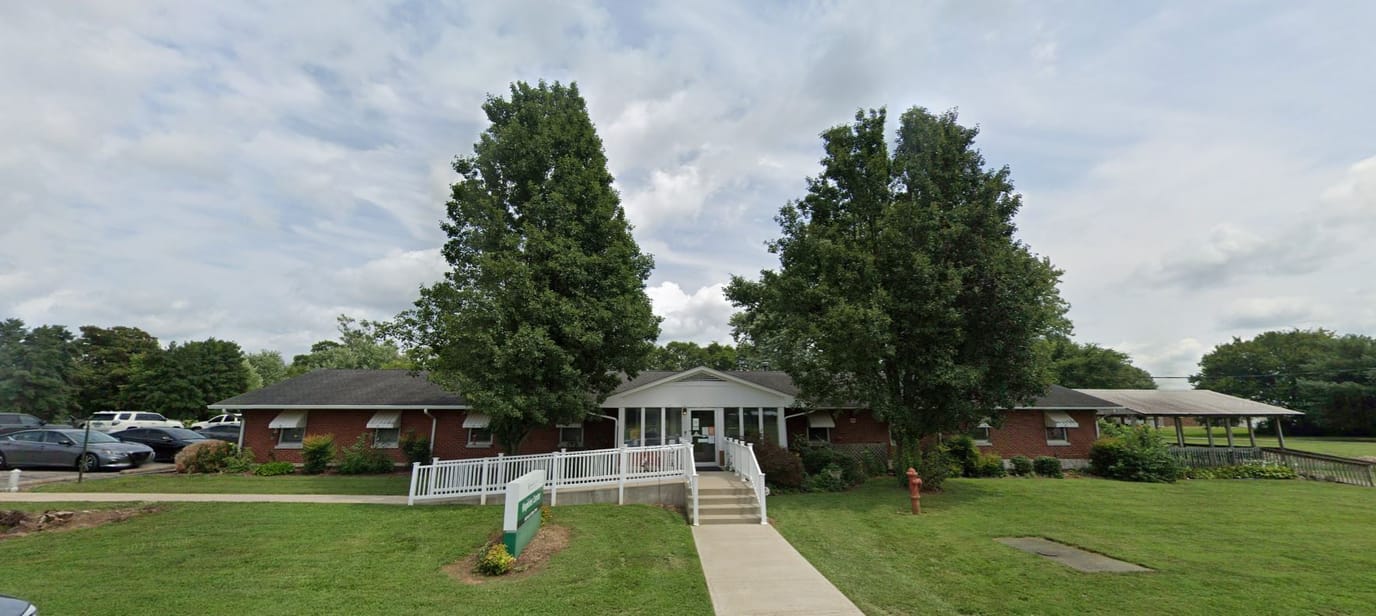
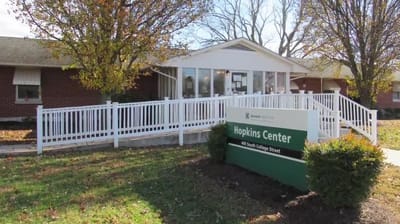
Hopkins Center runs 50 beds in a single-story building on South College Street in Woodburn, Kentucky, offering nursing home and skilled nursing care under one roof. The Walk Score is 7, about as car-dependent as it gets, so getting there and getting around needs a car.
Occupancy runs at 89.7%, and the average length of stay is 205 days, well over half a year. That’s a long-term profile, not a short-stay rehab pipeline, and it shapes what kind of resident this facility is really built for.
Clinically, the service list here goes deeper than a standard nursing home: recreational therapy, orthopedic rehabilitation, wound care, pain management, amputee recovery, and colostomy care. That’s a specific, fairly wide-ranging set of capabilities, not a generic “comprehensive care” claim. Medicare, Medicaid, and private pay are all accepted, and the community allows pets, which matters for residents settling in for the long haul.
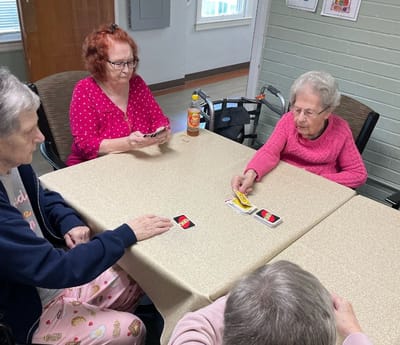
Structurally, residents get a voice: an active resident council and a regular resident group both meet to discuss policy and care quality, backed by an on-site, state-approved Nurse Aide Training program. Transportation services and fitness and recreation programming fill out the rest of daily life.
Between the long average stay, the specific clinical service list, and the resident-council structure, Hopkins Center reads as a facility built for residents who need sustained, specialized medical support over months rather than weeks, with a pet-friendly setup and some real say in how the place runs.
Staffing hours
![]() Daily nursing hours per resident by staff type, reported to CMS. Higher is generally better — compare this facility to state and national averages to see where staffing stands.
Daily nursing hours per resident by staff type, reported to CMS. Higher is generally better — compare this facility to state and national averages to see where staffing stands.
Hours per resident per day vs Kentucky averages
Total nursing care
![]() This home is ranked 173rd out of 189 homes in Kentucky for nurse hours. Total adjusted nursing hours per resident per day, combining RN, LPN, and aide time. CMS adjusts this for case-mix so facilities can be fairly compared.
This home is ranked 173rd out of 189 homes in Kentucky for nurse hours. Total adjusted nursing hours per resident per day, combining RN, LPN, and aide time. CMS adjusts this for case-mix so facilities can be fairly compared.
2h 40m
29% below state avg4 of 6 metrics below state avg
Reporting period: October 1 – December 31, 2025 (Q4 2025). Source: CMS Payroll-Based Journal report.
Manages medical care and health needs.
Assists with medical care and medications.
Helps with daily care and mobility.
Total hours from contractors
61 contractor hours this quarter
| Certified Nursing Assistant | 33 | 0 | 33 | 8,302 | 92 | 100% | 8.3 |
| Licensed Practical Nurse | 12 | 0 | 12 | 2,647 | 92 | 100% | 8.4 |
| Registered Nurse | 6 | 0 | 6 | 1,851 | 92 | 100% | 10.2 |
| RN Director of Nursing | 4 | 0 | 4 | 847 | 63 | 68% | 7.6 |
| Medication Aide/Technician | 2 | 0 | 2 | 784 | 91 | 99% | 8.5 |
| Administrator | 1 | 0 | 1 | 512 | 64 | 70% | 8 |
| Nurse Practitioner | 1 | 0 | 1 | 512 | 64 | 70% | 8 |
| Dental Services Staff | 1 | 0 | 1 | 475 | 58 | 63% | 8.2 |
| Other Dietary Services Staff | 1 | 0 | 1 | 468 | 68 | 74% | 6.9 |
| Physical Therapy Aide | 3 | 0 | 3 | 465 | 67 | 73% | 6.9 |
| Respiratory Therapy Technician | 3 | 0 | 3 | 261 | 54 | 59% | 4.6 |
| Qualified Social Worker | 4 | 0 | 4 | 139 | 61 | 66% | 2.3 |
| Physical Therapy Assistant | 1 | 0 | 1 | 74 | 25 | 27% | 3 |
| Speech Language Pathologist | 4 | 0 | 4 | 64 | 20 | 22% | 3.2 |
| Clinical Nurse Specialist | 1 | 0 | 1 | 64 | 8 | 9% | 8 |
| Occupational Therapy Aide | 0 | 1 | 1 | 42 | 13 | 14% | 3.2 |
| Occupational Therapy Assistant | 0 | 4 | 4 | 17 | 25 | 27% | 0.7 |
| Medical Director | 0 | 1 | 1 | 2 | 2 | 2% | 1 |
Federal penalties imposed by CMS for regulatory violations, including civil money penalties (fines) and denials of payment for new Medicare/Medicaid admissions.
Source: CMS Penalties Database
No penalties in the past 3 years
No civil money penalties or payment denials were reported in the last 3 years.
These measures show how residents usually do over time at this home, based on health outcomes and preventive care.
Kentucky average: 10.5
Kentucky average: 18.9
Kentucky average: 16.8%
Kentucky average: 19.6%
Kentucky average: 20.5%
Kentucky average: 3.8%
Kentucky average: 5.8%
Kentucky average: 1.9%
Kentucky average: 6.8%
Kentucky average: 14.3%
Kentucky average: 15.6%
Kentucky average: 93.9%
Kentucky average: 96.2%
Kentucky average: 1.68
Kentucky average: 1.20
Kentucky average: 83.7%
Kentucky average: 1.9%
Kentucky average: 23.1%
Kentucky average: 9.8%
Kentucky average: 0.8%
Kentucky average: 53.7%
Kentucky average: 50.6%
Quality measures are calculated from Minimum Data Set (MDS) assessments. For most measures, lower percentages indicate better care quality.
29% of new residents, usually for short-term rehab.
59% of new residents, often for short stays.
12% of new residents, often for long-term daily care.
Source: CMS Long-Term Care Facility Characteristics (Data as of Jan 2026)
Residents meet regularly to discuss policies, care quality, and activities
State-approved Nurse Aide Training and Competency Evaluation Program on-site
Organized group of residents that meets regularly to discuss facility policies, quality of life, and activities.
Data sourced from CMS Long-Term Care Facility Characteristics quarterly report. Payer mix reflects the current resident census by primary payment source.
Historical financial and operational data for Hopkins Center from 2011–2022, based on CMS SNF Cost Reports.
Key figures below are for fiscal year ending in 10/2022 — the home's most recent complete cost report, an older period than most facilities report.
Based on the home's most recent complete CMS SNF Cost Report — fiscal year ending in 10/2022. This is an older period than most facilities report, so compare with that in mind.
Pets Allowed
Housing Options: Private Rooms / Semi-Private Rooms
Building Type: Single-story
Transportation Services
Fitness and Recreation
This home supports both short-term rehab and long-term care, with residents staying for a wide range of durations.
Most new residents arrive under private pay (59% of admissions), and a typical private pay stay runs around 1 - 2 months.
Coverage residents most often arrive under.
Coverage residents most often leave under.
![]() 0.3 miles from city center
0.3 miles from city center
![]() Estimated distance in miles from Woodburn's city center to Hopkins Center's address, calculated via Google Maps.
Estimated distance in miles from Woodburn's city center to Hopkins Center's address, calculated via Google Maps.
Add your location
Info below is compiled from CMS reports & the KY Cabinet for Health & Family Services (CHFS), senior community websites & trusted data sources such as Walk Score & BBB.
Communities are listed from highest to lowest based on our ranking methodology.
| Magnolia Village | NH SNF | Bowling Green (Eastland Park) | 60
Facility
60
KY AVG
82
Rank
#223 / 341 |
96.7%
Facility
96.7%
KY AVG
84.3
Rank
#15 / 168 | +15% | 2.56
Facility
2.56
KY AVG
3.75
Rank
#176 / 189 | -32% | -32% | $0
Facility
$0
KY AVG
$65.4k
Rank
#1 / 195 | 8
Facility
8
KY AVG
13.5
Rank
#47 / 191 | 4.0
Facility
4.0
KY AVG
4.4
Rank
#89 / 191 | - | 58 | - |
37
Facility
37
KY AVG
43
Rank
#237 / 403 | Magnolia Village Health Center LLC | $6.8MFiscal year ending 12/2023
Facility
$6.8MFiscal year ending 12/2023
KY AVG
$9.8M
Rank
#139 / 184 | $2.8MFiscal year ending 12/2023
Facility
$2.8MFiscal year ending 12/2023
KY AVG
$4.8M
Rank
#154 / 184 | 41.2%Fiscal year ending 12/2023
Facility
41.2%Fiscal year ending 12/2023
KY AVG
48.9%
Rank
#145 / 184 | 185435 | ||||
| Edmonson Center | NH SNF | Brownsville | 74
Facility
74
KY AVG
82
Rank
#181 / 341 |
97.3%
Facility
97.3%
KY AVG
84.3
Rank
#13 / 168 | +15% | 3.47
Facility
3.47
KY AVG
3.75
Rank
#66 / 189 | -41% | -8% | $0
Facility
$0
KY AVG
$65.4k
Rank
#1 / 195 | 11
Facility
11
KY AVG
13.5
Rank
#87 / 191 | 5.5
Facility
5.5
KY AVG
4.4
Rank
#142 / 191 | 3 | 72 | - |
43
Facility
43
KY AVG
43
Rank
#206 / 403 | Edmonson Health Center LLC | $8.4MFiscal year ending 12/2023
Facility
$8.4MFiscal year ending 12/2023
KY AVG
$9.8M
Rank
#114 / 184 | $3.5MFiscal year ending 12/2023
Facility
$3.5MFiscal year ending 12/2023
KY AVG
$4.8M
Rank
#126 / 184 | 42%Fiscal year ending 12/2023
Facility
42%Fiscal year ending 12/2023
KY AVG
48.9%
Rank
#141 / 184 | 185401 | ||||
| Hopkins Center | NH SNF | Woodburn | 50
Facility
50
KY AVG
82
Rank
#258 / 341 |
84.6%
Facility
84.6%
KY AVG
84.3
Rank
#108 / 168 | 0% | 2.67
Facility
2.67
KY AVG
3.75
Rank
#173 / 189 | -33% | -29% | $0
Facility
$0
KY AVG
$65.4k
Rank
#1 / 195 | 8
Facility
8
KY AVG
13.5
Rank
#47 / 191 | 2.7
Facility
2.7
KY AVG
4.4
Rank
#36 / 191 | - | 42 | - |
7
Facility
7
KY AVG
43
Rank
#382 / 403 | - | $5.4M*Fiscal year ending 10/2022These figures are from this home's most recent complete cost report — an older period than most facilities report. Compare with that in mind. | $2.6M*Fiscal year ending 10/2022These figures are from this home's most recent complete cost report — an older period than most facilities report. Compare with that in mind. | 47.7%*Fiscal year ending 10/2022These figures are from this home's most recent complete cost report — an older period than most facilities report. Compare with that in mind. | 185167 | ||||
| Signature Healthcare of Bowling Green | NH HOS MC PC RC SNF | Bowling Green | 176
Facility
176
KY AVG
82
Rank
#11 / 341 |
79.1%
Facility
79.1%
KY AVG
84.3
Rank
#133 / 168 | -6% | 3.27
Facility
3.27
KY AVG
3.75
Rank
#91 / 189 | -34% | -13% | $0
Facility
$0
KY AVG
$65.4k
Rank
#1 / 195 | 13
Facility
13
KY AVG
13.5
Rank
#103 / 191 | 4.3
Facility
4.3
KY AVG
4.4
Rank
#101 / 191 | - | 139 | A+ |
64
Facility
64
KY AVG
43
Rank
#79 / 403 | Shc Ky Holdings LLC | $15.3MFiscal year ending 12/2023
Facility
$15.3MFiscal year ending 12/2023
KY AVG
$9.8M
Rank
#16 / 184 | $5.2MFiscal year ending 12/2023
Facility
$5.2MFiscal year ending 12/2023
KY AVG
$4.8M
Rank
#59 / 184 | 34%Fiscal year ending 12/2023
Facility
34%Fiscal year ending 12/2023
KY AVG
48.9%
Rank
#173 / 184 | 185089 | ||||
| Christian Health Center of Bowling Green | NH AL IL MC SNF | Bowling Green | 45
Facility
45
KY AVG
82
Rank
#269 / 341 |
89.8%
Facility
89.8%
KY AVG
84.3
Rank
#77 / 168 | +7% | 4.61
Facility
4.61
KY AVG
3.75
Rank
#16 / 189 | -10% | +23% | $0
Facility
$0
KY AVG
$65.4k
Rank
#1 / 195 | 2
Facility
2
KY AVG
13.5
Rank
#3 / 191 | 1.0
Facility
1.0
KY AVG
4.4
Rank
#1 / 191 | - | 40 | - |
28
Facility
28
KY AVG
43
Rank
#292 / 403 | Christian Care Communities, Inc | $6.3MFiscal year ending 12/2023
Facility
$6.3MFiscal year ending 12/2023
KY AVG
$9.8M
Rank
#148 / 184 | $2.6MFiscal year ending 12/2023
Facility
$2.6MFiscal year ending 12/2023
KY AVG
$4.8M
Rank
#158 / 184 | 40.6%Fiscal year ending 12/2023
Facility
40.6%Fiscal year ending 12/2023
KY AVG
48.9%
Rank
#147 / 184 | 185419 |
Hopkins Center is located in Woodburn, Kentucky.
Here are the financial assistance programs available to residents in Kentucky.
Hopkins Center has a walk score of 7. Car-dependent. Most errands require a car, with limited nearby walkable options.
Hopkins Center's occupancy is 89.7%.
Yes, Hopkins Center allows residents to bring their pets.
Hopkins Center is registered as a for-profit.
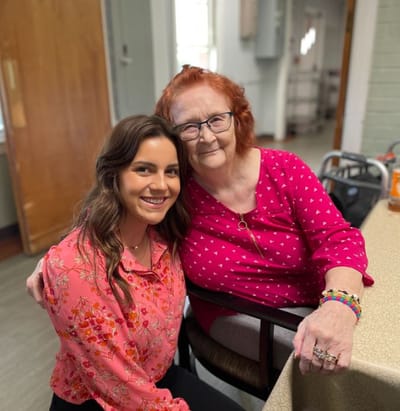
Yes — there are 4 photos of Hopkins Center in the photo gallery on this page.
Hopkins Center is located at 460 S College St, Woodburn, KY 42170.
(270) 529-2853 will put you in contact with the team at Hopkins Center.
Care Cost Calculator: See Prices in Your Area
Nursing Home Data Explorer
Don’t Wait Too Long: 7 Red Flag Signs Your Parent Needs Assisted Living Now
The True Cost of Assisted Living in 2025 – And How Families Are Paying For It
Understanding Senior Living Costs: Pricing Models, Discounts & Financial Assistance


