

Total health inspections
10
California average 12.5
Last Health inspection on Aug 2025

We arrange tours, appointments, and even moving support so you don’t have to
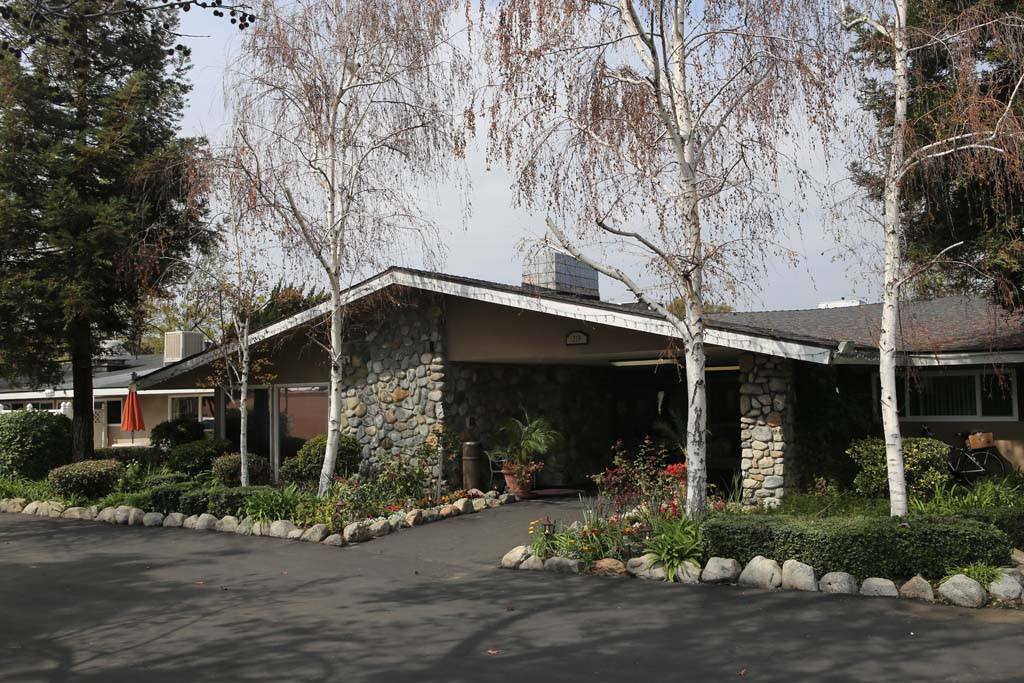
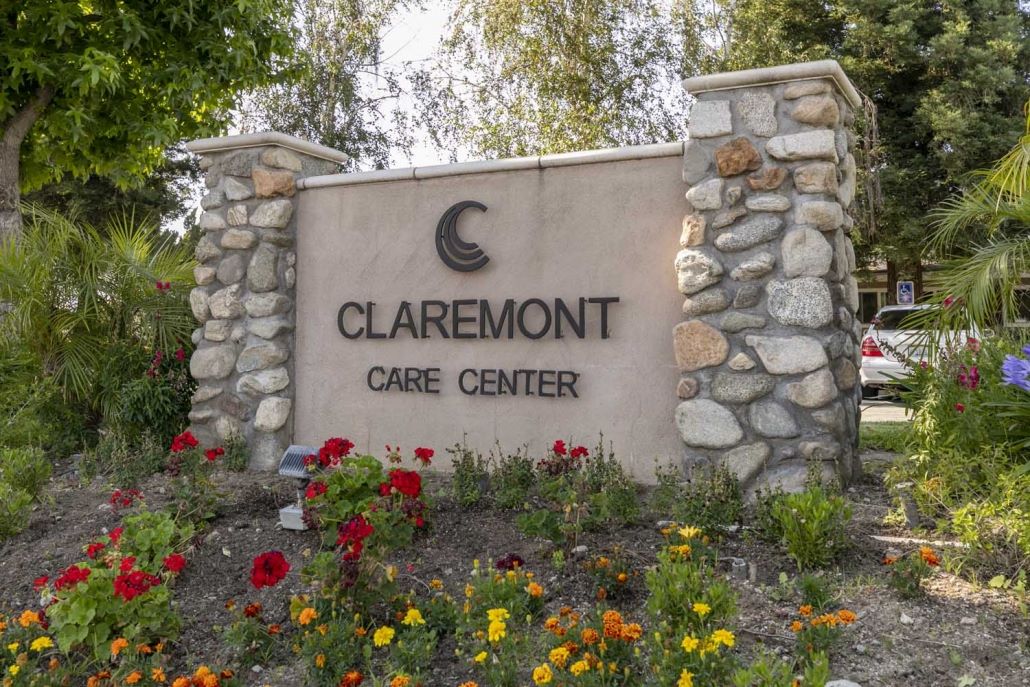
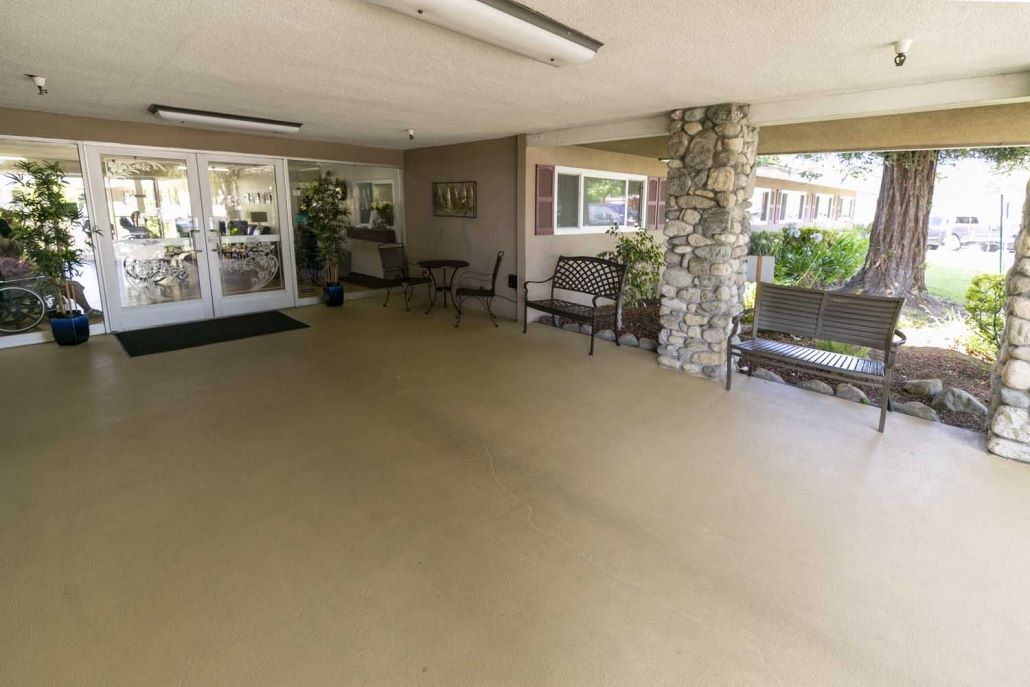
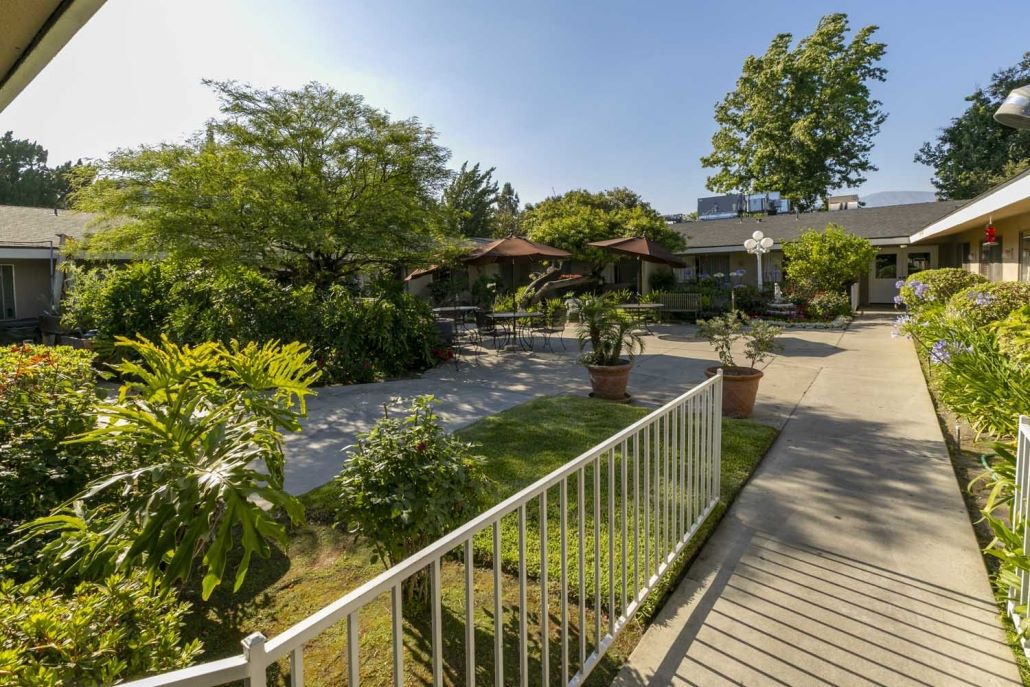

Claremont Care Center, Pomona, California’s premier location for nursing care, is committed to providing a welcoming environment where residents can regain strength, mobility, and a sense of home. The dedicated staff collaborates with individuals, families, and healthcare providers to develop personalized care and treatment plans. The facility prioritizes the art of caring, offering skilled nursing services with a focus on comfort, safety, and therapeutic support. Claremont Care Center’s vision is to be a center of excellence in the field of nursing homes.
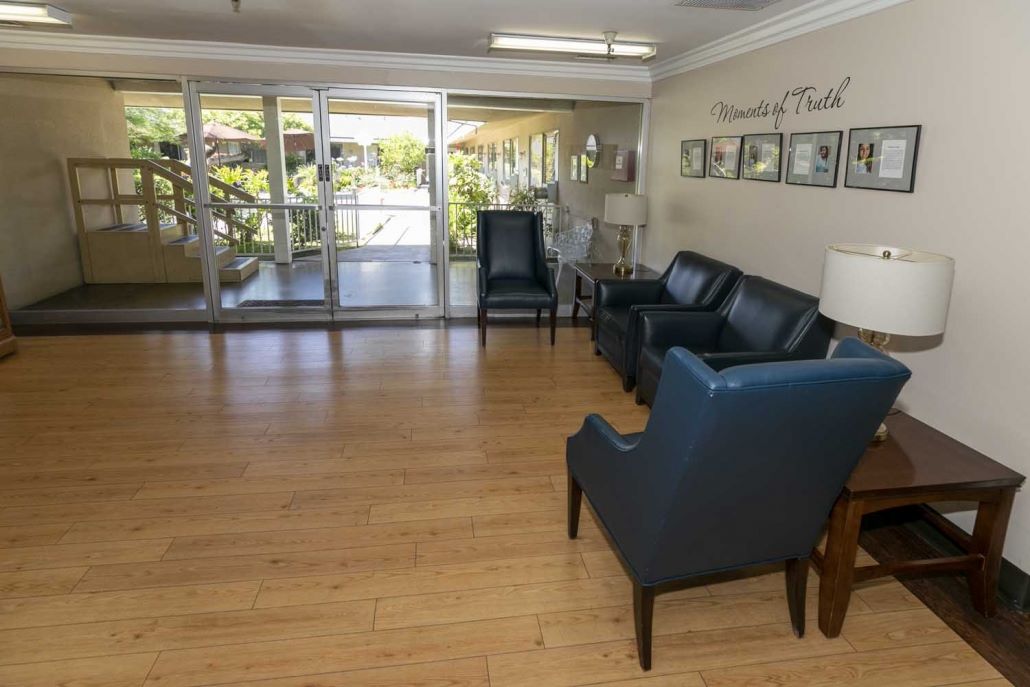
The state-of-the-art in-house therapy at Claremont Care Center utilizes modern techniques and hands-on approaches for tailored short and long-term rehabilitation. With a commitment to ensuring guests feel valued and cared for, the facility provides a range of activities and excursions to keep residents active and engaged. The monthly activity calendar offers diverse options, fostering a vibrant and fulfilling lifestyle for all individuals at Claremont Care Center.
 Official CMS rating based on health inspections, staffing and quality measures.
Official CMS rating based on deficiencies found during state health inspections.
Official CMS rating based on nurse staffing hours per resident per day.
Official CMS rating based on clinical outcomes for residents.
Average daily nursing hours per resident (adjusted for acuity). Higher values indicate more nursing time per resident.
Hours of care per resident per day, broken down by staff type. Data from CMS Medicare.
Registered nurse hours per resident per day.
Licensed Practical Nurse / Licensed Vocational Nurse hours per resident per day.
Nurse aide hours per resident per day.
Total number of nurse staff hours per resident per day on weekends.
Physical therapist staff hours per resident per day.
Registered nurse hours per resident per day on weekends.
Official CMS rating based on health inspections, staffing and quality measures.
Official CMS rating based on deficiencies found during state health inspections.
Official CMS rating based on nurse staffing hours per resident per day.
Official CMS rating based on clinical outcomes for residents.
Average daily nursing hours per resident (adjusted for acuity). Higher values indicate more nursing time per resident.
Hours of care per resident per day, broken down by staff type. Data from CMS Medicare.
Registered nurse hours per resident per day.
Licensed Practical Nurse / Licensed Vocational Nurse hours per resident per day.
Nurse aide hours per resident per day.
Total number of nurse staff hours per resident per day on weekends.
Physical therapist staff hours per resident per day.
Registered nurse hours per resident per day on weekends.
May offer a more intimate, personalized care environment.
Occupancy is moderate, suggesting balanced demand.
Residents typically stay for brief periods, with frequent admissions and discharges throughout the year.
29% of new residents, usually for short-term rehab.
65% of new residents, often for short stays.
6% of new residents, often for long-term daily care.
The portion of the home's budget spent on staff, including nurses, caregivers, and other employees who support care and operations.
All remaining costs needed to run the home, such as food, utilities, building maintenance, supplies and administrative expenses.
Nursing Homes 24/7 care needed
Nursing Homes 24/7 care needed
Nursing Homes 24/7 care needed
Nursing Homes 24/7 care needed
Nursing Homes 24/7 care needed
Claremont Care Center 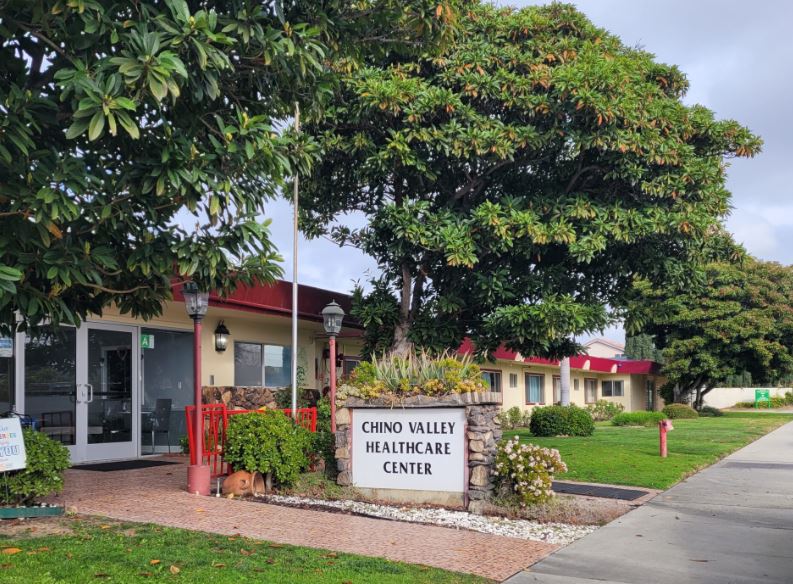 Chino Valley Healthcare Center
 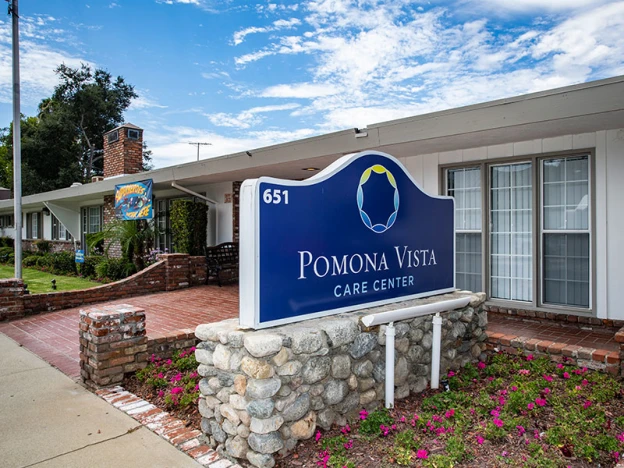 Pomona Vista Care Center
 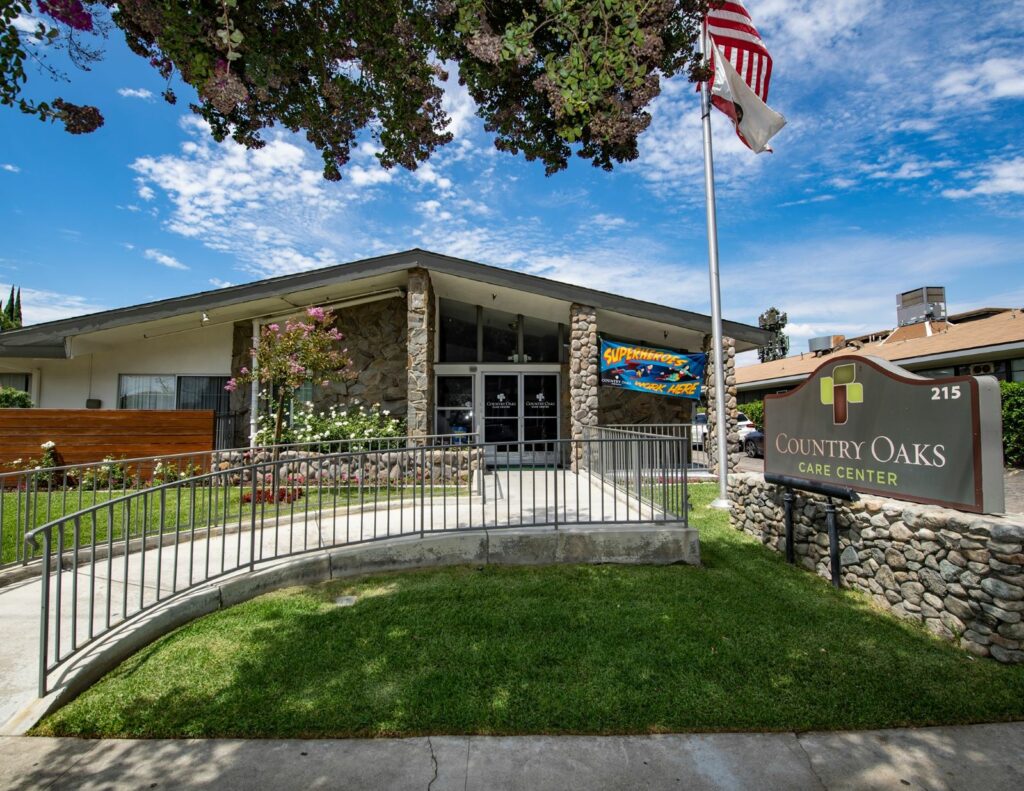 Country Oaks Care Center
 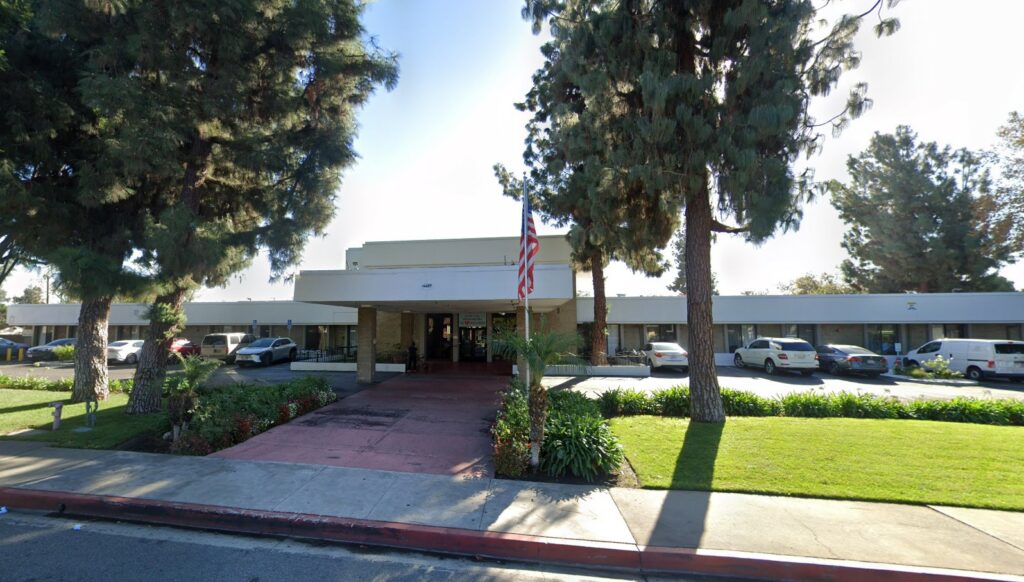 Park Avenue Healthcare & Wellness Centre
![]() 3.9 miles from city center — 0.69 miles to nearest hospital (Casa Colina Hospital and Centers for Healthcare)
3.9 miles from city center — 0.69 miles to nearest hospital (Casa Colina Hospital and Centers for Healthcare)
![]() 219 E Foothill Blvd, Pomona, CA 91768
219 E Foothill Blvd, Pomona, CA 91768
Add your location
Source: CMS Payroll-Based Journal (Q2 2025)
| Role ⓘ | Count ⓘ | Avg Shift (hrs) ⓘ | Uses Contractors? ⓘ |
|---|---|---|---|
| Registered Nurse | 10 | 8.3 | No |
| Licensed Practical Nurse | 51 | 7.7 | Yes |
| Certified Nursing Assistant | 75 | 7.2 | Yes |
| Role ⓘ | Employees ⓘ | Contractors ⓘ | Total Staff ⓘ | Total Hours ⓘ | Days Worked ⓘ | % of Days ⓘ | Avg Shift (hrs) ⓘ |
|---|---|---|---|---|---|---|---|
| Certified Nursing Assistant | 67 | 8 | 75 | 19,719 | 91 | 100% | 7.2 |
| Licensed Practical Nurse | 30 | 21 | 51 | 8,345 | 91 | 100% | 7.7 |
| Dental Services Staff | 10 | 0 | 10 | 3,905 | 91 | 100% | 7.7 |
| Registered Nurse | 10 | 0 | 10 | 2,394 | 91 | 100% | 8.3 |
| Physical Therapy Assistant | 6 | 0 | 6 | 1,762 | 77 | 85% | 7.4 |
| Respiratory Therapy Technician | 5 | 0 | 5 | 1,126 | 85 | 93% | 6.9 |
| Speech Language Pathologist | 6 | 0 | 6 | 1,094 | 88 | 97% | 5.8 |
| Physical Therapy Aide | 6 | 0 | 6 | 904 | 87 | 96% | 5.8 |
| Nurse Practitioner | 1 | 0 | 1 | 569 | 65 | 71% | 8.8 |
| Administrator | 1 | 0 | 1 | 520 | 65 | 71% | 8 |
| Therapeutic Recreation Specialist | 3 | 0 | 3 | 498 | 64 | 70% | 7.6 |
| Other Dietary Services Staff | 2 | 0 | 2 | 471 | 58 | 64% | 7.7 |
| Dietitian | 1 | 0 | 1 | 446 | 58 | 64% | 7.7 |
| Qualified Social Worker | 1 | 0 | 1 | 393 | 62 | 68% | 6.3 |
| Occupational Therapy Aide | 0 | 1 | 1 | 285 | 42 | 46% | 6.8 |
| RN Director of Nursing | 2 | 0 | 2 | 226 | 33 | 36% | 6.8 |
| Medication Aide/Technician | 0 | 4 | 4 | 96 | 22 | 24% | 2.9 |
| Medical Director | 0 | 2 | 2 | 24 | 7 | 8% | 3 |
| Occupational Therapy Assistant | 0 | 1 | 1 | 24 | 3 | 3% | 8 |
| Feeding Assistant | 0 | 1 | 1 | 8 | 2 | 2% | 4 |
California average 12.5
Last Health inspection on Aug 2025
Health citations are formal notices following inspections when they fail to comply with safety and care standards.
40 of 50 citations resulted from standard inspections; and 10 of 50 resulted from complaint investigations.
California average: 0.4
California average: 1
Data sourced from CMS Health Deficiencies reports. Citation severity codes range from A (least serious) to L (most serious). Immediate Jeopardy (J-L) citations indicate situations where the facility's noncompliance has placed residents at risk of death or serious harm.
Source: CMS Long-Term Care Facility Characteristics (Data as of Jan 2026)
Active councils help families stay involved in care decisions and facility operations.
These measures show how residents usually do over time at this home, based on health outcomes and preventive care.
California average: 6.6
California average: 11.3
California average: 11.1%
California average: 12.0%
California average: 11.3%
California average: 1.7%
California average: 5.0%
California average: 1.2%
California average: 4.2%
California average: 6.7%
California average: 10.1%
California average: 98.5%
California average: 98.2%
California average: 2.25
California average: 1.59
California average: 94.0%
California average: 1.5%
California average: 93.2%
California average: 23.2%
California average: 11.2%
California average: 0.8%
California average: 53.7%
California average: 50.6%
Quality measures are calculated from Minimum Data Set (MDS) assessments. For most measures, lower percentages indicate better care quality.
Historical financial and operational data for Claremont Care Center based on CMS SNF Cost Reports.
Loading trend charts...
Care Cost Calculator: See Prices in Your Area
Nursing Home Data Explorer
Don’t Wait Too Long: 7 Red Flag Signs Your Parent Needs Assisted Living Now
The True Cost of Assisted Living in 2025 – And How Families Are Paying For It
Understanding Senior Living Costs: Pricing Models, Discounts & Financial Assistance

We help families find affordable senior communities and unlock same day discounts, Medicaid, and Medicare options tailored to your needs.
Contact us Today
Touring a community? Use this expert-backed checklist to stay organized, ask the right questions, and find the perfect fit.
We'll send you a PDF version of the touring checklist.


