Park Avenue Healthcare & Wellness Centre
Nursing Home & Skilled Nursing · Pomona, CA
CMS overall rating Info The Overall CMS Rating is scored from 1 to 5 stars and combines results from health inspections, staffing levels, and quality measures. Health inspections carry the most weight. Staffing and quality scores can increase or decrease the final rating based on performance compared to state and national standards.

Park Avenue Healthcare & Wellness Centre

Nursing Home & Skilled Nursing · Pomona, CA
CMS overall rating Info The Overall CMS Rating is scored from 1 to 5 stars and combines results from health inspections, staffing levels, and quality measures. Health inspections carry the most weight. Staffing and quality scores can increase or decrease the final rating based on performance compared to state and national standards.
Calculator: See prices in your area
Park Avenue Healthcare & Wellness Centre accepts Medicare, Medicaid, and private pay.

Overview of Park Avenue Healthcare & Wellness Centre

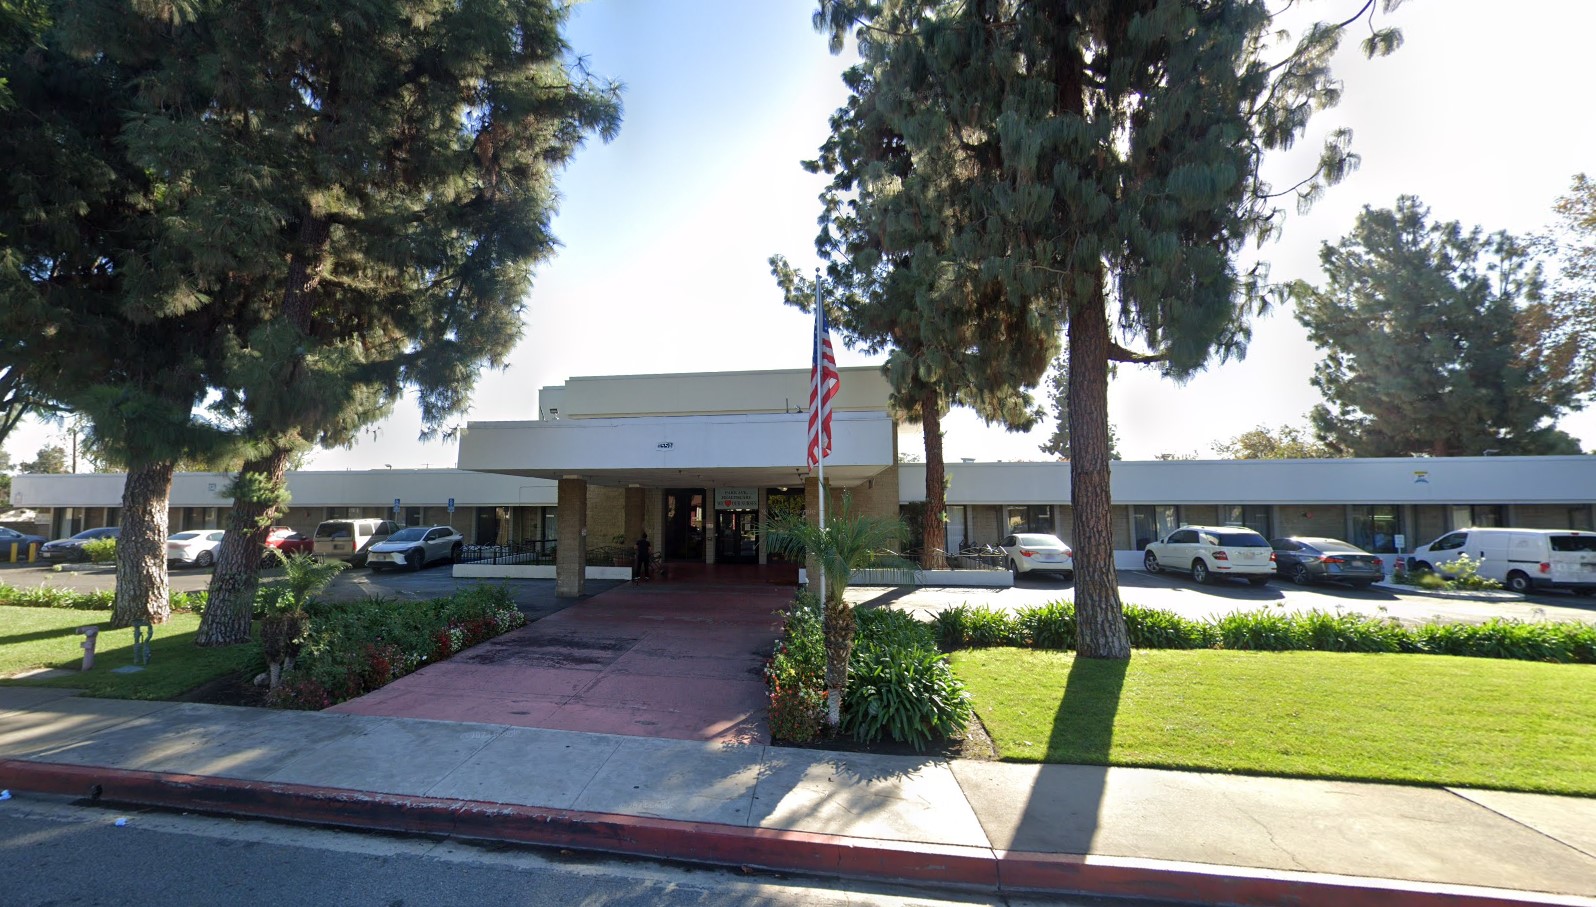
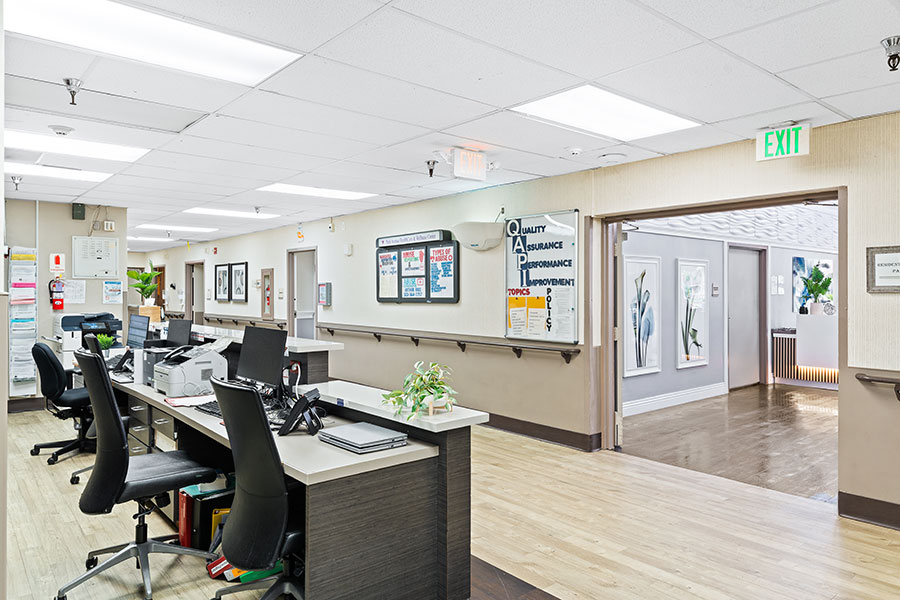
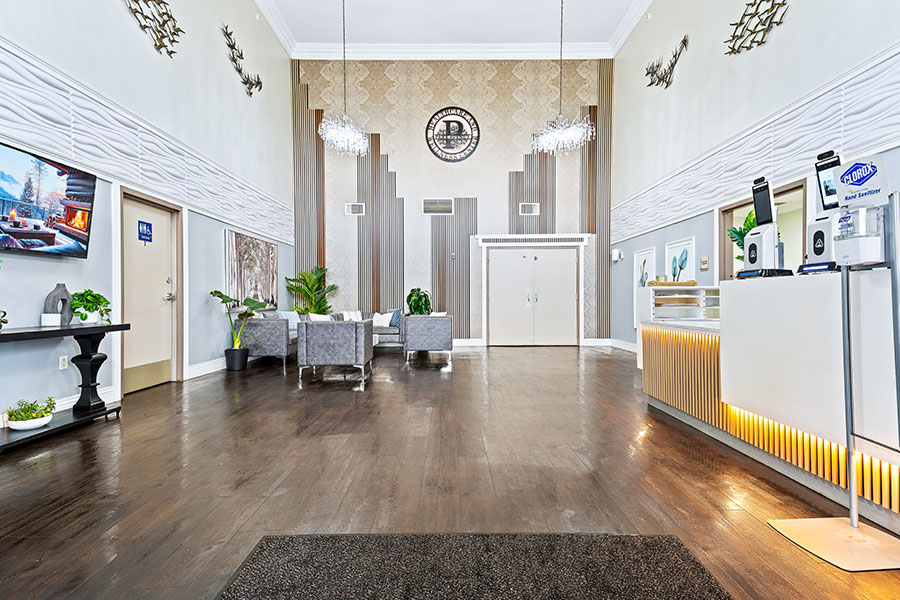
Park Avenue Healthcare & Wellness Center is a large healthcare facility located in Pomona, CA, dedicated to providing quality skilled nursing services to their residents. Their team of specialists including licensed nurses, therapists, social workers and activities coordinators works together to create comprehensive, individualized treatment plans intended to restore the residents to the fullest potential.

The residents of Park Avenue Healthcare & Wellness Center also offer a variety of therapy options. Physical therapy helps reduce pain and fall risk through stretches and gait training. Occupational therapy helps improve daily functionability, and speech therapy helps improve or retain speaking ability after an injury or illness.

Quality ratings

Measured by Centers for Medicare & Medicaid Services (CMS)

Overall rating Info The Overall CMS Rating combines results from health inspections, staffing levels and quality measures. Health inspections carry the most weight. Staffing and quality scores can increase or decrease the final rating based on performance compared to state and national standards.
▼ 72.2% Below CA avg. ▼ 72.2% Below CA avg.Click the badge to see the full State ranking.Click here to see the full State ranking.
Health Inspection Info Based on the results of the facility's three most recent standard inspections and any complaint investigations. CMS reviews the number, scope, and severity of deficiencies, with more recent findings weighted more heavily.
▼ 68.3% Below CA avg. ▼ 68.3% Below CA avg.Click the badge to see the full State ranking.Click here to see the full State ranking.
Staffing Info Measures average nursing staff hours per resident per day, including Registered Nurses (RNs) and total nursing staff. Ratings are adjusted based on the level of care residents require and are compared to state and national benchmarks.
▼ 13.0% Below CA avg. ▼ 13.0% Below CA avg.Click the badge to see the full State ranking.Click here to see the full State ranking.

Staffing hours breakdown

Info Daily nursing hours per resident by staff type, reported to CMS. Higher is generally better — compare this facility to state and national averages to see where staffing stands.

Hours per resident per day — compared to California state averages

Total nursing care / resident Info This home is ranked 263rd out of 346 homes in California. Total adjusted nursing hours per resident per day, combining RN, LPN, and aide time. CMS adjusts this for case-mix so facilities can be fairly compared.
3h 37m per day
Rank #263 / 346Nurse hours — State benchmarkedThis home is ranked 263rd out of 346 homes in California. Shows adjusted nurse hours per resident per day benchmarked to the California average, with a ranking across 346 California SNFs. More hours mean more direct care. The national average is about 3.5 hrs; below 3.0 is a red flag.Click the rank badge to see the full State ranking.Click here to see the full State ranking.
This facility California avg (4h 23m per day)
vs California avg
-17%

4 of 6 metrics below state avg

Staff typeHours / Day / Residentvs state avg
Registered Nurse (RN) Info RNs hold the highest nursing license and can assess residents, interpret test results, and direct care plans. More RN hours per day often signals stronger clinical oversight and faster response to health changes. 30m per day ▼ 23% State avg: 39m per day · National avg: 41m per day
LPN / LVN Info Licensed Practical Nurses (LPNs) or Licensed Vocational Nurses (LVNs) deliver routine hands-on care — medication administration, wound dressing, and monitoring vital signs. They work under RN supervision and make up a large share of daily bedside care. 1h 12m per day ■ Avg State avg: 1h 13m per day · National avg: 52m per day
Nurse Aide Info Certified Nurse Aides (CNAs) provide the most direct day-to-day assistance: bathing, dressing, feeding, and mobility. Nurse aide hours are typically the largest staffing category and directly affect residents' quality of life. 2h 33m per day ▼ 4% State avg: 2h 39m per day · National avg: 2h 21m per day
Weekend Total Nursing Info Combined nursing hours (RN + LPN + Nurse Aide) per resident per day on weekends. Staffing often drops on weekends — this figure reveals whether the facility maintains adequate coverage outside of weekday hours. 3h 56m per day ▼ 4% State avg: 4h 5m per day · National avg: 3h 26m per day
Physical Therapist Info Hours per resident per day provided by licensed Physical Therapists (PTs) or PT Assistants. PT services help residents recover mobility after injury or illness and are especially important for post-acute (short-stay) rehabilitation. 5m per day ■ Avg State avg: 5m per day · National avg: 4m per day
Weekend RN Info Registered nurse hours specifically on weekends. Facilities sometimes reduce RN presence on Saturdays and Sundays — a low weekend RN figure compared to weekday hours can indicate reduced clinical oversight when most administrative staff are absent. 26m per day ▼ 13% State avg: 30m per day · National avg: 29m per day

Types of Care at Park Avenue Healthcare & Wellness Centre

Skilled Nursing

Capacity and availability

This home usually has limited availability

Occupancy between 85% and 95% suggests balanced demand.

Higher occupancy than the California average: 84.7%
Occupancy rate 93.5% Rank #214 / 1407Occupancy rate — State benchmarkedThis home is ranked 214th out of 1407 homes in California. Shows this facility's occupancy rate versus the California average, with its Statewide rank out of 1407. Higher occupancy signals strong local demand and financial stability.Click the rank badge to see the full State ranking.Click here to see the full State ranking.
Avg. Length of Stay 318 days
Occupancy rate
93.5% Rank #214 / 1407Occupancy rate — State benchmarkedThis home is ranked 214th out of 1407 homes in California. Shows this facility's occupancy rate versus the California average, with its Statewide rank out of 1407. Higher occupancy signals strong local demand and financial stability.Click the rank badge to see the full State ranking.Click here to see the full State ranking.
Avg. Length of Stay
318 days
Walk Score
Walk Score: 73 / 100 Rank #643 / 2096Walk Score — State benchmarkedThis home is ranked 643rd out of 2096 homes in California. Shows how walkable this facility's neighborhood is compared to the average Walk Score across California SNFs. Higher scores benefit residents, families, and staff.Click the rank badge to see the full State ranking.Click here to see the full State ranking.
Very walkable. Most errands can be accomplished on foot, and many essentials are within a short walk.
BBB Rating
BBB Rating: A+ (Not Accredited)
An independent rating from the Better Business Bureau based on factors such as complaint history, transparency, and business practices.
How BBB ratings work

About this community

License Details

CMS Certification Number555852

Therapy & Rehabilitation

1 service
Rehabilitation Services

Staffing & Medical

1 service
24-Hour Staffing

Memory & Specialized Care

1 service
No Alzheimer's certification

Additional Services

1 service
Short-Term Rehabilitation

Contact Park Avenue Healthcare & Wellness Centre

Inspection History

In California, the Department of Social Services (for assisted living facilities) and the Department of Public Health (for nursing homes) conduct inspections to ensure resident safety and regulatory compliance.

Since 2021 · 5 years of data 167 citations 0 complaint visits

Inspection Scorecard Info This scorecard compares key inspection, citation, and complaint metrics at this facility against the California state average. Metrics rated ≥15% worse than average are highlighted in red; those ≥15% better are highlighted in green.

Since 2021 vs. California state average
Overall vs. CA average 2 Worse Metrics worse than California average:
• Total citations (1570% above)
• Citations per year (1570% above)
3 Better Metrics better than California average:
• Total visits (100% below)
• Complaint visits (100% below)
• Other visits (100% below)
Latest Inspection December 11, 2025 Plan Of Correction

Citations Info Citations are formal regulatory issues recorded during state inspections.

This FacilityCA Averagevs. CA Avg
Total citations Info Formal regulatory issues recorded by inspectors across all inspection types. 16710 This facility has 1570% more total citations than a typical California nursing home (167 vs. CA avg 10).↑ 1570% worse
Citations per year Info Average citations per year since 2021. 33.42 This facility has 1570% more citations per year than a typical California nursing home (33.4 vs. CA avg 2).↑ 1570% worse

Inspections & Visits Info State inspections evaluate whether the facility meets health and safety standards.

This FacilityCA Averagevs. CA Avg
Total visits Info Combined count of complaint visits, other regulatory visits, and official scheduled inspections. 016 This facility has 100% fewer total visits than a typical California nursing home (0 vs. CA avg 16).↓ 100% better
Complaint visits Info On-site visits triggered by formal complaints filed by residents, families, or staff. 013 This facility has 100% fewer complaint visits than a typical California nursing home (0 vs. CA avg 13).↓ 100% better
Other visits Info Regulatory visits that are neither routine inspections nor complaint investigations — administrative check-ins, follow-up reviews, licensing-related visits. 07 This facility has 100% fewer other visits than a typical California nursing home (0 vs. CA avg 7).↓ 100% better

Inspection Reports Summary Info An editor-reviewed summary of the themes and findings across this facility's recent inspection reports.

Park Avenue Healthcare & Wellness Center’s inspection record is mixed, showing persistent issues with care planning, resident safety, abuse prevention, and documentation despite some improvements. The most recent inspection on December 11, 2025, cited one deficiency for incomplete meal intake documentation, while prior surveys found multiple deficiencies related to unsafe environments, delayed medical orders, and failure to prevent resident-to-resident abuse, with several substantiated complaints. Deficiencies have involved care plan implementation, call light response, infection control, and failure to timely report abuse, indicating ongoing challenges in resident care and safety.

Read the full inspection reports for this facility, including detailed findings and corrective actions.

Show Inspection Reports

Health Inspection History

Inspections since 2024
Total health inspections 40

California average 12.5


Last Health inspection on Jul 2025

Total health citations
154 Rank #352 / 354Health citations — State benchmarkedThis home is ranked 352nd out of 354 homes in California. Shows this facility's total health deficiency citations benchmarked to the California State average, with a ranking across all 354 CA SNFs. Lower citation counts earn a better rank.Click the rank badge to see the full State ranking.Click here to see the full State ranking.

California average 50.2

Citations per inspection
3.85 Rank #155 / 354Citations per inspection — State benchmarkedThis home is ranked 155th out of 354 homes in California. Shows average deficiency citations per CMS inspection for this facility versus the California mean across 354 SNFs with citation data. Lower is better.Click the rank badge to see the full State ranking.Click here to see the full State ranking.

California average 4.65


Health citations are formal notices following inspections when they fail to comply with safety and care standards.

61 of 154 citations resulted from standard inspections; and 93 of 154 resulted from complaint investigations.

Breakdown of citation severity (last 2 years)
Critical health citations
1
150% worse than California average

California average: 0.4


Serious health citations
3
200% worse than California average

California average: 1

1 critical citation California average: 0.4

3 serious citations California average: 1

150 moderate citations California average: 47.2

0 minor citations California average: 1.5
Citations history (last 2 years)
Environmental moderate citation Jul 25, 2025
Corrected

Environmental moderate citation Jul 25, 2025
Corrected

Infection Control moderate citation Jul 25, 2025
Corrected

Nursing Services moderate citation Jul 25, 2025
Corrected

Staffing Data

Reporting period: July 1 – September 30, 2025 (Q3 2025). Source: CMS Payroll-Based Journal report.

Total staff 274
Employees 271
Contractors 3
Staff to resident ratio 1.28:1
29% worse than California average
California average ratio: 1.81:1 California average ratio: 1.81:1See full California ranking
Avg staff/day 140
Average shift 8.1 hours
5% better than California average
California average: 7.7 hours California average shift: 7.7 hoursSee full California ranking
Total staff hours (quarter) 103,739

Nursing staff breakdown

Q3 2025 · Jul 1 – Sep 30 More info This data comes from the CMS Payroll-Based Journal report covering July 1 – September 30, 2025.
Registered Nurse

Manages medical care and health needs.

RN Staff 21
Average shift length Info Average shift length. Calculated as total hours divided by days worked and average staff per day. 8.5 hours

No contractors work on this role.

Licensed Practical Nurse

Assists with medical care and medications.

LPN Staff 65
Average shift length Info Average shift length. Calculated as total hours divided by days worked and average staff per day. 8.5 hours

This role is partially covered by contractors.

Certified Nursing Assistant

Helps with daily care and mobility.

CNA Staff 122
Average shift length Info Average shift length. Calculated as total hours divided by days worked and average staff per day. 8.2 hours

This role is partially covered by contractors.

Contractor staffing

Q3 2025 · Jul 1 – Sep 30 More info This data comes from the CMS Payroll-Based Journal report covering July 1 – September 30, 2025.

Total hours from contractors

0%

23 contractor hours this quarter

Licensed Practical Nurse: 2 Certified Nursing Assistant: 1

Staff by category

Q3 2025 · Jul 1 – Sep 30 More info This data comes from the CMS Payroll-Based Journal report covering July 1 – September 30, 2025.
Certified Nursing Assistant121112249,85692100%8.2
Licensed Practical Nurse6326521,47192100%8.5
Registered Nurse210217,96592100%8.5
Other Dietary Services Staff110115,12192100%7.7
Physical Therapy Aide8082,8429199%6.7
Qualified Activities Professional7072,78692100%8.5
Speech Language Pathologist6062,3879199%7.2
RN Director of Nursing6062,0127480%8.1
Physical Therapy Assistant5051,58792100%6.6
Respiratory Therapy Technician6061,5238592%6.6
Clinical Nurse Specialist4041,2768997%7.5
Dental Services Staff3031,2478896%8
Occupational Therapy Aide2026997480%8
Qualified Social Worker3036328289%5.8
Administrator1015126470%8
Nurse Practitioner1014966267%8
Therapeutic Recreation Specialist1014656065%7.8
Mental Health Service Worker1014465155%8.7
Dietitian1014154953%8.5
122 Certified Nursing Assistant
% of Days 100%
65 Licensed Practical Nurse
% of Days 100%
21 Registered Nurse
% of Days 100%
11 Other Dietary Services Staff
% of Days 100%
8 Physical Therapy Aide
% of Days 99%
7 Qualified Activities Professional
% of Days 100%
6 Speech Language Pathologist
% of Days 99%
6 RN Director of Nursing
% of Days 80%
5 Physical Therapy Assistant
% of Days 100%
6 Respiratory Therapy Technician
% of Days 92%
4 Clinical Nurse Specialist
% of Days 97%
3 Dental Services Staff
% of Days 96%
2 Occupational Therapy Aide
% of Days 80%
3 Qualified Social Worker
% of Days 89%
1 Administrator
% of Days 70%
1 Nurse Practitioner
% of Days 67%
1 Therapeutic Recreation Specialist
% of Days 65%
1 Mental Health Service Worker
% of Days 55%
1 Dietitian
% of Days 53%

Penalties and fines

Includes penalties issued in 2023-2025

Federal penalties imposed by CMS for regulatory violations, including civil money penalties (fines) and denials of payment for new Medicare/Medicaid admissions.

Source: CMS Penalties Database (Data as of Jan 2026)

Total fines amount $167K Rank #352 / 354Federal fines — State benchmarkedThis home is ranked 352nd out of 354 homes in California. Shows this facility's cumulative CMS federal fine dollars versus the California average among facilities with fines, and where it ranks among 354 skilled nursing facilities in the pool. Lower total dollars mean a better rank.Click the rank badge to see the full State ranking.Click here to see the full State ranking.
205% higher than California average

California average: $55K

Number of fines 5
112% more fines than California average

California average: 2.4

Payment Denials Info Serious action where Medicare and/or Medicaid temporarily stops payments for new residents until issues are fixed. 0
100% fewer payment denials than California average

California average: 0.5

Fines amount comparison
This facility $167K
California average $55K
Penalty History

Penalties are imposed by CMS for violations of federal nursing home regulations.

4 penalties in the past 3 years

Multiple penalties were reported in the last 3 years.

Civil Money Penalty Info Fines imposed for noncompliance, which can be assessed per day or per instance of violation. Mar 28, 2025
$33K
Civil Money Penalty Info Fines imposed for noncompliance, which can be assessed per day or per instance of violation. Jan 16, 2025
$23K
Civil Money Penalty Info Fines imposed for noncompliance, which can be assessed per day or per instance of violation. Feb 7, 2024
$28K
Civil Money Penalty Info Fines imposed for noncompliance, which can be assessed per day or per instance of violation. Jul 19, 2023
$67K

Last updated: Jan 2026

Quality of care over time

These measures show how residents usually do over time at this home, based on health outcomes and preventive care.

High-risk clinical events score Info A composite score based on pressure ulcers, falls with injury, weight loss, walking ability decline, and activities of daily living decline. 7.6
14% worse than California average

California average: 6.6

Functional decline score Info A composite score based on activities of daily living decline, walking ability decline, and incontinence. 10.0
12% better than California average

California average: 11.3

Long-stay resident measures
Significantly below average California avg: 4.2 Info CMS star rating based on long-stay quality measure performance. 5 stars = significantly above average, 1 star = significantly below average.
Need for Help with Daily Activities Increased Info Percent of long-stay residents whose need for help with daily activities has increased 14.6%
32% worse than California average

California average: 11.1%

Walking Ability Worsened Info Percent of long-stay residents whose ability to move independently worsened 9.8%
19% better than California average

California average: 12.0%

Low Risk Residents with Bowel/Bladder Incontinence Info Percent of low risk long-stay residents who lose control of their bowels or bladder 5.7%
50% better than California average

California average: 11.3%

Falls with Major Injury Info Percent of long-stay residents experiencing one or more falls with major injury 1.9%
16% worse than California average

California average: 1.7%

High Risk Residents with Pressure Ulcers Info Percent of long-stay high risk residents with pressure ulcers 4.8%
In line with California average

California average: 5.0%

Urinary Tract Infection Info Percent of long-stay residents with a urinary tract infection 0.1%
90% better than California average

California average: 1.2%

Lost Too Much Weight Info Percent of long-stay residents who lose too much weight 6.8%
62% worse than California average

California average: 4.2%

Depressive Symptoms Info Percent of long-stay residents who have depressive symptoms 23.0%
244% worse than California average

California average: 6.7%

Pneumococcal Vaccine Info Percent of long-stay residents assessed and appropriately given the pneumococcal vaccine 98.8%
In line with California average

California average: 98.5%

Influenza Vaccine Info Percent of long-stay residents assessed and appropriately given the seasonal influenza vaccine 99.1%
In line with California average

California average: 98.2%

Hospitalizations per 1,000 days Info Number of hospitalizations per 1,000 long-stay resident days. 4.01
78% worse than California average

California average: 2.25

ED visits per 1,000 days Info Number of outpatient emergency department visits per 1,000 long-stay resident days. 2.04
28% worse than California average

California average: 1.59

Short-stay resident measures
Pneumococcal Vaccine Info Percent of short-stay residents assessed and appropriately given the pneumococcal vaccine 96.3%
In line with California average

California average: 94.0%

Antipsychotic medication increase Info Percent of short-stay residents who newly received an antipsychotic medication 7.9%
448% worse than California average

California average: 1.5%

Influenza Vaccine Info Percent of short-stay residents assessed and appropriately given the seasonal influenza vaccine 98.3%
5% better than California average

California average: 93.2%

Re-hospitalized after SNF stay Info Percentage of short-stay residents who were re-hospitalized after their nursing home admission. 20.5%
12% better than California average

California average: 23.2%

Emergency department visits Info Percentage of short-stay residents who had an outpatient emergency department visit. 7.1%
37% better than California average

California average: 11.2%

Falls with major injury Info Percentage of SNF residents who experience falls with major injury during their stay. 0.5%
30% better than California average

California average: 0.8%

Ability to care for self at discharge Info Percentage of residents at or above expected ability to care for themselves at discharge. 46.4%
14% worse than California average

California average: 53.7%

Successful return to home or community Info Rate of successful return to home or community from a skilled nursing facility. 54.1%
7% better than California average

California average: 50.6%

Breakdown by payment type

Medicare

47% of new residents, usually for short-term rehab.

Typical stay 1 - 2 months

Private pay

15% of new residents, often for short stays.

Typical stay 4 - 5 months

Medicaid

37% of new residents, often for long-term daily care.

Typical stay 2 years

Facility Characteristics

Source: CMS Long-Term Care Facility Characteristics (Data as of Jan 2026)

Total residents 214
Medicare
51
23.8% of residents
Medicaid
13
6.1% of residents
Private pay or other
150
70.1% of residents
Programs & Services
Residents Group

Residents meet regularly to discuss policies, care quality, and activities

Active Resident Council

Organized group of residents that meets regularly to discuss facility policies, quality of life, and activities.

Finances and operations

Privately-owned community
Home revenue
$44.6M
Operating loss
-$1.9M
Privately-owned community
Home revenue
$44.6M Rank #17 / 347Revenue — State benchmarkedThis home is ranked 17th out of 347 homes in California. Shows this facility's annual revenue compared to the California SNF average. Higher revenue generally means more resources for staffing and capital — read alongside Payroll %.Click the rank badge to see the full State ranking.Click here to see the full State ranking.
Operating loss
-$1.9M
Payroll costs Info The portion of the home's budget spent on staff, including nurses, caregivers, and other employees who support care and operations. Rank #11 / 347Payroll — State benchmarkedThis home is ranked 11th out of 347 homes in California. Shows total annual staff payroll benchmarked to the California average. Higher payroll investment relative to peers often signals better staffing and less reliance on cheaper contract labor.Click the rank badge to see the full State ranking.Click here to see the full State ranking.
$18.8M
42.2% of revenue Rank #246 / 347Payroll % — State benchmarkedThis home is ranked 246th out of 347 homes in California. Shows payroll as a percentage of revenue versus the California average. Well-run California SNFs typically land around 56–67% — the top third Statewide. Below 25% may signal understaffing or heavy agency use — read with Staffing ratings.Click the rank badge to see the full State ranking.Click here to see the full State ranking.
Other operating costs Info All remaining costs needed to run the home, such as food, utilities, building maintenance, supplies and administrative expenses.
$27.7M
Total costs $46.6M

Who this home usually serves

TYPE OF STAY

Mostly short-term rehab stays

Most residents typically stay for a few weeks or months before returning home or moving on.

Places of interest near Park Avenue Healthcare & Wellness Centre

Address 1.6 miles from city center Info Estimated distance in miles from Pomona's city center to Park Avenue Healthcare & Wellness Centre's address, calculated via Google Maps. — 0.29 miles to nearest hospital (Pomona Valley Hospital Medical Center)

Calculate Travel Distance to Park Avenue Healthcare & Wellness Centre

Add your location

Address

Financial Assistance for
Nursing Home in California

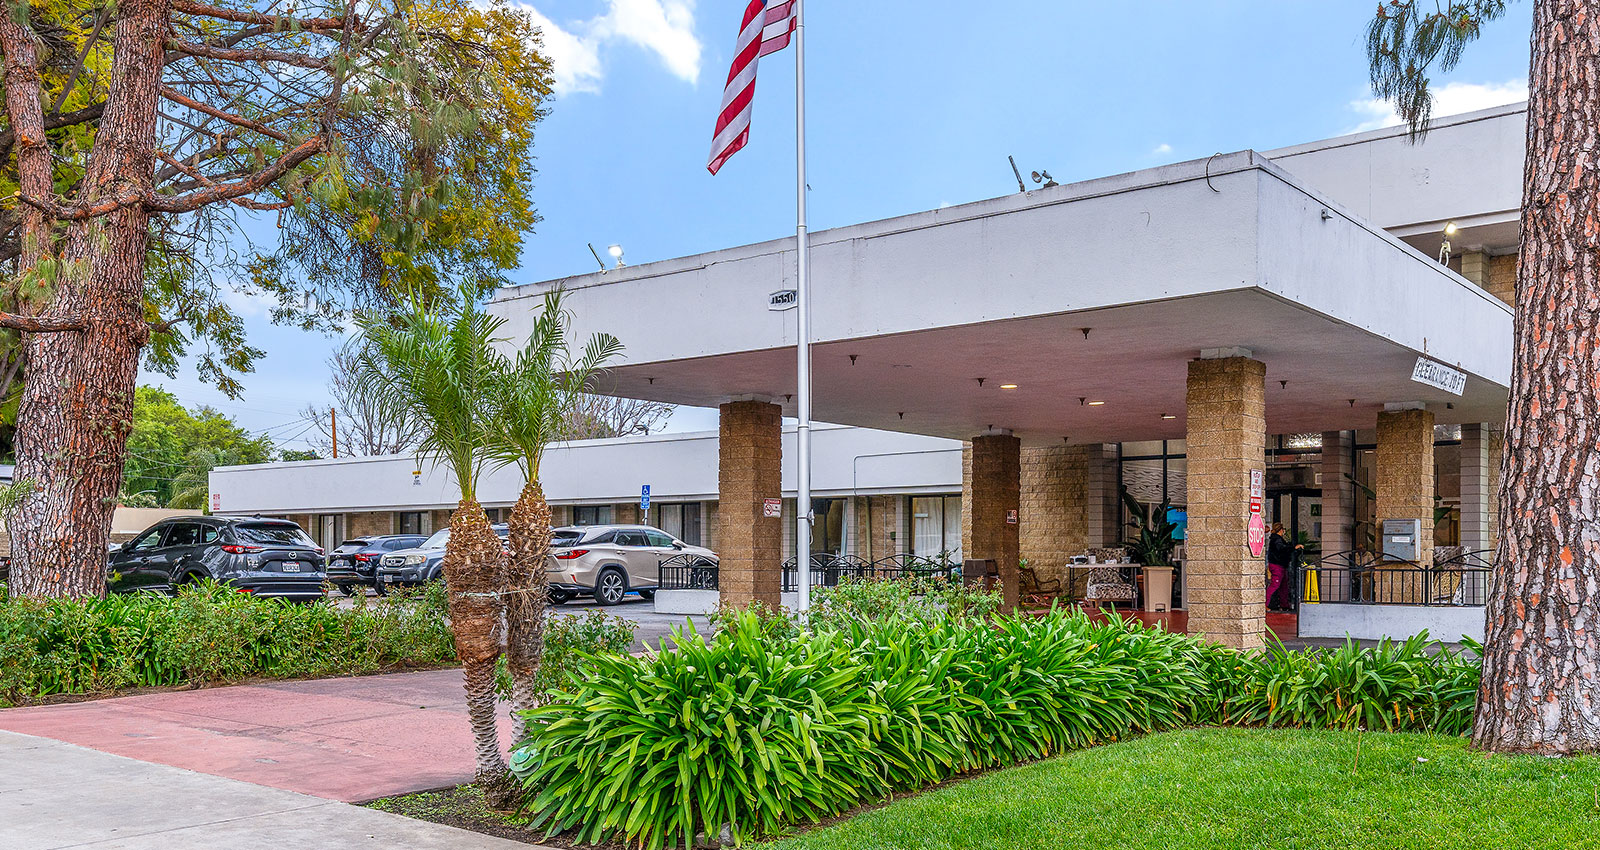
Park Avenue Healthcare & Wellness Centre is located in Pomona, California.
Here are the financial assistance programs available to residents in California.

Get Financial aid guidance

Multipurpose Senior Services Program

MSSP (Medi-Cal Waiver)

Age 65+
General California resident, Medi-Cal eligible, nursing home risk.
Income Limits (2025) ~$2,829/month 300% FBR, individual
Asset Limits $2,000 (individual), $3,000 (couple).
CA

County-managed; waitlists possible.

Benefits
In-home support (4-6 hours/day) Respite care (14 days/year) Meals (~$6/meal) Transportation (8 trips/month) Care management

In-Home Supportive Services (IHSS)

California IHSS

Age 65+
General California resident, Medicaid-eligible or low-income.
Income Limits ~$1,732/month individual, Medi-Cal threshold
Asset Limits $2,000 individual
CA

Can hire family as caregivers.

Benefits
Personal care (up to 283 hours/month) Homemaker services Respite (varies)

Multipurpose Senior Services Program (MSSP)

CA MSSP

Age 65+
General California resident, Medi-Cal-eligible, nursing home-eligible but community-capable.
Income Limits ~$2,829/month 300% FBR, individual
Asset Limits $2,000 individual
CA

Available in 38 counties; waitlists common.

Benefits
Case management Respite care (up to 10 days/year) Minor home mods (avg. $500) Adult day care (~$50/day)

Property Tax Postponement Program (PTP)

CA PTP

Age 62+
General California resident, own and live in home, 40% equity.
Income Limits (2025) ~$51,500/year household, adjusted annually
Asset Limits Equity-based; no strict asset cap.
CA

Deferred taxes accrue interest (5% as of 2024); repaid upon sale/death.

Benefits
Property tax deferral (avg. $1,000-$3,000/year, varies by county)

Assisted Living Waiver (ALW)

CA ALW

Age 65+ or disabled
General California resident, Medi-Cal-eligible, nursing home-eligible.
Income Limits ~$2,829/month 300% FBR, individual
Asset Limits $2,000 individual
CA

Available in 15 counties (e.g., LA, Sacramento); waitlists common.

Benefits
Personal care in ALFs (5-7 hours/day) Medication management Social services

California CARES Program

CA CARES

Age
General Caregivers of California residents 60+ needing help with 3+ daily activities; no caregiver age limit.
Income Limits No strict limit; cost-sharing above ~$2,500/month threshold.
Asset Limits Not applicable; need-based.
CA

High demand in urban areas; complements IHSS respite.

Benefits
Respite care (up to 10 days/year) Counseling (4-6 sessions/year) Training (2-3 workshops/year) Supplies (~$200/year)

Compare Nursing Home around Pomona

The information below is reported by the California Department of Social Services and Department of Public Health.

2 facilities compared · CMS & CA Dept. of Health data

Filter by care type
Claremont Care Center
NH

Nursing Home Licensed facility providing 24/7 skilled nursing care for residents with complex, ongoing medical needs. Staffed by RNs, LPNs, and CNAs. Inspected and star-rated annually by CMS. Accepts Medicare (short-term rehab) and Medicaid (long-term care).

Pomona (East Foothill Boulevard)99 85.9% +1%3.93 -23%-7%$0505.0-84- 72 Carla Arellano$15.9M$8.3M52.2%55394
Park Avenue Healthcare & Wellness Centre
NH

Nursing Home Licensed facility providing 24/7 skilled nursing care for residents with complex, ongoing medical needs. Staffed by RNs, LPNs, and CNAs. Inspected and star-rated annually by CMS. Accepts Medicare (short-term rehab) and Medicaid (long-term care).

Pomona231 93.5% +10%3.61 --14%-14%$175.8k1543.94216A+ 73 Pomona Nursing & Healthcare Centre, LLC$44.6M$18.8M42.2%555852

Frequently Asked Questions about Park Avenue Healthcare & Wellness Centre

Is Park Avenue Healthcare & Wellness Centre in a walkable area?

Park Avenue Healthcare & Wellness Centre has a walk score of 73. Very walkable. Most errands can be accomplished on foot, and many essentials are within a short walk.

Are there photos of Park Avenue Healthcare & Wellness Centre?

Yes — there are 15 photos of Park Avenue Healthcare & Wellness Centre in the photo gallery on this page.

What is the phone number of Park Avenue Healthcare & Wellness Centre?

(909) 623-0791 will put you in contact with the team at Park Avenue Healthcare & Wellness Centre.

Is Park Avenue Healthcare & Wellness Centre Medicare or Medicaid certified?

Yes — Park Avenue Healthcare & Wellness Centre is a CMS-certified provider of Medicare and Medicaid.

Guides for Better Senior Living

Care Cost Calculator: See Prices in Your Area

Nursing Home Data Explorer

Don’t Wait Too Long: 7 Red Flag Signs Your Parent Needs Assisted Living Now

The True Cost of Assisted Living in 2025 – And How Families Are Paying For It

Understanding Senior Living Costs: Pricing Models, Discounts & Financial Assistance

Explore Open Rooms
1 Contact details
2 What type of senior care service are you looking for?
3 What budget do you have in mind for senior care?
4 How soon do you need to find care?
5 Additional details

Thank you for your interest!

Our team will be in touch shortly to help with next steps.