Claremont Care Center
Nursing Home & Memory Care · Pomona, CA
CMS overall rating Info CMS (the Centers for Medicare & Medicaid Services) is the federal agency that rates nursing home quality. Its Overall Rating runs from 1 to 5 stars, combining health inspections, staffing, and quality measures, with inspections weighted most heavily.

Claremont Care Center

Nursing Home & Memory Care · Pomona, CA
CMS overall rating Info CMS (the Centers for Medicare & Medicaid Services) is the federal agency that rates nursing home quality. Its Overall Rating runs from 1 to 5 stars, combining health inspections, staffing, and quality measures, with inspections weighted most heavily.
Calculator: See prices in your area
Claremont Care Center accepts Medicare, Medicaid, and private pay.

Overview of Claremont Care Center

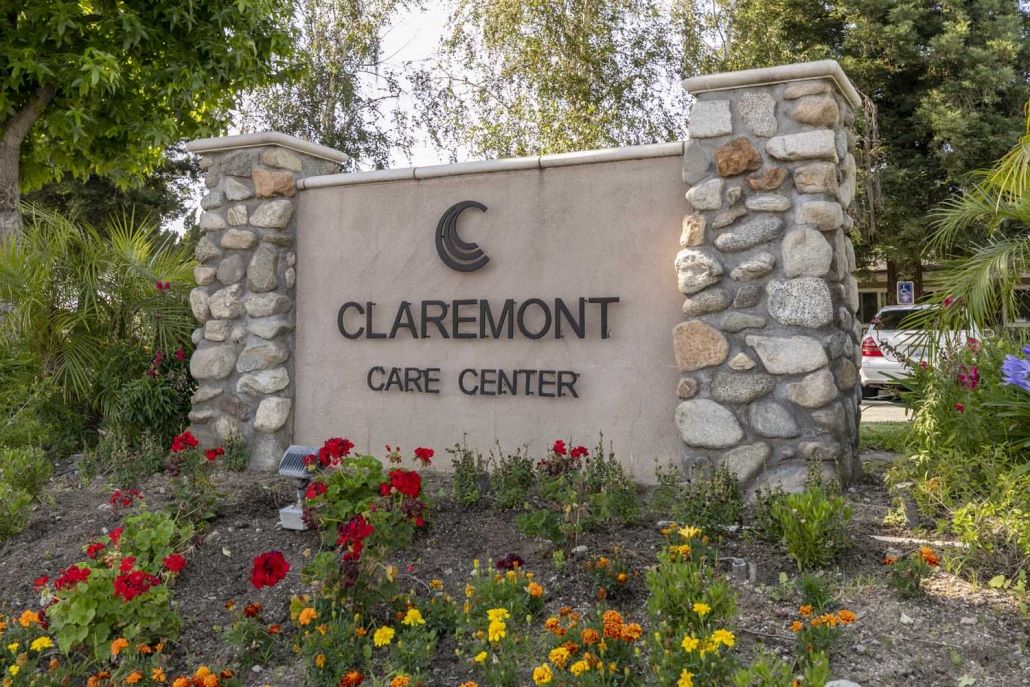
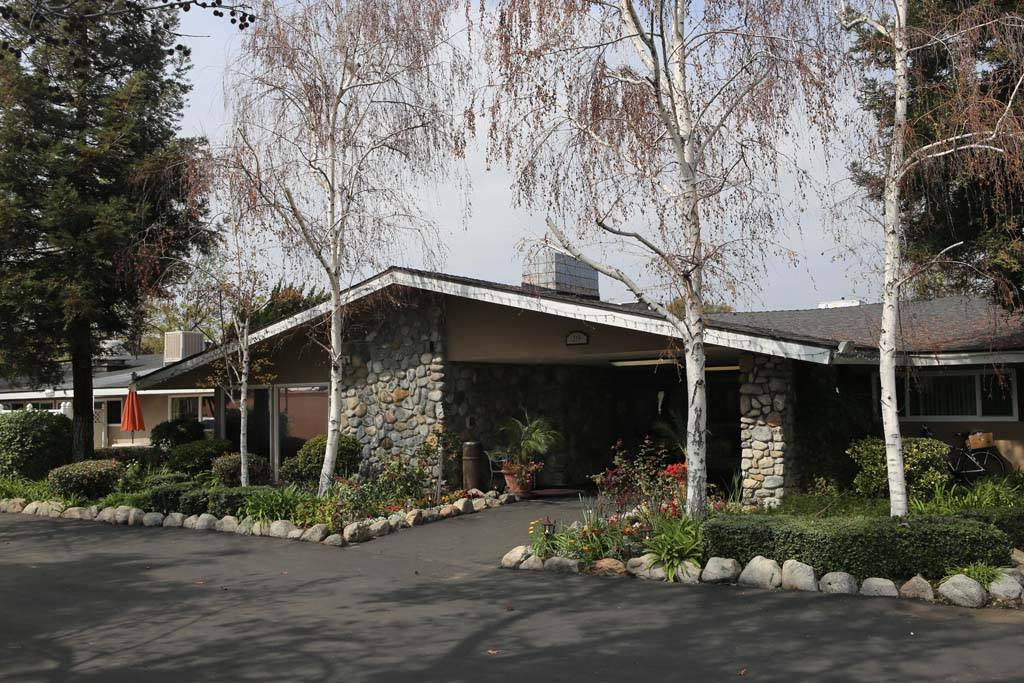
Claremont Care Center, Pomona, California’s premier location for nursing care, is committed to providing a welcoming environment where residents can regain strength, mobility, and a sense of home. The dedicated staff collaborates with individuals, families, and healthcare providers to develop personalized care and treatment plans. The facility prioritizes the art of caring, offering skilled nursing services with a focus on comfort, safety, and therapeutic support. Claremont Care Center’s vision is to be a center of excellence in the field of nursing homes. 

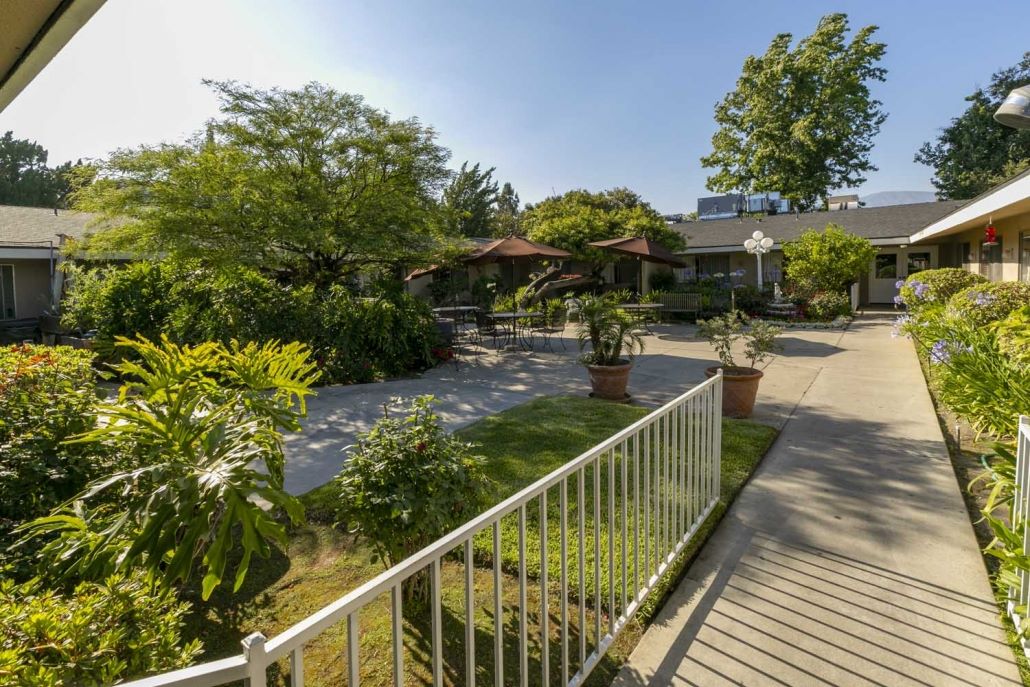
The state-of-the-art in-house therapy at Claremont Care Center utilizes modern techniques and hands-on approaches for tailored short and long-term rehabilitation. With a commitment to ensuring guests feel valued and cared for, the facility provides a range of activities and excursions to keep residents active and engaged. The monthly activity calendar offers diverse options, fostering a vibrant and fulfilling lifestyle for all individuals at Claremont Care Center.

Quality ratings

Measured by Centers for Medicare & Medicaid Services (CMS)

Overall rating Info The Overall CMS Rating combines results from health inspections, staffing levels and quality measures. Health inspections carry the most weight. Staffing and quality scores can increase or decrease the final rating based on performance compared to state and national standards.
▲ 27.0% Above CA avg. ▲ 27.0% Above CA avg.CA average: 3.1Click the badge to see the full State ranking.Click here to see the full State ranking.
Health Inspection Info Based on the results of the facility's three most recent standard inspections and any complaint investigations. CMS reviews the number, scope, and severity of deficiencies, with more recent findings weighted more heavily.
▲ 7.3% Above CA avg. ▲ 7.3% Above CA avg.CA average: 2.8Click the badge to see the full State ranking.Click here to see the full State ranking.
Staffing Info Measures average nursing staff hours per resident per day, including Registered Nurses (RNs) and total nursing staff. Ratings are adjusted based on the level of care residents require and are compared to state and national benchmarks.
▼ 4.4% Below CA avg. ▼ 4.4% Below CA avg.CA average: 3.1Click the badge to see the full State ranking.Click here to see the full State ranking.
Quality Measures Info Based on clinical and physical health indicators reported to CMS, such as hospital readmissions, falls, pressure ulcers, and improvements in mobility. These measures reflect how well residents' health needs are being managed.
▲ 22.4% Above CA avg. ▲ 22.4% Above CA avg.CA average: 4.1Click the badge to see the full State ranking.Click here to see the full State ranking.

Staffing hours breakdown

Info Daily nursing hours per resident by staff type, reported to CMS. Higher is generally better — compare this facility to state and national averages to see where staffing stands.

Hours per resident per day — compared to California state averages

Total nursing care / resident Info This home is ranked 206th out of 354 homes in California for nurse hours. Total adjusted nursing hours per resident per day, combining RN, LPN, and aide time. CMS adjusts this for case-mix so facilities can be fairly compared.
3h 56m per day
Rank #206 / 354Nurse hours — State benchmarkedThis home is ranked 206th out of 354 homes in California. Shows adjusted nurse hours per resident per day benchmarked to the California average, with a ranking across 354 California facilities. More hours mean more direct care. The national average is about 3.5 hrs; below 3.0 is a red flag.Rankings are based only on facilities in California that report data for that category. Facilities without available data are excluded from the ranking.Click the rank badge to see the full State ranking.Click here to see the full State ranking.
This facility California avg (4h 13m per day)
vs California avg
-7%

4 of 6 metrics below state avg

Standout metric Physical Therapist is +58% above state avg
Staff typeHours / Day / Residentvs state avg
Registered Nurse (RN) Info RNs hold the highest nursing license and can assess residents, interpret test results, and direct care plans. More RN hours per day often signals stronger clinical oversight and faster response to health changes. 21m per day ▼ 45% State avg: 39m per day · National avg: 41m per day
LPN / LVN Info Licensed Practical Nurses (LPNs) or Licensed Vocational Nurses (LVNs) deliver routine hands-on care — medication administration, wound dressing, and monitoring vital signs. They work under RN supervision and make up a large share of daily bedside care. 1h 15m per day ▲ 3% State avg: 1h 13m per day · National avg: 52m per day
Nurse Aide Info Certified Nurse Aides (CNAs) provide the most direct day-to-day assistance: bathing, dressing, feeding, and mobility. Nurse aide hours are typically the largest staffing category and directly affect residents' quality of life. 2h 31m per day ▼ 5% State avg: 2h 39m per day · National avg: 2h 21m per day
Weekend Total Nursing Info Combined nursing hours (RN + LPN + Nurse Aide) per resident per day on weekends. Staffing often drops on weekends — this figure reveals whether the facility maintains adequate coverage outside of weekday hours. 3h 40m per day ▼ 10% State avg: 4h 5m per day · National avg: 3h 26m per day
Physical Therapist Info Hours per resident per day provided by licensed Physical Therapists (PTs) or PT Assistants. PT services help residents recover mobility after injury or illness and are especially important for post-acute (short-stay) rehabilitation. 8m per day ▲ 58% State avg: 5m per day · National avg: 4m per day
Weekend RN Info Registered nurse hours specifically on weekends. Facilities sometimes reduce RN presence on Saturdays and Sundays — a low weekend RN figure compared to weekday hours can indicate reduced clinical oversight when most administrative staff are absent. 12m per day ▼ 59% State avg: 30m per day · National avg: 29m per day

Capacity and availability

This home usually has limited availability

Higher occupancy than the California average: 84.7%
Occupancy rate
85.9% Rank #437 / 1537Occupancy rate — State benchmarkedThis home is ranked 437th out of 1537 homes in California. Shows this facility's occupancy rate versus the California average, with its Statewide rank out of 1537. Higher occupancy signals strong local demand and financial stability.Rankings are based only on facilities in California that report data for that category. Facilities without available data are excluded from the ranking.Click the rank badge to see the full State ranking.Click here to see the full State ranking.
Avg. Length of Stay
74 days
Bed community size
99-bed community Rank #725 / 1657Bed count — State benchmarkedThis home is ranked 725th out of 1657 homes in California. Shows this facility's certified or reported bed count compared to other California facilities. Larger communities may offer more amenities, programs, and on-site services for residents and families.Rankings are based only on facilities in California that report data for that category. Facilities without available data are excluded from the ranking.Click the rank badge to see the full State ranking.Click here to see the full State ranking.
A larger shared setting that may offer more common spaces and organized community services.
Walk Score
Walk Score: 72 / 100 Rank #674 / 2092Walk Score — State benchmarkedThis home is ranked 674th out of 2092 homes in California. Shows how walkable this facility's neighborhood is compared to the average Walk Score across California facilities. Higher scores benefit residents, families, and staff.Rankings are based only on facilities in California that report data for that category. Facilities without available data are excluded from the ranking.Click the rank badge to see the full State ranking.Click here to see the full State ranking.
Very walkable. Most errands can be accomplished on foot, and many essentials are within a short walk.

Contact Claremont Care Center

Staffing Data

Reporting period: October 1 – December 31, 2025 (Q4 2025). Source: CMS Payroll-Based Journal report.

Total staff 175
Employees 150
Contractors 25
Staff to resident ratio 2.16 : 1
19% more staff per resident than California average
California average ratio: 1.81 : 1 California average ratio: 1.81 : 1See full California ranking
Avg staff/day 66
Average shift 7.3 hours
5% worse than California average
California average: 7.7 hours California average shift: 7.7 hoursSee full California ranking
Total staff hours (quarter) 44,358

Nursing staff breakdown

Q4 2025 · Oct 1 – Dec 31 More info This data comes from the CMS Payroll-Based Journal report covering October 1 – December 31, 2025.
Registered Nurse

Manages medical care and health needs.

RN Staff Info All 12 RN Staff are full-time employees. No contractors work on this role. 12
Average shift length Info Average shift length. Calculated as total hours divided by days worked and average staff per day. 7.8 hours
Licensed Practical Nurse

Assists with medical care and medications.

LPN Staff Info 45 total: 32 full-time employees and 13 contractors. 45
Average shift length Info Average shift length. Calculated as total hours divided by days worked and average staff per day. 7.7 hours
Certified Nursing Assistant

Helps with daily care and mobility.

CNA Staff Info 67 total: 65 full-time employees and 2 contractors. 67
Average shift length Info Average shift length. Calculated as total hours divided by days worked and average staff per day. 7.3 hours

Contractor staffing

Q4 2025 · Oct 1 – Dec 31 More info This data comes from the CMS Payroll-Based Journal report covering October 1 – December 31, 2025.

Total hours from contractors

1.5%

665 contractor hours this quarter

Licensed Practical Nurse: 13 Medication Aide/Technician: 4 Certified Nursing Assistant: 2 Medical Director: 2 Occupational Therapy Aide: 1 Qualified Social Worker: 1 Occupational Therapy Assistant: 1 Feeding Assistant: 1

Staff by category

Q4 2025 · Oct 1 – Dec 31 More info This data comes from the CMS Payroll-Based Journal report covering October 1 – December 31, 2025.
Certified Nursing Assistant6526720,48892100%7.3
Licensed Practical Nurse3213459,44792100%7.7
Dental Services Staff9093,17892100%7.9
Registered Nurse120121,96292100%7.8
Physical Therapy Assistant5051,8638592%7.5
Speech Language Pathologist5051,1929199%5.8
Respiratory Therapy Technician5051,0807784%6.6
Physical Therapy Aide6069139199%5.6
RN Director of Nursing2028196470%7.8
Nurse Practitioner1015856571%9
Administrator1015286672%8
Therapeutic Recreation Specialist2024826166%7.7
Dietitian1014725964%8
Other Dietary Services Staff2024645762%7.8
Clinical Nurse Specialist1013664549%8.1
Occupational Therapy Aide0112804145%6.8
Medication Aide/Technician044892426%2.8
Qualified Social Worker112731617%4.6
Medical Director022451314%2.8
Feeding Assistant01124910%2.7
Occupational Therapy Assistant011811%8
67 Certified Nursing Assistant
% of Days 100%
45 Licensed Practical Nurse
% of Days 100%
9 Dental Services Staff
% of Days 100%
12 Registered Nurse
% of Days 100%
5 Physical Therapy Assistant
% of Days 92%
5 Speech Language Pathologist
% of Days 99%
5 Respiratory Therapy Technician
% of Days 84%
6 Physical Therapy Aide
% of Days 99%
2 RN Director of Nursing
% of Days 70%
1 Nurse Practitioner
% of Days 71%
1 Administrator
% of Days 72%
2 Therapeutic Recreation Specialist
% of Days 66%
1 Dietitian
% of Days 64%
2 Other Dietary Services Staff
% of Days 62%
1 Clinical Nurse Specialist
% of Days 49%
1 Occupational Therapy Aide
% of Days 45%
4 Medication Aide/Technician
% of Days 26%
2 Qualified Social Worker
% of Days 17%
2 Medical Director
% of Days 14%
1 Feeding Assistant
% of Days 10%
1 Occupational Therapy Assistant
% of Days 1%

Penalties and fines

Federal penalties imposed by CMS for regulatory violations, including civil money penalties (fines) and denials of payment for new Medicare/Medicaid admissions.

Source: CMS Penalties Database

No penalties in the past 3 years

No civil money penalties or payment denials were reported in the last 3 years.

Quality of care over time

These measures show how residents usually do over time at this home, based on health outcomes and preventive care.

High-risk clinical events score Info A composite score based on pressure ulcers, falls with injury, weight loss, walking ability decline, and activities of daily living decline. 6.2
6% better than California average

California average: 6.6

Functional decline score Info A composite score based on activities of daily living decline, walking ability decline, and incontinence. 10.3
9% better than California average

California average: 11.3

Long-stay resident measures
Significantly above average California avg: 4.2 Info CMS star rating based on long-stay quality measure performance. 5 stars = significantly above average, 1 star = significantly below average.
Need for Help with Daily Activities Increased Info Percent of long-stay residents whose need for help with daily activities has increased 14.1%
28% worse than California average

California average: 11.1%

Walking Ability Worsened Info Percent of long-stay residents whose ability to move independently worsened 5.8%
52% better than California average

California average: 12.0%

Low Risk Residents with Bowel/Bladder Incontinence Info Percent of low risk long-stay residents who lose control of their bowels or bladder 11.0%
In line with California average

California average: 11.3%

Falls with Major Injury Info Percent of long-stay residents experiencing one or more falls with major injury 0.0%
100% better than California average

California average: 1.7%

High Risk Residents with Pressure Ulcers Info Percent of long-stay high risk residents with pressure ulcers 6.1%
22% worse than California average

California average: 5.0%

Urinary Tract Infection Info Percent of long-stay residents with a urinary tract infection 1.6%
25% worse than California average

California average: 1.2%

Lost Too Much Weight Info Percent of long-stay residents who lose too much weight 5.2%
24% worse than California average

California average: 4.2%

Depressive Symptoms Info Percent of long-stay residents who have depressive symptoms 5.9%
13% better than California average

California average: 6.7%

Antipsychotic Use Info Percent of long-stay residents who received an antipsychotic medication 4.2%
58% better than California average

California average: 10.1%

Pneumococcal Vaccine Info Percent of long-stay residents assessed and appropriately given the pneumococcal vaccine 100.0%
In line with California average

California average: 98.5%

Influenza Vaccine Info Percent of long-stay residents assessed and appropriately given the seasonal influenza vaccine 100.0%
In line with California average

California average: 98.2%

Hospitalizations per 1,000 days Info Number of hospitalizations per 1,000 long-stay resident days. 5.18
130% worse than California average

California average: 2.25

ED visits per 1,000 days Info Number of outpatient emergency department visits per 1,000 long-stay resident days. 1.54
In line with California average

California average: 1.59

Short-stay resident measures
Above average California avg: 3.5 Info CMS star rating based on short-stay quality measure performance. 5 stars = much above average, 1 star = much below average.
Pneumococcal Vaccine Info Percent of short-stay residents assessed and appropriately given the pneumococcal vaccine 100.0%
6% better than California average

California average: 94.0%

Antipsychotic medication increase Info Percent of short-stay residents who newly received an antipsychotic medication 1.1%
25% better than California average

California average: 1.5%

Influenza Vaccine Info Percent of short-stay residents assessed and appropriately given the seasonal influenza vaccine 100.0%
7% better than California average

California average: 93.2%

Re-hospitalized after SNF stay Info Percentage of short-stay residents who were re-hospitalized after their nursing home admission. 25.5%
10% worse than California average

California average: 23.2%

Emergency department visits Info Percentage of short-stay residents who had an outpatient emergency department visit. 5.6%
50% better than California average

California average: 11.2%

Falls with major injury Info Percentage of SNF residents who experience falls with major injury during their stay. 0.0%
100% better than California average

California average: 0.8%

Ability to care for self at discharge Info Percentage of residents at or above expected ability to care for themselves at discharge. 61.2%
14% better than California average

California average: 53.7%

Successful return to home or community Info Rate of successful return to home or community from a skilled nursing facility. 51.5%
In line with California average

California average: 50.6%

Breakdown by payment type

Medicare

29% of new residents, usually for short-term rehab.

Typical stay 1 - 2 months

Private pay

65% of new residents, often for short stays.

Typical stay 30 days

Medicaid

6% of new residents, often for long-term daily care.

Typical stay 2 years

Facility Characteristics

Source: CMS Long-Term Care Facility Characteristics (Data as of Jan 2026)

Total residents 81
Medicare
10
12.3% of residents
Medicaid
45
55.6% of residents
Private pay or other
26
32.1% of residents
Programs & Services
Residents Group

Residents meet regularly to discuss policies, care quality, and activities

Active Resident Council

Organized group of residents that meets regularly to discuss facility policies, quality of life, and activities.

Finances and operations

Based on CMS SNF Cost Report for fiscal year ending in 12/2023.

For-profit
Operated by a single business entity.
Net patient revenue Info Net patient revenue — what the home actually collects for resident care, after contractual allowances, bad debt and discounts are subtracted from its gross charges (CMS cost report, Worksheet G-3). It covers resident care only; money the home earns from other sources is shown separately as "Other income."
$15.0M
Net patient income Info Net patient income: net patient revenue minus the home's total operating expenses. A positive figure means it earns more from resident care than it spends to deliver it; a negative figure means the opposite. It excludes non-operating "other income."
$1.6M
For-profit Operated by a single business entity.
Net patient revenue Info Net patient revenue — what the home actually collects for resident care, after contractual allowances, bad debt and discounts are subtracted from its gross charges (CMS cost report, Worksheet G-3). It covers resident care only; money the home earns from other sources is shown separately as "Other income."
$15.0M Rank #188 / 355Revenue — State benchmarkedThis home is ranked 188th out of 355 homes in California. Shows this facility's annual revenue compared to the California average. Higher revenue generally means more resources for staffing and capital — read alongside Payroll %.Rankings are based only on facilities in California that report data for that category. Facilities without available data are excluded from the ranking.Click the rank badge to see the full State ranking.Click here to see the full State ranking.
Net patient income Info Net patient income: net patient revenue minus the home's total operating expenses. A positive figure means it earns more from resident care than it spends to deliver it; a negative figure means the opposite. It excludes non-operating "other income."
$1.6M
Other income Info Money the home earns outside of resident care — such as investments, grants, rentals and other non-operating sources (CMS cost report, Worksheet G-3). It is tracked separately from net patient revenue: it is not part of that figure, and it is not included in net patient income.
$2.8K
Payroll costs Info Staff salaries plus wage-related costs — benefits such as payroll taxes, health insurance and retirement — from the home's own accounting records (CMS cost report, Worksheet A). Contract or agency labor is counted separately, under other operating costs. Rank #186 / 355Payroll — State benchmarkedThis home is ranked 186th out of 355 homes in California. Shows total annual staff payroll benchmarked to the California average. Higher payroll investment relative to peers often signals better staffing and less reliance on cheaper contract labor.Rankings are based only on facilities in California that report data for that category. Facilities without available data are excluded from the ranking.Click the rank badge to see the full State ranking.Click here to see the full State ranking.
$8.2M 54.8% of net patient revenue Info Payroll as a share of revenue: staff salaries and wage-related benefits divided by net patient revenue. A higher figure means more of each revenue dollar goes to staff pay. Rank #145 / 355Payroll % — State benchmarkedThis home is ranked 145th out of 355 homes in California. Shows payroll as a percentage of revenue versus the California average. Well-run California facilities typically land around 55–67% — the top third Statewide. Below 25% may signal understaffing or heavy agency use — read with Staffing ratings.Rankings are based only on facilities in California that report data for that category. Facilities without available data are excluded from the ranking.Click the rank badge to see the full State ranking.Click here to see the full State ranking.
Other operating costs Info Everything it costs to run the home apart from payroll — food, utilities, supplies, maintenance, contract labor and administration. Calculated as total operating expense minus payroll (staff salaries and wage-related benefits).
$5.2M
Total costs Info The home's total operating expense for the year — all the costs of running it, salaries included (CMS cost report, Worksheet G-3).
$13.4M

Who this home usually serves

TYPE OF STAY

Primarily short stays

Residents typically stay for brief periods, with frequent admissions and discharges throughout the year.

Most new residents arrive under private pay (65% of admissions), and a typical private pay stay runs around 30 days.

Admissions
439 total

Coverage residents most often arrive under.

Medicare 29%
Private pay 65%
Medicaid 6%
Discharges
419 total

Coverage residents most often leave under.

Medicare 26%
Private pay 69%
Medicaid 5%

Places of interest near Claremont Care Center

Address 3.9 miles from city center Info Estimated distance in miles from Pomona's city center to Claremont Care Center's address, calculated via Google Maps. — 0.69 miles to nearest hospital (Casa Colina Hospital and Centers for Healthcare)

Calculate Travel Distance to Claremont Care Center

Add your location

Address

Compare Nursing Homes around Pomona

The information below is reported by the California Department of Social Services and Department of Public Health.

5 facilities compared · CMS & CA Dept. of Health data

Harrison Villa of Mt. San Antonio Gardens
NH
AL
IL
MC
Pomona
520
Facility 520
CA AVG 103
Rank #16 / 1657
84.0%
Facility 84.0%
CA AVG 84.7%
Rank #817 / 1537
-1%
6.62
Facility 6.62
CA AVG 4.22
Rank #7 / 354
+3%+57%
$0
Facility $0
CA AVG $56.5k
Rank #1 / 362
94
Facility 94
CA AVG 81
Rank #185 / 1401
16
Facility 16
CA AVG 50.2
Rank #24 / 361
5.3
Facility 5.3
CA AVG 4.6
Rank #265 / 361
-38-
45
Facility 45
CA AVG 57
Rank #1474 / 2092
Congregational Homes
$5.9M
Facility $5.9M
CA AVG $17.0M
Rank #21 / 355
$18.0M
Facility $18.0M
CA AVG $7.0M
Rank #13 / 355
306%
Facility 306%
CA AVG 45.2%
Rank #229 / 355
55016
Claremont Care Center
NH
MC
Pomona (East Foothill Boulevard)
99
Facility 99
CA AVG 103
Rank #725 / 1657
85.9%
Facility 85.9%
CA AVG 84.7%
Rank #437 / 1537
+1%
3.93
Facility 3.93
CA AVG 4.22
Rank #206 / 354
-23%-7%
$0
Facility $0
CA AVG $56.5k
Rank #1 / 362
-
50
Facility 50
CA AVG 50.2
Rank #226 / 361
5.0
Facility 5.0
CA AVG 4.6
Rank #243 / 361
-89-
72
Facility 72
CA AVG 57
Rank #674 / 2092
Carla Arellano
$15.0M
Facility $15.0M
CA AVG $17.0M
Rank #188 / 355
$8.2M
Facility $8.2M
CA AVG $7.0M
Rank #186 / 355
54.8%
Facility 54.8%
CA AVG 45.2%
Rank #145 / 355
55394
Chino Valley Healthcare Center
NH
HC
MC
NC
RC
Pomona
102
Facility 102
CA AVG 103
Rank #691 / 1657
70.6%
Facility 70.6%
CA AVG 84.7%
Rank #939 / 1537
-17%
4.99
Facility 4.99
CA AVG 4.22
Rank #44 / 354
-2%+18%
$10.4k
Facility $10.4k
CA AVG $56.5k
Rank #245 / 362
-
42
Facility 42
CA AVG 50.2
Rank #184 / 361
3.5
Facility 3.5
CA AVG 4.6
Rank #115 / 361
172A+
45
Facility 45
CA AVG 57
Rank #1474 / 2092
Friedman Family Trust
$12.1M
Facility $12.1M
CA AVG $17.0M
Rank #173 / 355
$6.3M
Facility $6.3M
CA AVG $7.0M
Rank #220 / 355
52%
Facility 52%
CA AVG 45.2%
Rank #247 / 355
55126
Pomona Vista Care Center
NH
Pomona (North Main Street)
59
Facility 59
CA AVG 103
Rank #1092 / 1657
88.1%
Facility 88.1%
CA AVG 84.7%
Rank #374 / 1537
+4%
3.84
Facility 3.84
CA AVG 4.22
Rank #229 / 354
-3%-9%
$0
Facility $0
CA AVG $56.5k
Rank #1 / 362
-
74
Facility 74
CA AVG 50.2
Rank #302 / 361
4.6
Facility 4.6
CA AVG 4.6
Rank #216 / 361
252A+
91
Facility 91
CA AVG 57
Rank #155 / 2092
Mjb Partners LLC
$10.0M
Facility $10.0M
CA AVG $17.0M
Rank #167 / 355
$5.4M
Facility $5.4M
CA AVG $7.0M
Rank #277 / 355
54.1%
Facility 54.1%
CA AVG 45.2%
Rank #334 / 355
55282
Country Oaks Care Center
NH
Pomona (West Pearl Street)
81
Facility 81
CA AVG 103
Rank #913 / 1657
86.4%
Facility 86.4%
CA AVG 84.7%
Rank #426 / 1537
+2%
4.17
Facility 4.17
CA AVG 4.22
Rank #138 / 354
-42%-1%
$0
Facility $0
CA AVG $56.5k
Rank #1 / 362
-
94
Facility 94
CA AVG 50.2
Rank #333 / 361
3.6
Facility 3.6
CA AVG 4.6
Rank #123 / 361
172A+
87
Facility 87
CA AVG 57
Rank #249 / 2092
Country Oaks Partners LLC
$13.9M
Facility $13.9M
CA AVG $17.0M
Rank #138 / 355
$8.8M
Facility $8.8M
CA AVG $7.0M
Rank #163 / 355
63.4%
Facility 63.4%
CA AVG 45.2%
Rank #239 / 355
55247

Financial Assistance for
Nursing Home in California

Claremont Care Center is located in Pomona, California.
Here are the financial assistance programs available to residents in California.

Get Financial aid guidance

Multipurpose Senior Services Program

MSSP (Medi-Cal Waiver)

Age 65+
General California resident, Medi-Cal eligible, nursing home risk.
Income Limits (2025) ~$2,829/month 300% FBR, individual
Asset Limits $2,000 (individual), $3,000 (couple).
CA

County-managed; waitlists possible.

Benefits
In-home support (4-6 hours/day) Respite care (14 days/year) Meals (~$6/meal) Transportation (8 trips/month) Care management

In-Home Supportive Services (IHSS)

California IHSS

Age 65+
General California resident, Medicaid-eligible or low-income.
Income Limits ~$1,732/month individual, Medi-Cal threshold
Asset Limits $2,000 individual
CA

Can hire family as caregivers.

Benefits
Personal care (up to 283 hours/month) Homemaker services Respite (varies)

Multipurpose Senior Services Program (MSSP)

CA MSSP

Age 65+
General California resident, Medi-Cal-eligible, nursing home-eligible but community-capable.
Income Limits ~$2,829/month 300% FBR, individual
Asset Limits $2,000 individual
CA

Available in 38 counties; waitlists common.

Benefits
Case management Respite care (up to 10 days/year) Minor home mods (avg. $500) Adult day care (~$50/day)

Property Tax Postponement Program (PTP)

CA PTP

Age 62+
General California resident, own and live in home, 40% equity.
Income Limits (2025) ~$51,500/year household, adjusted annually
Asset Limits Equity-based; no strict asset cap.
CA

Deferred taxes accrue interest (5% as of 2024); repaid upon sale/death.

Benefits
Property tax deferral (avg. $1,000-$3,000/year, varies by county)

Assisted Living Waiver (ALW)

CA ALW

Age 65+ or disabled
General California resident, Medi-Cal-eligible, nursing home-eligible.
Income Limits ~$2,829/month 300% FBR, individual
Asset Limits $2,000 individual
CA

Available in 15 counties (e.g., LA, Sacramento); waitlists common.

Benefits
Personal care in ALFs (5-7 hours/day) Medication management Social services

California CARES Program

CA CARES

Age
General Caregivers of California residents 60+ needing help with 3+ daily activities; no caregiver age limit.
Income Limits No strict limit; cost-sharing above ~$2,500/month threshold.
Asset Limits Not applicable; need-based.
CA

High demand in urban areas; complements IHSS respite.

Benefits
Respite care (up to 10 days/year) Counseling (4-6 sessions/year) Training (2-3 workshops/year) Supplies (~$200/year)

Frequently Asked Questions about Claremont Care Center

What neighborhood is Claremont Care Center in?

Claremont Care Center is in the East Foothill Boulevard neighborhood.

Is Claremont Care Center in a walkable area?

Claremont Care Center has a walk score of 72. Very walkable. Most errands can be accomplished on foot, and many essentials are within a short walk.

What is the occupancy rate at Claremont Care Center?

Claremont Care Center's occupancy is 85.9%.

Does Claremont Care Center operate as a for-profit or non-profit?

Claremont Care Center is registered as a for-profit.

Are there photos of Claremont Care Center?

Yes — there are 6 photos of Claremont Care Center in the photo gallery on this page.

What is the address of Claremont Care Center?

Claremont Care Center is located at 219 E Foothill Blvd, Pomona, CA 91768.

What is the phone number of Claremont Care Center?

(909) 593-1391 will put you in contact with the team at Claremont Care Center.

Guides for Better Senior Living

Care Cost Calculator: See Prices in Your Area

Nursing Home Data Explorer

Don’t Wait Too Long: 7 Red Flag Signs Your Parent Needs Assisted Living Now

The True Cost of Assisted Living in 2025 – And How Families Are Paying For It

Understanding Senior Living Costs: Pricing Models, Discounts & Financial Assistance