Clark Manor
Nursing Home, Memory Care & Skilled Nursing · Chicago, IL
CMS overall rating Info The Overall CMS Rating is scored from 1 to 5 stars and combines results from health inspections, staffing levels, and quality measures. Health inspections carry the most weight. Staffing and quality scores can increase or decrease the final rating based on performance compared to state and national standards.

Clark Manor

Nursing Home, Memory Care & Skilled Nursing · Chicago, IL
CMS overall rating Info The Overall CMS Rating is scored from 1 to 5 stars and combines results from health inspections, staffing levels, and quality measures. Health inspections carry the most weight. Staffing and quality scores can increase or decrease the final rating based on performance compared to state and national standards.
Calculator: See prices in your area
Clark Manor accepts Medicare, Medicaid, and private pay.

Overview of Clark Manor

Clark Manor is an extraordinary home that caters to the unique needs of individuals entering their golden years in Chicago. Specializing in memory care, behavioral health, and psych services, Clark Manor is dedicated to meeting the diverse needs of its residents. Advanced wound care treatments prioritize comfort and healing, while dedicated dietary technicians provide personalized nutritional planning.  The facility’s comprehensive rebuilding programs are designed to restore strength, confidence, and independence, ensuring a holistic approach to post-hospital rehabilitation.

As a VA-certified facility, Clark Manor also proudly serves and honors its veteran residents with tailored care that recognizes their unique experiences. The home is also more than just a place of exceptional care. It is a home where new memories are created, lasting relationships are formed, and trust is at the core of the community. The warmth and genuine care that permeate every corner of the residence create an environment that feels like family.

(773) 338-8778

Quality ratings

Measured by Centers for Medicare & Medicaid Services (CMS)

Overall rating Info The Overall CMS Rating combines results from health inspections, staffing levels and quality measures. Health inspections carry the most weight. Staffing and quality scores can increase or decrease the final rating based on performance compared to state and national standards.
▼ 36.5% Below IL avg. ▼ 36.5% Below IL avg.Click the badge to see the full State ranking.Click here to see the full State ranking.
Health Inspection Info Based on the results of the facility's three most recent standard inspections and any complaint investigations. CMS reviews the number, scope, and severity of deficiencies, with more recent findings weighted more heavily.
At IL avg. At IL avg.Click the badge to see the full State ranking.Click here to see the full State ranking.
Staffing Info Measures average nursing staff hours per resident per day, including Registered Nurses (RNs) and total nursing staff. Ratings are adjusted based on the level of care residents require and are compared to state and national benchmarks.
▼ 39.9% Below IL avg. ▼ 39.9% Below IL avg.Click the badge to see the full State ranking.Click here to see the full State ranking.
Quality Measures Info Based on clinical and physical health indicators reported to CMS, such as hospital readmissions, falls, pressure ulcers, and improvements in mobility. These measures reflect how well residents' health needs are being managed.
▼ 68.7% Below IL avg. ▼ 68.7% Below IL avg.Click the badge to see the full State ranking.Click here to see the full State ranking.

Staffing hours breakdown

Info Daily nursing hours per resident by staff type, reported to CMS. Higher is generally better — compare this facility to state and national averages to see where staffing stands.

Hours per resident per day — compared to Illinois state averages

Total nursing care / resident Info This home is ranked 66th out of 167 homes in Illinois. Total adjusted nursing hours per resident per day, combining RN, LPN, and aide time. CMS adjusts this for case-mix so facilities can be fairly compared.
3h 6m per day
Rank #66 / 167Nurse hours — State benchmarkedThis home is ranked 66th out of 167 homes in Illinois. Shows adjusted nurse hours per resident per day benchmarked to the Illinois average, with a ranking across 167 Illinois SNFs. More hours mean more direct care. The national average is about 3.5 hrs; below 3.0 is a red flag.Click the rank badge to see the full State ranking.Click here to see the full State ranking.
This facility Illinois avg (3h 57m per day)
vs Illinois avg
-22%

5 of 6 metrics below state avg

Standout metric Weekend RN is +18% above state avg
Staff typeHours / Day / Residentvs state avg
Registered Nurse (RN) Info RNs hold the highest nursing license and can assess residents, interpret test results, and direct care plans. More RN hours per day often signals stronger clinical oversight and faster response to health changes. 40m per day ▼ 9% State avg: 44m per day · National avg: 41m per day
LPN / LVN Info Licensed Practical Nurses (LPNs) or Licensed Vocational Nurses (LVNs) deliver routine hands-on care — medication administration, wound dressing, and monitoring vital signs. They work under RN supervision and make up a large share of daily bedside care. 22m per day ▼ 42% State avg: 38m per day · National avg: 52m per day
Nurse Aide Info Certified Nurse Aides (CNAs) provide the most direct day-to-day assistance: bathing, dressing, feeding, and mobility. Nurse aide hours are typically the largest staffing category and directly affect residents' quality of life. 1h 30m per day ▼ 30% State avg: 2h 8m per day · National avg: 2h 21m per day
Weekend Total Nursing Info Combined nursing hours (RN + LPN + Nurse Aide) per resident per day on weekends. Staffing often drops on weekends — this figure reveals whether the facility maintains adequate coverage outside of weekday hours. 2h 55m per day ▼ 6% State avg: 3h 5m per day · National avg: 3h 26m per day
Physical Therapist Info Hours per resident per day provided by licensed Physical Therapists (PTs) or PT Assistants. PT services help residents recover mobility after injury or illness and are especially important for post-acute (short-stay) rehabilitation. 1m per day ▼ 67% State avg: 3m per day · National avg: 4m per day
Weekend RN Info Registered nurse hours specifically on weekends. Facilities sometimes reduce RN presence on Saturdays and Sundays — a low weekend RN figure compared to weekday hours can indicate reduced clinical oversight when most administrative staff are absent. 40m per day ▲ 18% State avg: 34m per day · National avg: 29m per day

Types of Care at Clark Manor

Memory Care Skilled Nursing

Capacity and availability

This home usually has availability

Occupancy lower than 85% suggests more openings may be available.

Higher occupancy than the Illinois average: 69.3%
Occupancy rate 84.2% Rank #65 / 199Occupancy rate — State benchmarkedThis home is ranked 65th out of 199 homes in Illinois. Shows this facility's occupancy rate versus the Illinois average, with its Statewide rank out of 199. Higher occupancy signals strong local demand and financial stability.Click the rank badge to see the full State ranking.Click here to see the full State ranking.
Avg. Length of Stay 173 days
Occupancy rate
84.2% Rank #65 / 199Occupancy rate — State benchmarkedThis home is ranked 65th out of 199 homes in Illinois. Shows this facility's occupancy rate versus the Illinois average, with its Statewide rank out of 199. Higher occupancy signals strong local demand and financial stability.Click the rank badge to see the full State ranking.Click here to see the full State ranking.
Avg. Length of Stay
173 days
Years in operation
50 years in operation Rank #2 / 251Years in operation — State benchmarkedThis home is ranked 2nd out of 251 homes in Illinois. Shows how long this facility has been in operation compared to other Illinois SNFs. Longer operating histories may benefit residents, families, and staff.Click the rank badge to see the full State ranking.Click here to see the full State ranking.
A longer operating history, which may indicate experience navigating regulations and delivering ongoing care.
Walk Score
Walk Score: 92 / 100 Rank #28 / 647Walk Score — State benchmarkedThis home is ranked 28th out of 647 homes in Illinois. Shows how walkable this facility's neighborhood is compared to the average Walk Score across Illinois SNFs. Higher scores benefit residents, families, and staff.Click the rank badge to see the full State ranking.Click here to see the full State ranking.
Walker's paradise. Daily errands do not require a car, with many shops and services nearby.

Staffing

Key information about the people who lead and staff this community.

Leadership

ContactMr. Mark Schlichting, Administrator

Contact Clark Manor

Health Inspection History

Inspections since 2022
Total health inspections 6

Illinois average 10.4


Last Health inspection on Oct 2025
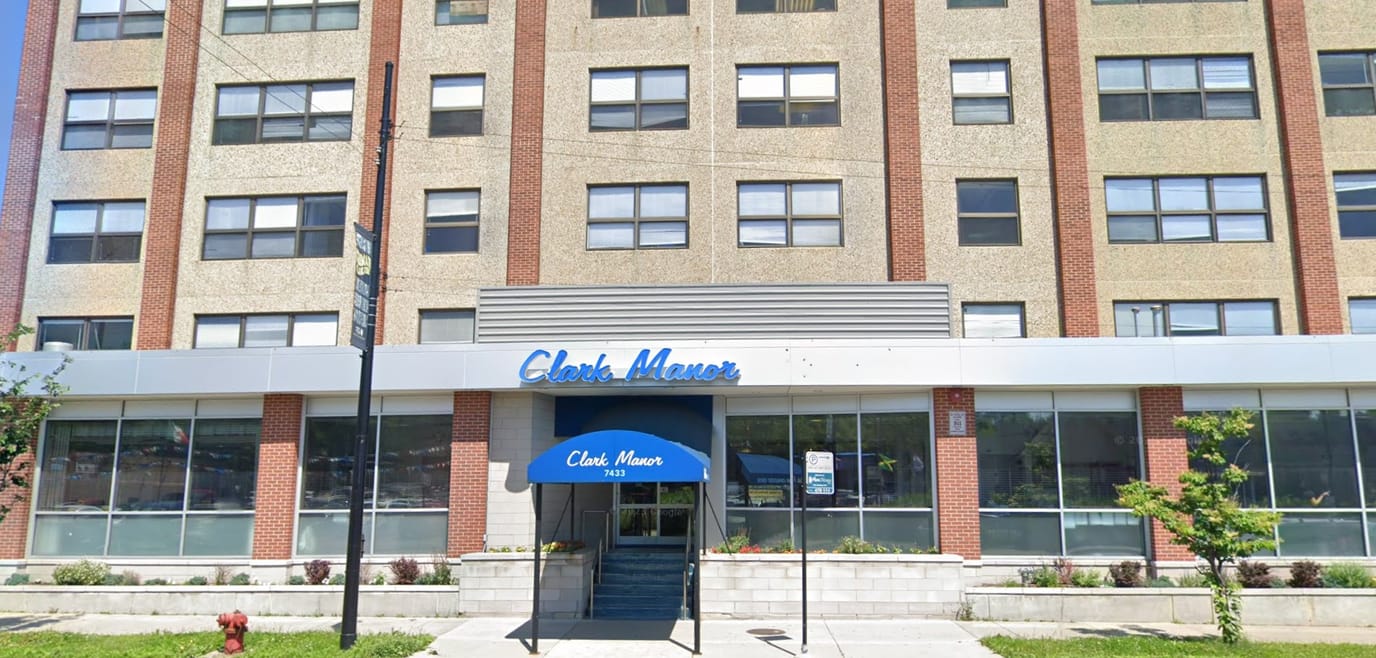
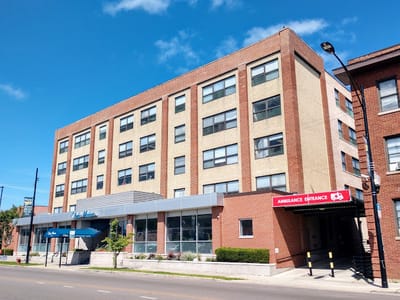
Total health citations
20 Rank #42 / 167Health citations — State benchmarkedThis home is ranked 42nd out of 167 homes in Illinois. Shows this facility's total health deficiency citations benchmarked to the Illinois State average, with a ranking across all 167 IL SNFs. Lower citation counts earn a better rank.Click the rank badge to see the full State ranking.Click here to see the full State ranking.

Illinois average 36.8

Citations per inspection
3.33 Rank #69 / 167Citations per inspection — State benchmarkedThis home is ranked 69th out of 167 homes in Illinois. Shows average deficiency citations per CMS inspection for this facility versus the Illinois mean across 167 SNFs with citation data. Lower is better.Click the rank badge to see the full State ranking.Click here to see the full State ranking.

Illinois average 3.68


Health citations are formal notices following inspections when they fail to comply with safety and care standards.

16 of 20 citations resulted from standard inspections; and 4 of 20 resulted from complaint investigations.

Breakdown of citation severity (last 4 years)
Critical Health citations
0
100% better than Illinois average

Illinois average: 0.7


Serious Health citations
2 Rank #33 / 135Serious citations (G–I) — State benchmarkedThis home is ranked 33rd out of 135 homes in Illinois. Shows G–I scope serious health citations for this facility versus other Illinois SNFs. Lower counts rank better.Click the rank badge to see the full State ranking.Click here to see the full State ranking.
44% better than Illinois average

Illinois average: 3.6

0 critical citations Illinois average: 0.7

2 serious citations Illinois average: 3.6

16 moderate citations Illinois average: 32

2 minor citations Illinois average: 0.5
Citations history (last 4 years)
Quality of Care serious citation Oct 15, 2025
Corrected

Pharmacy moderate citation Aug 23, 2025
Corrected

Quality of Care moderate citation Aug 23, 2025
Corrected

Infection Control moderate citation Feb 05, 2025
Corrected

Staffing Data

Reporting period: October 1 – December 31, 2025 (Q4 2025). Source: CMS Payroll-Based Journal report.

Total staff 158
Employees 82
Contractors 76
Staff to resident ratio 1.65:1
8% worse than Illinois average
Illinois average ratio: 1.80:1 Illinois average ratio: 1.80:1See full Illinois ranking
Avg staff/day 44
Average shift 7.5 hours
0% compared with Illinois average
Illinois average: 7.6 hours Illinois average shift: 7.6 hoursSee full Illinois ranking
Total staff hours (quarter) 30,456

Nursing staff breakdown

Q4 2025 · Oct 1 – Dec 31 More info This data comes from the CMS Payroll-Based Journal report covering October 1 – December 31, 2025.
Registered Nurse

Manages medical care and health needs.

RN Staff 44
Average shift length Info Average shift length. Calculated as total hours divided by days worked and average staff per day. 8.8 hours

This role is partially covered by contractors.

Licensed Practical Nurse

Assists with medical care and medications.

LPN Staff 28
Average shift length Info Average shift length. Calculated as total hours divided by days worked and average staff per day. 9.2 hours

This role is partially covered by contractors.

Certified Nursing Assistant

Helps with daily care and mobility.

CNA Staff 54
Average shift length Info Average shift length. Calculated as total hours divided by days worked and average staff per day. 7.6 hours

This role is partially covered by contractors.

Contractor staffing

Q4 2025 · Oct 1 – Dec 31 More info This data comes from the CMS Payroll-Based Journal report covering October 1 – December 31, 2025.

Total hours from contractors

10.7%

3,253 contractor hours this quarter

Registered Nurse: 37 Licensed Practical Nurse: 17 Speech Language Pathologist: 5 Physical Therapy Aide: 4 Certified Nursing Assistant: 3 Respiratory Therapy Technician: 3 Qualified Social Worker: 3 Physical Therapy Assistant: 2 Occupational Therapy Aide: 2

Staff by category

Q4 2025 · Oct 1 – Dec 31 More info This data comes from the CMS Payroll-Based Journal report covering October 1 – December 31, 2025.
Certified Nursing Assistant5135416,96892100%7.6
Licensed Practical Nurse1117283,98592100%9.2
Registered Nurse737442,51392100%8.8
RN Director of Nursing3031,3437480%7.9
Dental Services Staff3039386975%7.6
Physical Therapy Aide0447936773%6.1
Speech Language Pathologist0557736874%4.8
Other Dietary Services Staff2025778087%6.9
Clinical Nurse Specialist1015226975%7.6
Nurse Practitioner1014906267%7.9
Administrator1014725964%8
Dietitian1014597076%6.6
Qualified Social Worker0332756368%4.4
Respiratory Therapy Technician0331405459%2.6
Physical Therapy Assistant0221205054%2
Occupational Therapy Assistant101471011%4.7
Occupational Therapy Aide022421820%2.2
54 Certified Nursing Assistant
% of Days 100%
28 Licensed Practical Nurse
% of Days 100%
44 Registered Nurse
% of Days 100%
3 RN Director of Nursing
% of Days 80%
3 Dental Services Staff
% of Days 75%
4 Physical Therapy Aide
% of Days 73%
5 Speech Language Pathologist
% of Days 74%
2 Other Dietary Services Staff
% of Days 87%
1 Clinical Nurse Specialist
% of Days 75%
1 Nurse Practitioner
% of Days 67%
1 Administrator
% of Days 64%
1 Dietitian
% of Days 76%
3 Qualified Social Worker
% of Days 68%
3 Respiratory Therapy Technician
% of Days 59%
2 Physical Therapy Assistant
% of Days 54%
1 Occupational Therapy Assistant
% of Days 11%
2 Occupational Therapy Aide
% of Days 20%

Penalties and fines

Federal penalties imposed by CMS for regulatory violations, including civil money penalties (fines) and denials of payment for new Medicare/Medicaid admissions.

Source: CMS Penalties Database

No penalties in the past 3 years

No civil money penalties or payment denials were reported in the last 3 years.

Quality of care over time

These measures show how residents usually do over time at this home, based on health outcomes and preventive care.

High-risk clinical events score Info A composite score based on pressure ulcers, falls with injury, weight loss, walking ability decline, and activities of daily living decline. 19.2
98% worse than Illinois average

Illinois average: 9.7

Functional decline score Info A composite score based on activities of daily living decline, walking ability decline, and incontinence. 33.0
77% worse than Illinois average

Illinois average: 18.6

Long-stay resident measures
Significantly above average Info CMS star rating based on long-stay quality measure performance. 5 stars = significantly above average, 1 star = significantly below average.
Need for Help with Daily Activities Increased Info Percent of long-stay residents whose need for help with daily activities has increased 32.7%
111% worse than Illinois average

Illinois average: 15.5%

Walking Ability Worsened Info Percent of long-stay residents whose ability to move independently worsened 36.5%
98% worse than Illinois average

Illinois average: 18.4%

Low Risk Residents with Bowel/Bladder Incontinence Info Percent of low risk long-stay residents who lose control of their bowels or bladder 29.8%
38% worse than Illinois average

Illinois average: 21.6%

Falls with Major Injury Info Percent of long-stay residents experiencing one or more falls with major injury 10.2%
204% worse than Illinois average

Illinois average: 3.4%

High Risk Residents with Pressure Ulcers Info Percent of long-stay high risk residents with pressure ulcers 8.4%
60% worse than Illinois average

Illinois average: 5.3%

Urinary Tract Infection Info Percent of long-stay residents with a urinary tract infection 1.5%
16% better than Illinois average

Illinois average: 1.8%

Lost Too Much Weight Info Percent of long-stay residents who lose too much weight 8.3%
27% worse than Illinois average

Illinois average: 6.5%

Depressive Symptoms Info Percent of long-stay residents who have depressive symptoms 5.7%
88% better than Illinois average

Illinois average: 48.1%

Antipsychotic Use Info Percent of long-stay residents who received an antipsychotic medication 15.6%
23% better than Illinois average

Illinois average: 20.2%

Pneumococcal Vaccine Info Percent of long-stay residents assessed and appropriately given the pneumococcal vaccine 97.0%
9% better than Illinois average

Illinois average: 89.2%

Influenza Vaccine Info Percent of long-stay residents assessed and appropriately given the seasonal influenza vaccine 92.5%
In line with Illinois average

Illinois average: 91.6%

Hospitalizations per 1,000 days Info Number of hospitalizations per 1,000 long-stay resident days. 1.85
10% better than Illinois average

Illinois average: 2.05

ED visits per 1,000 days Info Number of outpatient emergency department visits per 1,000 long-stay resident days. 1.82
19% better than Illinois average

Illinois average: 2.25

Short-stay resident measures
Significantly below average Info CMS star rating based on short-stay quality measure performance. 5 stars = much above average, 1 star = much below average.
Pneumococcal Vaccine Info Percent of short-stay residents assessed and appropriately given the pneumococcal vaccine 79.5%
16% better than Illinois average

Illinois average: 68.3%

Antipsychotic medication increase Info Percent of short-stay residents who newly received an antipsychotic medication 0.0%
100% better than Illinois average

Illinois average: 2.3%

Influenza Vaccine Info Percent of short-stay residents assessed and appropriately given the seasonal influenza vaccine 49.1%
22% worse than Illinois average

Illinois average: 63.0%

Re-hospitalized after SNF stay Info Percentage of short-stay residents who were re-hospitalized after their nursing home admission. 48.6%
85% worse than Illinois average

Illinois average: 26.2%

Emergency department visits Info Percentage of short-stay residents who had an outpatient emergency department visit. 3.7%
74% better than Illinois average

Illinois average: 14.0%

Falls with major injury Info Percentage of SNF residents who experience falls with major injury during their stay. 0.0%
100% better than Illinois average

Illinois average: 0.8%

Breakdown by payment type

Medicare

11% of new residents, usually for short-term rehab.

Typical stay 3 months

Private pay

55% of new residents, often for short stays.

Typical stay 3 - 4 months

Medicaid

34% of new residents, often for long-term daily care.

Typical stay 9 - 10 months

Facility Characteristics

Source: CMS Long-Term Care Facility Characteristics (Data as of Jan 2026)

Total residents 96
Medicare
8
8.3% of residents
Medicaid
56
58.3% of residents
Private pay or other
32
33.3% of residents
Programs & Services
Residents Group

Residents meet regularly to discuss policies, care quality, and activities

Active Resident Council

Organized group of residents that meets regularly to discuss facility policies, quality of life, and activities.

Finances and operations

Voluntary non-profit community
Home revenue
$10.2M
Operating deficit
-$165.8K
Voluntary non-profit community
Home revenue
$10.2M Rank #126 / 166Revenue — State benchmarkedThis home is ranked 126th out of 166 homes in Illinois. Shows this facility's annual revenue compared to the Illinois SNF average. Higher revenue generally means more resources for staffing and capital — read alongside Payroll %.Click the rank badge to see the full State ranking.Click here to see the full State ranking.
Operating deficit
-$165.8K
Payroll costs Info The portion of the home's budget spent on staff, including nurses, caregivers, and other employees who support care and operations. Rank #124 / 166Payroll — State benchmarkedThis home is ranked 124th out of 166 homes in Illinois. Shows total annual staff payroll benchmarked to the Illinois average. Higher payroll investment relative to peers often signals better staffing and less reliance on cheaper contract labor.Click the rank badge to see the full State ranking.Click here to see the full State ranking.
$5.3M
52% of revenue Rank #62 / 166Payroll % — State benchmarkedThis home is ranked 62nd out of 166 homes in Illinois. Shows payroll as a percentage of revenue versus the Illinois average. Well-run Illinois SNFs typically land around 54–67% — the top third Statewide. Below 25% may signal understaffing or heavy agency use — read with Staffing ratings.Click the rank badge to see the full State ranking.Click here to see the full State ranking.
Other operating costs Info All remaining costs needed to run the home, such as food, utilities, building maintenance, supplies and administrative expenses.
$5.1M
Total costs $10.4M

Who this home usually serves

TYPE OF STAY

Mix of rehab and long-term care

This home supports both short-term rehab and long-term care, with residents staying for a wide range of durations.

Places of interest near Clark Manor

Address 11.7 miles from city center Info Estimated distance in miles from Chicago's city center to Clark Manor's address, calculated via Google Maps. — 6.08 miles to nearest hospital (Ascension Saint Joseph - Chicago)

Calculate Travel Distance to Clark Manor

Add your location

Address

Financial Assistance for
Nursing Home in Illinois

Clark Manor is located in Chicago, Illinois.
Here are the financial assistance programs available to residents in Illinois.

Get Financial aid guidance

Community Care Program

Illinois CCP

Age 60+
General Illinois resident, at risk of nursing home placement.
Income Limits (2025) ~$1,215/month individual
Asset Limits $17,500 individual, excludes home, car
IL

High demand in urban areas; waitlists possible.

Benefits
In-home care (3-5 hours/day) Adult day services ($65/day) Emergency home response systems ($30/month)

Illinois Respite Program

IL Respite (via NFCSP)

Age Caregiver of someone 60+ (or with dementia)
General Illinois resident.
Income Limits No strict limit; prioritizes low-income.
Asset Limits Not applicable.
IL

Limited slots; urban/rural balance.

Benefits
In-home respite (4-6 hours/day) Adult day care (~$65/day) Short-term facility care (up to 5 days)

Supportive Living Program (SLP)

Illinois Medicaid Supportive Living Program

Age 65+ or 22-64 with disability
General Illinois resident, Medicaid-eligible, needs moderate assistance (not nursing home-level).
Income Limits (2025) ~$2,829/month (300% FBR, individual); QIT allowed.
Asset Limits $2,000 (individual), $3,000 (couple) (excludes home, car).
IL

~200 SLP sites statewide; room/board not covered.

Benefits
Personal care (5-7 hours/day, e.g., bathing, mobility) Meals Housekeeping Medication management Respite (~240 hours/year)

Persons Who Are Elderly Waiver

Illinois Medicaid Elderly Waiver

Age 65+
General Illinois resident, Medicaid-eligible, nursing home-level care need.
Income Limits (2025) ~$2,829/month 300% FBR, individual
Asset Limits $2,000 (individual), $3,000 (couple).
IL

Part of HealthChoice Illinois; consumer-directed options available.

Benefits
Personal care (5-7 hours/day, e.g., dressing, eating) Homemaker Adult day care (~$60/day) Respite (240 hours/year) Home mods ($1,000 avg.)

Medicare Savings Program (MSP)

Illinois Medicare Savings Program

Age 65+ or disabled
General Illinois resident, Medicare Part A/B.
Income Limits (2025) ~$2,510/month (QMB), ~$3,380/month (SLMB), ~$3,598/month (QI)—individual.
Asset Limits $9,430 (individual), $14,130 (couple).
IL

Three tiers; no waitlist.

Benefits
Covers Part B premiums ($174.70/month) Deductibles ($240/year) Copays (~20%)

Optional State Supplementation (OSS)

Illinois Optional State Supplementation

Age 65+ or disabled
General Illinois resident, in approved facility, SSI recipient or low-income.
Income Limits (2025) ~$1,004/month including SSI
Asset Limits $2,000 (individual), $3,000 (couple).
IL

~$50-$500/month based on facility type.

Benefits
Cash (~$50-$500/month) for room/board in personal care homes or SLFs

VA Aid and Attendance (A&A) and Housebound Benefits

Illinois VA Aid and Attendance/Housebound

Age 65+ or disabled veteran/spouse
General Illinois resident, wartime service, need for ADL help (A&A) or homebound.
Income Limits (2025) Net income < ~$1,984/month (veteran with dependent, A&A); pension offsets income.
Asset Limits ~$155,356 net worth limit
IL

High veteran demand in urban/rural areas.

Benefits
Cash (~$1,433-$2,642/month veteran, ~$951-$1,318 spouse) for care costs (e.g., in-home, assisted living)

Compare Nursing Home around Chicago

The information below is reported by the Illinois Department of Public Health, Office of Health Care Regulation.

4 facilities compared · CMS & IL Dept. of Health data

Filter by care type
Smith Village
NH

Nursing Home Licensed facility providing 24/7 skilled nursing care for residents with complex, ongoing medical needs. Staffed by RNs, LPNs, and CNAs. Inspected and star-rated annually by CMS. Accepts Medicare (short-term rehab) and Medicaid (long-term care).

AL

Assisted Living A licensed, long-term care setting for seniors or individuals with disabilities who need help with daily activities — like bathing, dressing, and medication management — but not 24-hour skilled nursing. Offers housing, meals, and around-the-clock support while aiming to maximize resident independence.

IL

Independent Living Lifestyle-focused communities for older adults offering dining, activities, and transportation with minimal personal care. Best for active, independent seniors who want community without medical support.

MC

Memory Care Secured, specialized care for people living with Alzheimer's or dementia. Staff trained in cognitive impairment, with higher staff-to-resident ratios and an environment designed to reduce confusion and wandering risk.

Chicago (South Side)82 89.4% +29%5.28 +4%+70%$100.4k203.3469A+ 71 The Washington And Jane Smith Home$27.7M$12.0M43.5%145904
Clark Manor
NH

Nursing Home Licensed facility providing 24/7 skilled nursing care for residents with complex, ongoing medical needs. Staffed by RNs, LPNs, and CNAs. Inspected and star-rated annually by CMS. Accepts Medicare (short-term rehab) and Medicaid (long-term care).

MC

Memory Care Secured, specialized care for people living with Alzheimer's or dementia. Staff trained in cognitive impairment, with higher staff-to-resident ratios and an environment designed to reduce confusion and wandering risk.

Chicago (Rogers Park)106 84.2% +22%3.10 +96%0%$0203.3292- 92 St. Clara's Manor$10.2M$5.3M52%145720
Bethesda Rehab & Senior Care
NH

Nursing Home Licensed facility providing 24/7 skilled nursing care for residents with complex, ongoing medical needs. Staffed by RNs, LPNs, and CNAs. Inspected and star-rated annually by CMS. Accepts Medicare (short-term rehab) and Medicaid (long-term care).

MC

Memory Care Secured, specialized care for people living with Alzheimer's or dementia. Staff trained in cognitive impairment, with higher staff-to-resident ratios and an environment designed to reduce confusion and wandering risk.

Chicago (Montclare)135 73.3% +6%2.95 +36%-5%$132.1k544.95105- 81 Montclare Holding Company LLC$6.5M$4.9M76.5%145844
Aspired Living of La Grange
NH

Nursing Home Licensed facility providing 24/7 skilled nursing care for residents with complex, ongoing medical needs. Staffed by RNs, LPNs, and CNAs. Inspected and star-rated annually by CMS. Accepts Medicare (short-term rehab) and Medicaid (long-term care).

AL

Assisted Living A licensed, long-term care setting for seniors or individuals with disabilities who need help with daily activities — like bathing, dressing, and medication management — but not 24-hour skilled nursing. Offers housing, meals, and around-the-clock support while aiming to maximize resident independence.

MC

Memory Care Secured, specialized care for people living with Alzheimer's or dementia. Staff trained in cognitive impairment, with higher staff-to-resident ratios and an environment designed to reduce confusion and wandering risk.

La Grange117 73.8% +7%2.99 +14%-3%$87.4k453.05137- 89 Chris Vangel Gst Exempt Descendants Trust$33.3M$11.4M34.3%146093

Frequently Asked Questions about Clark Manor

What neighborhood is Clark Manor in?

Clark Manor is in the Rogers Park neighborhood of Chicago.

Is Clark Manor in a walkable area?

Clark Manor has a walk score of 92. Walker's paradise. Daily errands do not require a car, with many shops and services nearby.

What is the phone number of Clark Manor?

(773) 338-8778 will put you in contact with the team at Clark Manor.

Is Clark Manor Medicare or Medicaid certified?

Yes — Clark Manor is a CMS-certified provider of Medicare and Medicaid.

Guides for Better Senior Living

Care Cost Calculator: See Prices in Your Area

Nursing Home Data Explorer

Don’t Wait Too Long: 7 Red Flag Signs Your Parent Needs Assisted Living Now

The True Cost of Assisted Living in 2025 – And How Families Are Paying For It

Understanding Senior Living Costs: Pricing Models, Discounts & Financial Assistance

Explore Open Rooms
1 Contact details
2 What type of senior care service are you looking for?
3 What budget do you have in mind for senior care?
4 How soon do you need to find care?
5 Additional details

Thank you for your interest!

Our team will be in touch shortly to help with next steps.