• Home
  • Nursing Home in Florida
Vi at Bentley Village
Nursing Home, Assisted Living & Independent Living · Naples, FL
CMS overall rating Info CMS (the Centers for Medicare & Medicaid Services) is the federal agency that rates nursing home quality. Its Overall Rating runs from 1 to 5 stars, combining health inspections, staffing, and quality measures, with inspections weighted most heavily.

Vi at Bentley Village

Nursing Home, Assisted Living & Independent Living · Naples, FL
CMS overall rating Info CMS (the Centers for Medicare & Medicaid Services) is the federal agency that rates nursing home quality. Its Overall Rating runs from 1 to 5 stars, combining health inspections, staffing, and quality measures, with inspections weighted most heavily.
Calculator: See prices in your area
Vi at Bentley Village accepts Medicare and private pay.

Overview of VI at Bentley Village

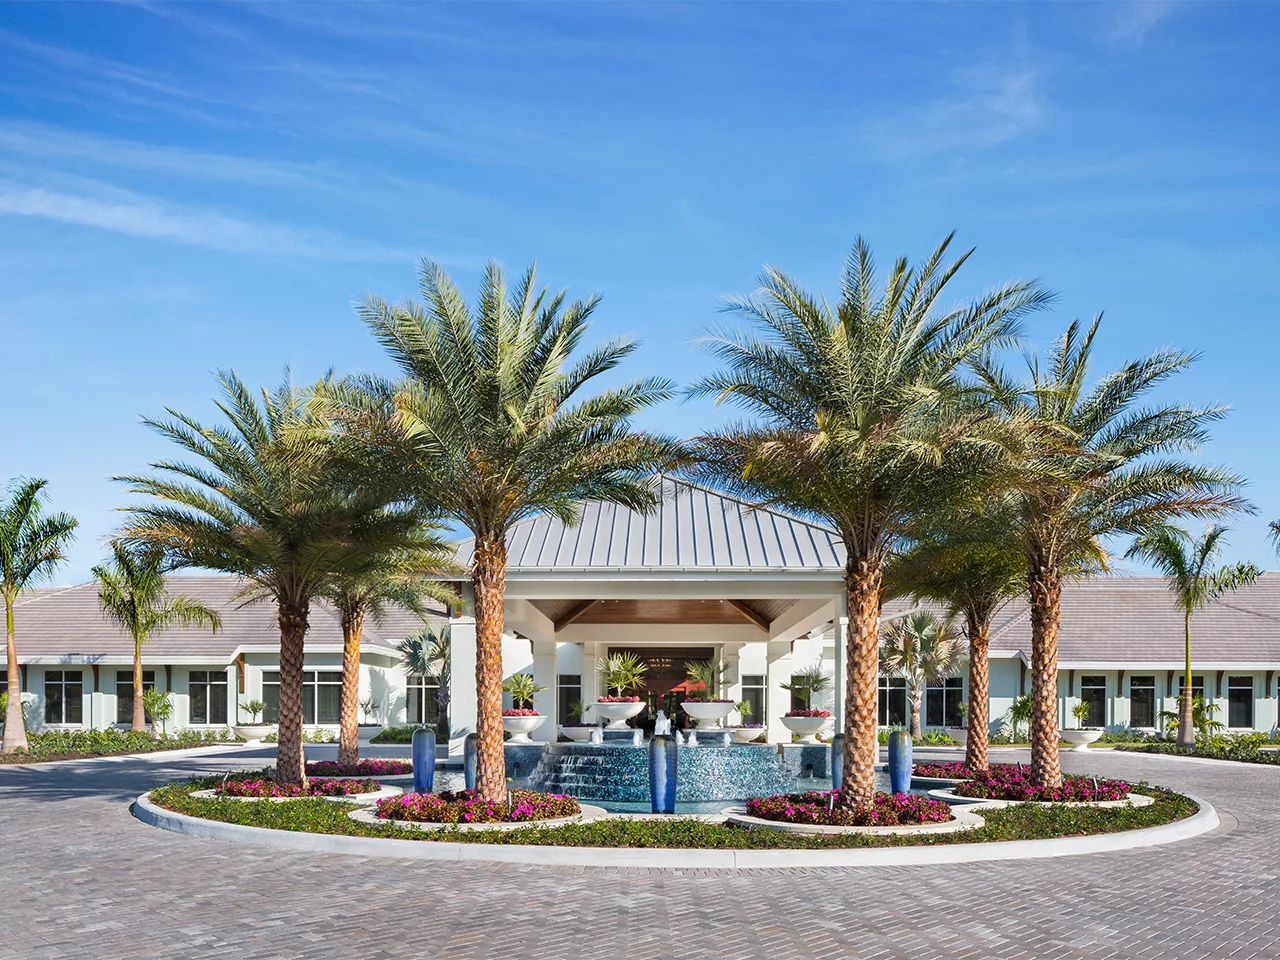
VI at Bentley Village, located in Naples, FL, is a senior living community and a continuing care retirement community offering assisted living, memory care, and skilled nursing services. This senior living community boasts of their quality personalized care plans designed to meet their residents specific needs through a variety of services. Residents at VI at Bentley Village can expect to receive support from their attentive staff, providing residents with more time and energy to focus on their hobbies or new found interests.

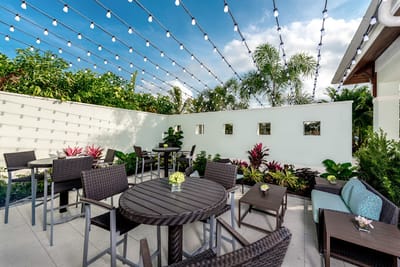
Additionally, VI at Bentley Village also offers a rich array of luxurious amenities designed to create a more comfortable environment where residents can thrive and enjoy a worry free lifestyle. Some of the amenities include their dining services, golf courses, and wellness programs. The community also offers modern conveniences from housekeeping and maintenance services, to their on campus transportation, and on-site care and rehabilitation.

Quality ratings

Measured by Centers for Medicare & Medicaid Services (CMS)

Overall rating Info The Overall CMS Rating combines results from health inspections, staffing levels and quality measures. Health inspections carry the most weight. Staffing and quality scores can increase or decrease the final rating based on performance compared to state and national standards.
Health Inspection Info Based on the results of the facility's three most recent standard inspections and any complaint investigations. CMS reviews the number, scope, and severity of deficiencies, with more recent findings weighted more heavily.
Staffing Info Measures average nursing staff hours per resident per day, including Registered Nurses (RNs) and total nursing staff. Ratings are adjusted based on the level of care residents require and are compared to state and national benchmarks.
Quality Measures Info Based on clinical and physical health indicators reported to CMS, such as hospital readmissions, falls, pressure ulcers, and improvements in mobility. These measures reflect how well residents' health needs are being managed.

Staffing hours breakdown

Info Daily nursing hours per resident by staff type, reported to CMS. Higher is generally better — compare this facility to state and national averages to see where staffing stands.

Hours per resident per day — compared to state averages

Total nursing care / resident Info Total adjusted nursing hours per resident per day, combining RN, LPN, and aide time. CMS adjusts this for case-mix so facilities can be fairly compared.
6h 15m per day
Rank #5 / 253Nurse hours — State benchmarkedThis home is ranked 5th out of 253 homes in Florida. Shows adjusted nurse hours per resident per day benchmarked to the Florida average, with a ranking across 253 Florida facilities. More hours mean more direct care. The national average is about 3.5 hrs; below 3.0 is a red flag.Rankings are based only on facilities in Florida that report data for that category. Facilities without available data are excluded from the ranking.Click the rank badge to see the full State ranking.Click here to see the full State ranking.
vs avg
Staff typeHours / Day / Residentvs state avg
Registered Nurse (RN) Info RNs hold the highest nursing license and can assess residents, interpret test results, and direct care plans. More RN hours per day often signals stronger clinical oversight and faster response to health changes. 1h 51m per day
LPN / LVN Info Licensed Practical Nurses (LPNs) or Licensed Vocational Nurses (LVNs) deliver routine hands-on care — medication administration, wound dressing, and monitoring vital signs. They work under RN supervision and make up a large share of daily bedside care. 49m per day
Nurse Aide Info Certified Nurse Aides (CNAs) provide the most direct day-to-day assistance: bathing, dressing, feeding, and mobility. Nurse aide hours are typically the largest staffing category and directly affect residents' quality of life. 3h 41m per day
Weekend Total Nursing Info Combined nursing hours (RN + LPN + Nurse Aide) per resident per day on weekends. Staffing often drops on weekends — this figure reveals whether the facility maintains adequate coverage outside of weekday hours. 5h 46m per day
Physical Therapist Info Hours per resident per day provided by licensed Physical Therapists (PTs) or PT Assistants. PT services help residents recover mobility after injury or illness and are especially important for post-acute (short-stay) rehabilitation. 13m per day
Weekend RN Info Registered nurse hours specifically on weekends. Facilities sometimes reduce RN presence on Saturdays and Sundays — a low weekend RN figure compared to weekday hours can indicate reduced clinical oversight when most administrative staff are absent. 1h 17m per day

Capacity and availability

This home usually has availability

Lower occupancy than the state average
Occupancy rate
54% Rank #247 / 258Occupancy rate — State benchmarkedThis home is ranked 247th out of 258 homes in Florida. Shows this facility's occupancy rate versus the Florida average, with its Statewide rank out of 258. Higher occupancy signals strong local demand and financial stability.Rankings are based only on facilities in Florida that report data for that category. Facilities without available data are excluded from the ranking.Click the rank badge to see the full State ranking.Click here to see the full State ranking.
Avg. Length of Stay
164 days
Bed community size
84-bed community Rank #572 / 1074Bed count — State benchmarkedThis home is ranked 572nd out of 1074 homes in Florida. Shows this facility's certified or reported bed count compared to other Florida facilities. Larger communities may offer more amenities, programs, and on-site services for residents and families.Rankings are based only on facilities in Florida that report data for that category. Facilities without available data are excluded from the ranking.Click the rank badge to see the full State ranking.Click here to see the full State ranking.
A larger shared setting that may offer more common spaces and organized community services.
Walk Score
Walk Score: 29 / 100 Rank #933 / 1486Walk Score — State benchmarkedThis home is ranked 933rd out of 1486 homes in Florida. Shows how walkable this facility's neighborhood is compared to the average Walk Score across Florida facilities. Higher scores benefit residents, families, and staff.Rankings are based only on facilities in Florida that report data for that category. Facilities without available data are excluded from the ranking.Click the rank badge to see the full State ranking.Click here to see the full State ranking.
Somewhat walkable. A few nearby services may be reachable on foot, but most trips require transportation.
BBB Rating
BBB Rating: A+ (Not Accredited)
An independent rating from the Better Business Bureau based on factors such as complaint history, transparency, and business practices.
How BBB ratings work

Contact Vi at Bentley Village

Health Inspection History

Inspections since 2023
Total health inspections 2

State average N/A


Last Health inspection on Nov 2024

Total health citations
17 Rank #123 / 252Health citations — State benchmarkedThis home is ranked 123rd out of 252 homes in Florida. Shows this facility's total health deficiency citations benchmarked to the Florida State average, with a ranking across all 252 FL facilities. Lower citation counts earn a better rank.Rankings are based only on facilities in Florida that report data for that category. Facilities without available data are excluded from the ranking.Click the rank badge to see the full State ranking.Click here to see the full State ranking.

State average N/A

Citations per inspection
8.5 Rank #241 / 252Citations per inspection — State benchmarkedThis home is ranked 241st out of 252 homes in Florida. Shows average deficiency citations per CMS inspection for this facility versus the Florida mean across 252 facilities with citation data. Lower is better.Rankings are based only on facilities in Florida that report data for that category. Facilities without available data are excluded from the ranking.Click the rank badge to see the full State ranking.Click here to see the full State ranking.

State average N/A


Health citations are formal notices following inspections when they fail to comply with safety and care standards.

All 17 citations resulted from standard inspections.

Breakdown of citation severity (last 3 years)
Critical health citations
0
In line with State average

State average: N/A


Serious health citations
0
In line with State average

State average: N/A

0 critical citations State average: N/A

0 serious citations State average: N/A

17 moderate citations State average: N/A

0 minor citations State average: N/A
Citations history (last 3 years)
Administration moderate citation Nov 21, 2024
Corrected

Environmental moderate citation Nov 21, 2024
Corrected

Infection Control moderate citation Nov 21, 2024
Corrected

Nutrition moderate citation Nov 21, 2024
Corrected

Staffing Data

Reporting period: October 1 – December 31, 2025 (Q4 2025). Source: CMS Payroll-Based Journal report.

Total staff 157
Employees 114
Contractors 43
Staff to resident ratio 2.34 : 1
0% compared with State average

State average ratio: 0 : 0

Avg staff/day 56
Average shift 8.5 hours
0% compared with State average

State average: 0 hours

Total staff hours (quarter) 43,683

Nursing staff breakdown

Q4 2025 · Oct 1 – Dec 31 More info This data comes from the CMS Payroll-Based Journal report covering October 1 – December 31, 2025.
Registered Nurse

Manages medical care and health needs.

RN Staff Info 31 total: 26 full-time employees and 5 contractors. 31
Average shift length Info Average shift length. Calculated as total hours divided by days worked and average staff per day. 9.1 hours
Licensed Practical Nurse

Assists with medical care and medications.

LPN Staff Info 19 total: 13 full-time employees and 6 contractors. 19
Average shift length Info Average shift length. Calculated as total hours divided by days worked and average staff per day. 9.7 hours
Certified Nursing Assistant

Helps with daily care and mobility.

CNA Staff Info 60 total: 55 full-time employees and 5 contractors. 60
Average shift length Info Average shift length. Calculated as total hours divided by days worked and average staff per day. 9.3 hours

Contractor staffing

Q4 2025 · Oct 1 – Dec 31 More info This data comes from the CMS Payroll-Based Journal report covering October 1 – December 31, 2025.

Total hours from contractors

9.9%

4,339 contractor hours this quarter

Respiratory Therapy Technician: 10 Licensed Practical Nurse: 6 Physical Therapy Assistant: 6 Certified Nursing Assistant: 5 Registered Nurse: 5 Physical Therapy Aide: 4 Speech Language Pathologist: 3 Qualified Social Worker: 2 Medical Director: 1 Occupational Therapy Assistant: 1

Staff by category

Q4 2025 · Oct 1 – Dec 31 More info This data comes from the CMS Payroll-Based Journal report covering October 1 – December 31, 2025.
Certified Nursing Assistant5556021,60692100%9.3
Registered Nurse265315,93992100%9.1
Licensed Practical Nurse136194,74792100%9.7
Clinical Nurse Specialist9094,00492100%8.7
Respiratory Therapy Technician010101,2498491%4.8
Other Dietary Services Staff3039769098%7.4
Nurse Practitioner2029306672%7.5
Physical Therapy Assistant0669118997%6.9
Physical Therapy Aide0447206571%7.1
Mental Health Service Worker1014586166%7.5
Dental Services Staff1014506065%7.5
Qualified Social Worker0224346166%7
Administrator2024135358%7.5
Speech Language Pathologist0333936368%3
Dietitian1011952628%7.5
Occupational Therapy Aide1011792426%7.4
Medical Director011601921%3.2
Occupational Therapy Assistant0112189%2.6
60 Certified Nursing Assistant
% of Days 100%
31 Registered Nurse
% of Days 100%
19 Licensed Practical Nurse
% of Days 100%
9 Clinical Nurse Specialist
% of Days 100%
10 Respiratory Therapy Technician
% of Days 91%
3 Other Dietary Services Staff
% of Days 98%
2 Nurse Practitioner
% of Days 72%
6 Physical Therapy Assistant
% of Days 97%
4 Physical Therapy Aide
% of Days 71%
1 Mental Health Service Worker
% of Days 66%
1 Dental Services Staff
% of Days 65%
2 Qualified Social Worker
% of Days 66%
2 Administrator
% of Days 58%
3 Speech Language Pathologist
% of Days 68%
1 Dietitian
% of Days 28%
1 Occupational Therapy Aide
% of Days 26%
1 Medical Director
% of Days 21%
1 Occupational Therapy Assistant
% of Days 9%

Penalties and fines

Federal penalties imposed by CMS for regulatory violations, including civil money penalties (fines) and denials of payment for new Medicare/Medicaid admissions.

Source: CMS Penalties Database

No penalties in the past 3 years

No civil money penalties or payment denials were reported in the last 3 years.

Quality of care over time

These measures show how residents usually do over time at this home, based on health outcomes and preventive care.

High-risk clinical events score Info A composite score based on pressure ulcers, falls with injury, weight loss, walking ability decline, and activities of daily living decline. 11.7
58% worse than State average

State average: 7.4

Functional decline score Info A composite score based on activities of daily living decline, walking ability decline, and incontinence. 22.5
82% worse than State average

State average: 12.4

Long-stay resident measures
Need for Help with Daily Activities Increased Info Percent of long-stay residents whose need for help with daily activities has increased 17.6%
68% worse than State average

State average: 10.5%

Walking Ability Worsened Info Percent of long-stay residents whose ability to move independently worsened 22.2%
71% worse than State average

State average: 12.9%

Low Risk Residents with Bowel/Bladder Incontinence Info Percent of low risk long-stay residents who lose control of their bowels or bladder 27.7%
105% worse than State average

State average: 13.5%

Falls with Major Injury Info Percent of long-stay residents experiencing one or more falls with major injury 6.7%
154% worse than State average

State average: 2.6%

High Risk Residents with Pressure Ulcers Info Percent of long-stay high risk residents with pressure ulcers 5.6%
5% worse than State average

State average: 5.4%

Urinary Tract Infection Info Percent of long-stay residents with a urinary tract infection 1.9%
113% worse than State average

State average: 0.9%

Lost Too Much Weight Info Percent of long-stay residents who lose too much weight 6.4%
6% worse than State average

State average: 6.0%

Depressive Symptoms Info Percent of long-stay residents who have depressive symptoms 0.0%
100% better than State average

State average: 3.3%

Antipsychotic Use Info Percent of long-stay residents who received an antipsychotic medication 11.6%
44% worse than State average

State average: 8.0%

Pneumococcal Vaccine Info Percent of long-stay residents assessed and appropriately given the pneumococcal vaccine 99.4%
In line with State average

State average: 97.7%

Influenza Vaccine Info Percent of long-stay residents assessed and appropriately given the seasonal influenza vaccine 94.1%
5% worse than State average

State average: 99.2%

Short-stay resident measures
Pneumococcal Vaccine Info Percent of short-stay residents assessed and appropriately given the pneumococcal vaccine 98.9%
5% better than State average

State average: 94.0%

Antipsychotic medication increase Info Percent of short-stay residents who newly received an antipsychotic medication 0.8%
46% better than State average

State average: 1.5%

Influenza Vaccine Info Percent of short-stay residents assessed and appropriately given the seasonal influenza vaccine 95.0%
In line with State average

State average: 94.7%

Breakdown by payment type

Medicare

61% of new residents, usually for short-term rehab.

Typical stay 1 - 2 months

Private pay

39% of new residents, often for short stays.

Typical stay 1 years

Facility Characteristics

Source: CMS Long-Term Care Facility Characteristics (Data as of Jan 2026)

Total residents 67
Medicare
19
28.4% of residents
Private pay or other
48
71.6% of residents
Programs & Services
Residents Group

Residents meet regularly to discuss policies, care quality, and activities

CCRC

Part of a Continuing Care Retirement Community offering multiple care levels

Active Resident Council

Organized group of residents that meets regularly to discuss facility policies, quality of life, and activities.

Finances and operations

Based on CMS SNF Cost Report for fiscal year ending in 12/2023.

For-profit
Corporation
Net patient revenue Info Net patient revenue — what the home actually collects for resident care, after contractual allowances, bad debt and discounts are subtracted from its gross charges (CMS cost report, Worksheet G-3). It covers resident care only; money the home earns from other sources is shown separately as "Other income."
$11.7M
Net patient income Info Net patient income: net patient revenue minus the home's total operating expenses. A positive figure means it earns more from resident care than it spends to deliver it; a negative figure means the opposite. It excludes non-operating "other income."
-$15.5M
For-profit Corporation
Net patient revenue Info Net patient revenue — what the home actually collects for resident care, after contractual allowances, bad debt and discounts are subtracted from its gross charges (CMS cost report, Worksheet G-3). It covers resident care only; money the home earns from other sources is shown separately as "Other income."
$11.7M Rank #3 / 257Revenue — State benchmarkedThis home is ranked 3rd out of 257 homes in Florida. Shows this facility's annual revenue compared to the Florida average. Higher revenue generally means more resources for staffing and capital — read alongside Payroll %.Rankings are based only on facilities in Florida that report data for that category. Facilities without available data are excluded from the ranking.Click the rank badge to see the full State ranking.Click here to see the full State ranking.
Net patient income Info Net patient income: net patient revenue minus the home's total operating expenses. A positive figure means it earns more from resident care than it spends to deliver it; a negative figure means the opposite. It excludes non-operating "other income."
-$15.5M
Other income Info Money the home earns outside of resident care — such as investments, grants, rentals and other non-operating sources (CMS cost report, Worksheet G-3). It is tracked separately from net patient revenue: it is not part of that figure, and it is not included in net patient income.
$62.9M
Payroll costs Info Staff salaries plus wage-related costs — benefits such as payroll taxes, health insurance and retirement — from the home's own accounting records (CMS cost report, Worksheet A). Contract or agency labor is counted separately, under other operating costs. Rank #97 / 257Payroll — State benchmarkedThis home is ranked 97th out of 257 homes in Florida. Shows total annual staff payroll benchmarked to the Florida average. Higher payroll investment relative to peers often signals better staffing and less reliance on cheaper contract labor.Rankings are based only on facilities in Florida that report data for that category. Facilities without available data are excluded from the ranking.Click the rank badge to see the full State ranking.Click here to see the full State ranking.
$8.9M 76.3% of net patient revenue Info Payroll as a share of revenue: staff salaries and wage-related benefits divided by net patient revenue. A higher figure means more of each revenue dollar goes to staff pay. Rank #257 / 257Payroll % — State benchmarkedThis home is ranked 257th out of 257 homes in Florida. Shows payroll as a percentage of revenue versus the Florida average. Well-run Florida facilities typically land around 49–56% — the top third Statewide. Below 25% may signal understaffing or heavy agency use — read with Staffing ratings.Rankings are based only on facilities in Florida that report data for that category. Facilities without available data are excluded from the ranking.Click the rank badge to see the full State ranking.Click here to see the full State ranking.
Other operating costs Info Everything it costs to run the home apart from payroll — food, utilities, supplies, maintenance, contract labor and administration. Calculated as total operating expense minus payroll (staff salaries and wage-related benefits).
$18.3M
Total costs Info The home's total operating expense for the year — all the costs of running it, salaries included (CMS cost report, Worksheet G-3).
$27.2M

What does this home offer?

Pets allowed icon
Pets allowed icon

Pets Allowed

Room sizes icon
Room sizes icon

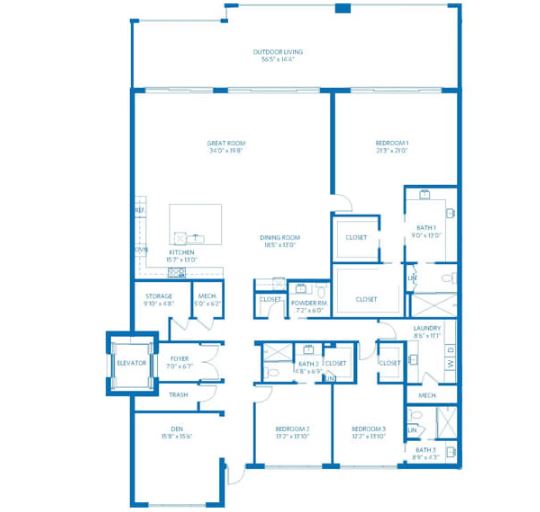
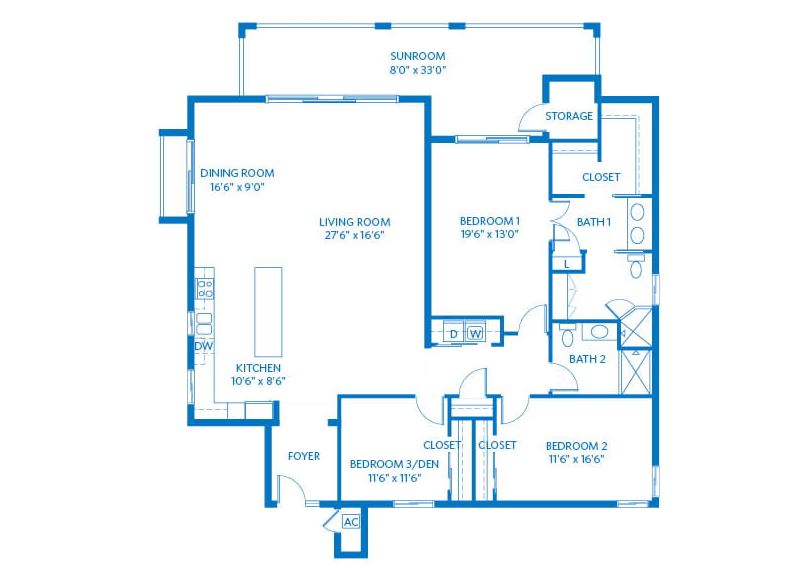
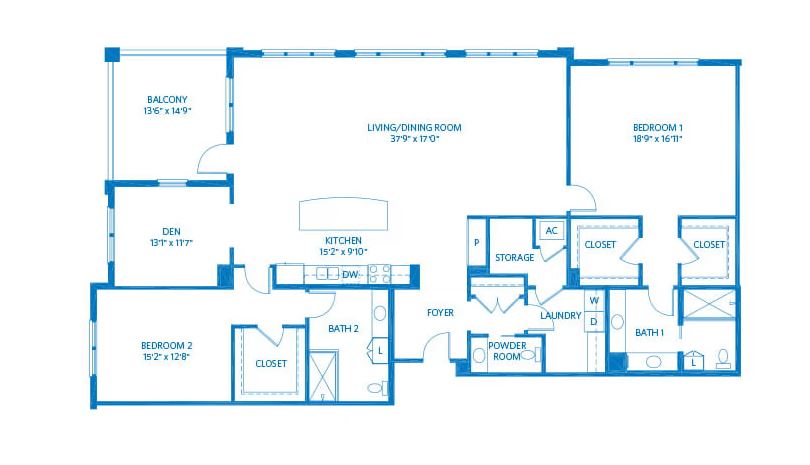
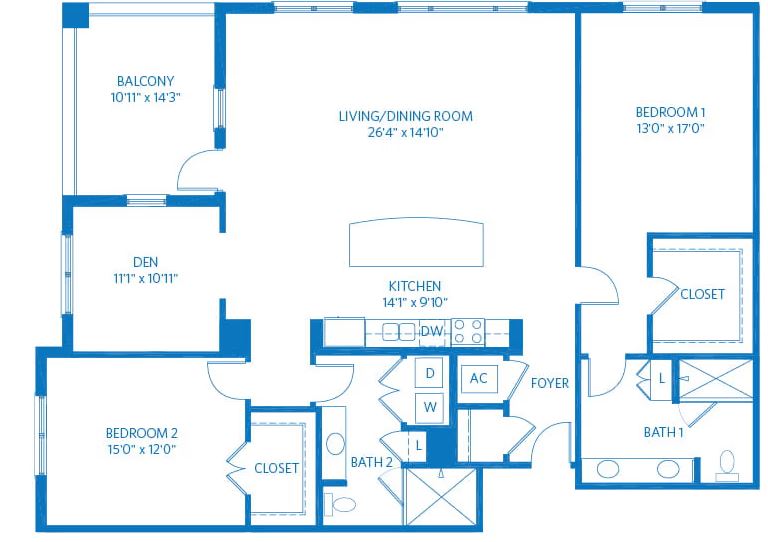
Room Sizes: 827 / 1,218 - 2,650 / 2,140 - 4,514 sq. ft

Housing options icon

Housing Options: 1 Bed / 2 Bed / 3 Bed

Building type icon
Building type icon

Building Type: 3-story

Transportation services icon

Transportation Services

Fitness and recreation icon

Fitness and Recreation

Who this home usually serves

TYPE OF STAY

Mostly short-term rehab stays

Most residents typically stay for a few weeks or months before returning home or moving on.

Most new residents arrive under Medicare (61% of admissions), and a typical Medicare stay runs around 1 - 2 months.

Admissions
114 total

Coverage residents most often arrive under.

Medicare 61%
Private pay 39%
Discharges
120 total

Coverage residents most often leave under.

Medicare 41%
Private pay 59%

Living Spaces & Floor Plans for Vi at Bentley Village

3 bedroom
3 bedroom
2 bedroom
2 bedroom

Places of interest near Vi at Bentley Village

Address 850 Retreat Dr, Naples, FL 34110 — 2.5 miles to nearest hospital (NCH North Naples Hospital)

Calculate Travel Distance to Vi at Bentley Village

Add your location

Address

Compare Nursing Homes around the area

The information below is reported by the Florida Agency for Health Care Administration (AHCA).

Vi at Bentley Village
NH
AL
IL
Naples (North Naples) -84 A+ 29 1 Bed / 2 Bed / 3 Bed
Terracina Grand
NH
AL
IL
MC
RC
Naples -200 A+ 12 Studio / 1 Bed / 2 Bed
Brookdale DeLand
NH
AL
MC
Deland (Scarlett) -89 A+ 14 Studio / Suite
The Oaks of Clearwater
NH
AL
IL
MC
Clearwater (Oak Bluffs) -175 B- 64 Studio / 1 Bed / 2 Bed
The Bridge at Ocala
NH
AL
Ocala -95 A+ 44 Studio / 1 Bed

Frequently Asked Questions about Vi at Bentley Village

What neighborhood is Vi at Bentley Village in?

Vi at Bentley Village is in the North Naples neighborhood of Naples.

Is Vi at Bentley Village in a walkable area?

Vi at Bentley Village has a walk score of 29. Somewhat walkable. A few nearby services may be reachable on foot, but most trips require transportation.

What is the occupancy rate at Vi at Bentley Village?

Vi at Bentley Village's occupancy is 54.0%.

Does Vi at Bentley Village operate as a for-profit or non-profit?

Vi at Bentley Village is registered as a for-profit in FL.

Are there photos of Vi at Bentley Village?

Yes — there are 4 photos of Vi at Bentley Village in the photo gallery on this page.

What is the address of Vi at Bentley Village?

Vi at Bentley Village is located at 850 Retreat Dr, Naples, FL 34110.

What is the phone number of Vi at Bentley Village?

(239) 431-2133 will put you in contact with the team at Vi at Bentley Village.

Guides for Better Senior Living

Care Cost Calculator: See Prices in Your Area

Nursing Home Data Explorer

Don’t Wait Too Long: 7 Red Flag Signs Your Parent Needs Assisted Living Now

The True Cost of Assisted Living in 2025 – And How Families Are Paying For It

Understanding Senior Living Costs: Pricing Models, Discounts & Financial Assistance