Explore Open Rooms

1 Contact details
2 What type of senior care service are you looking for?
3 What budget do you have in mind for senior care?
4 How soon do you need to find care?
5 Additional details

Thank you for your interest!

Our team will be in touch shortly to help with next steps.

Nursing Home in Mecklenburg County

CMS overall rating Info The Overall CMS Rating combines results from health inspections, staffing levels and quality measures. Health inspections carry the most weight. Staffing and quality scores can increase or decrease the final rating based on performance compared to state and national standards.

Clear Creek Nursing and Rehabilitation Center

10506 Clear Creek Commerce Dr, Mint Hill, NC 28227 View map
Overview of Clear Creek Nursing and Rehabilitation Center

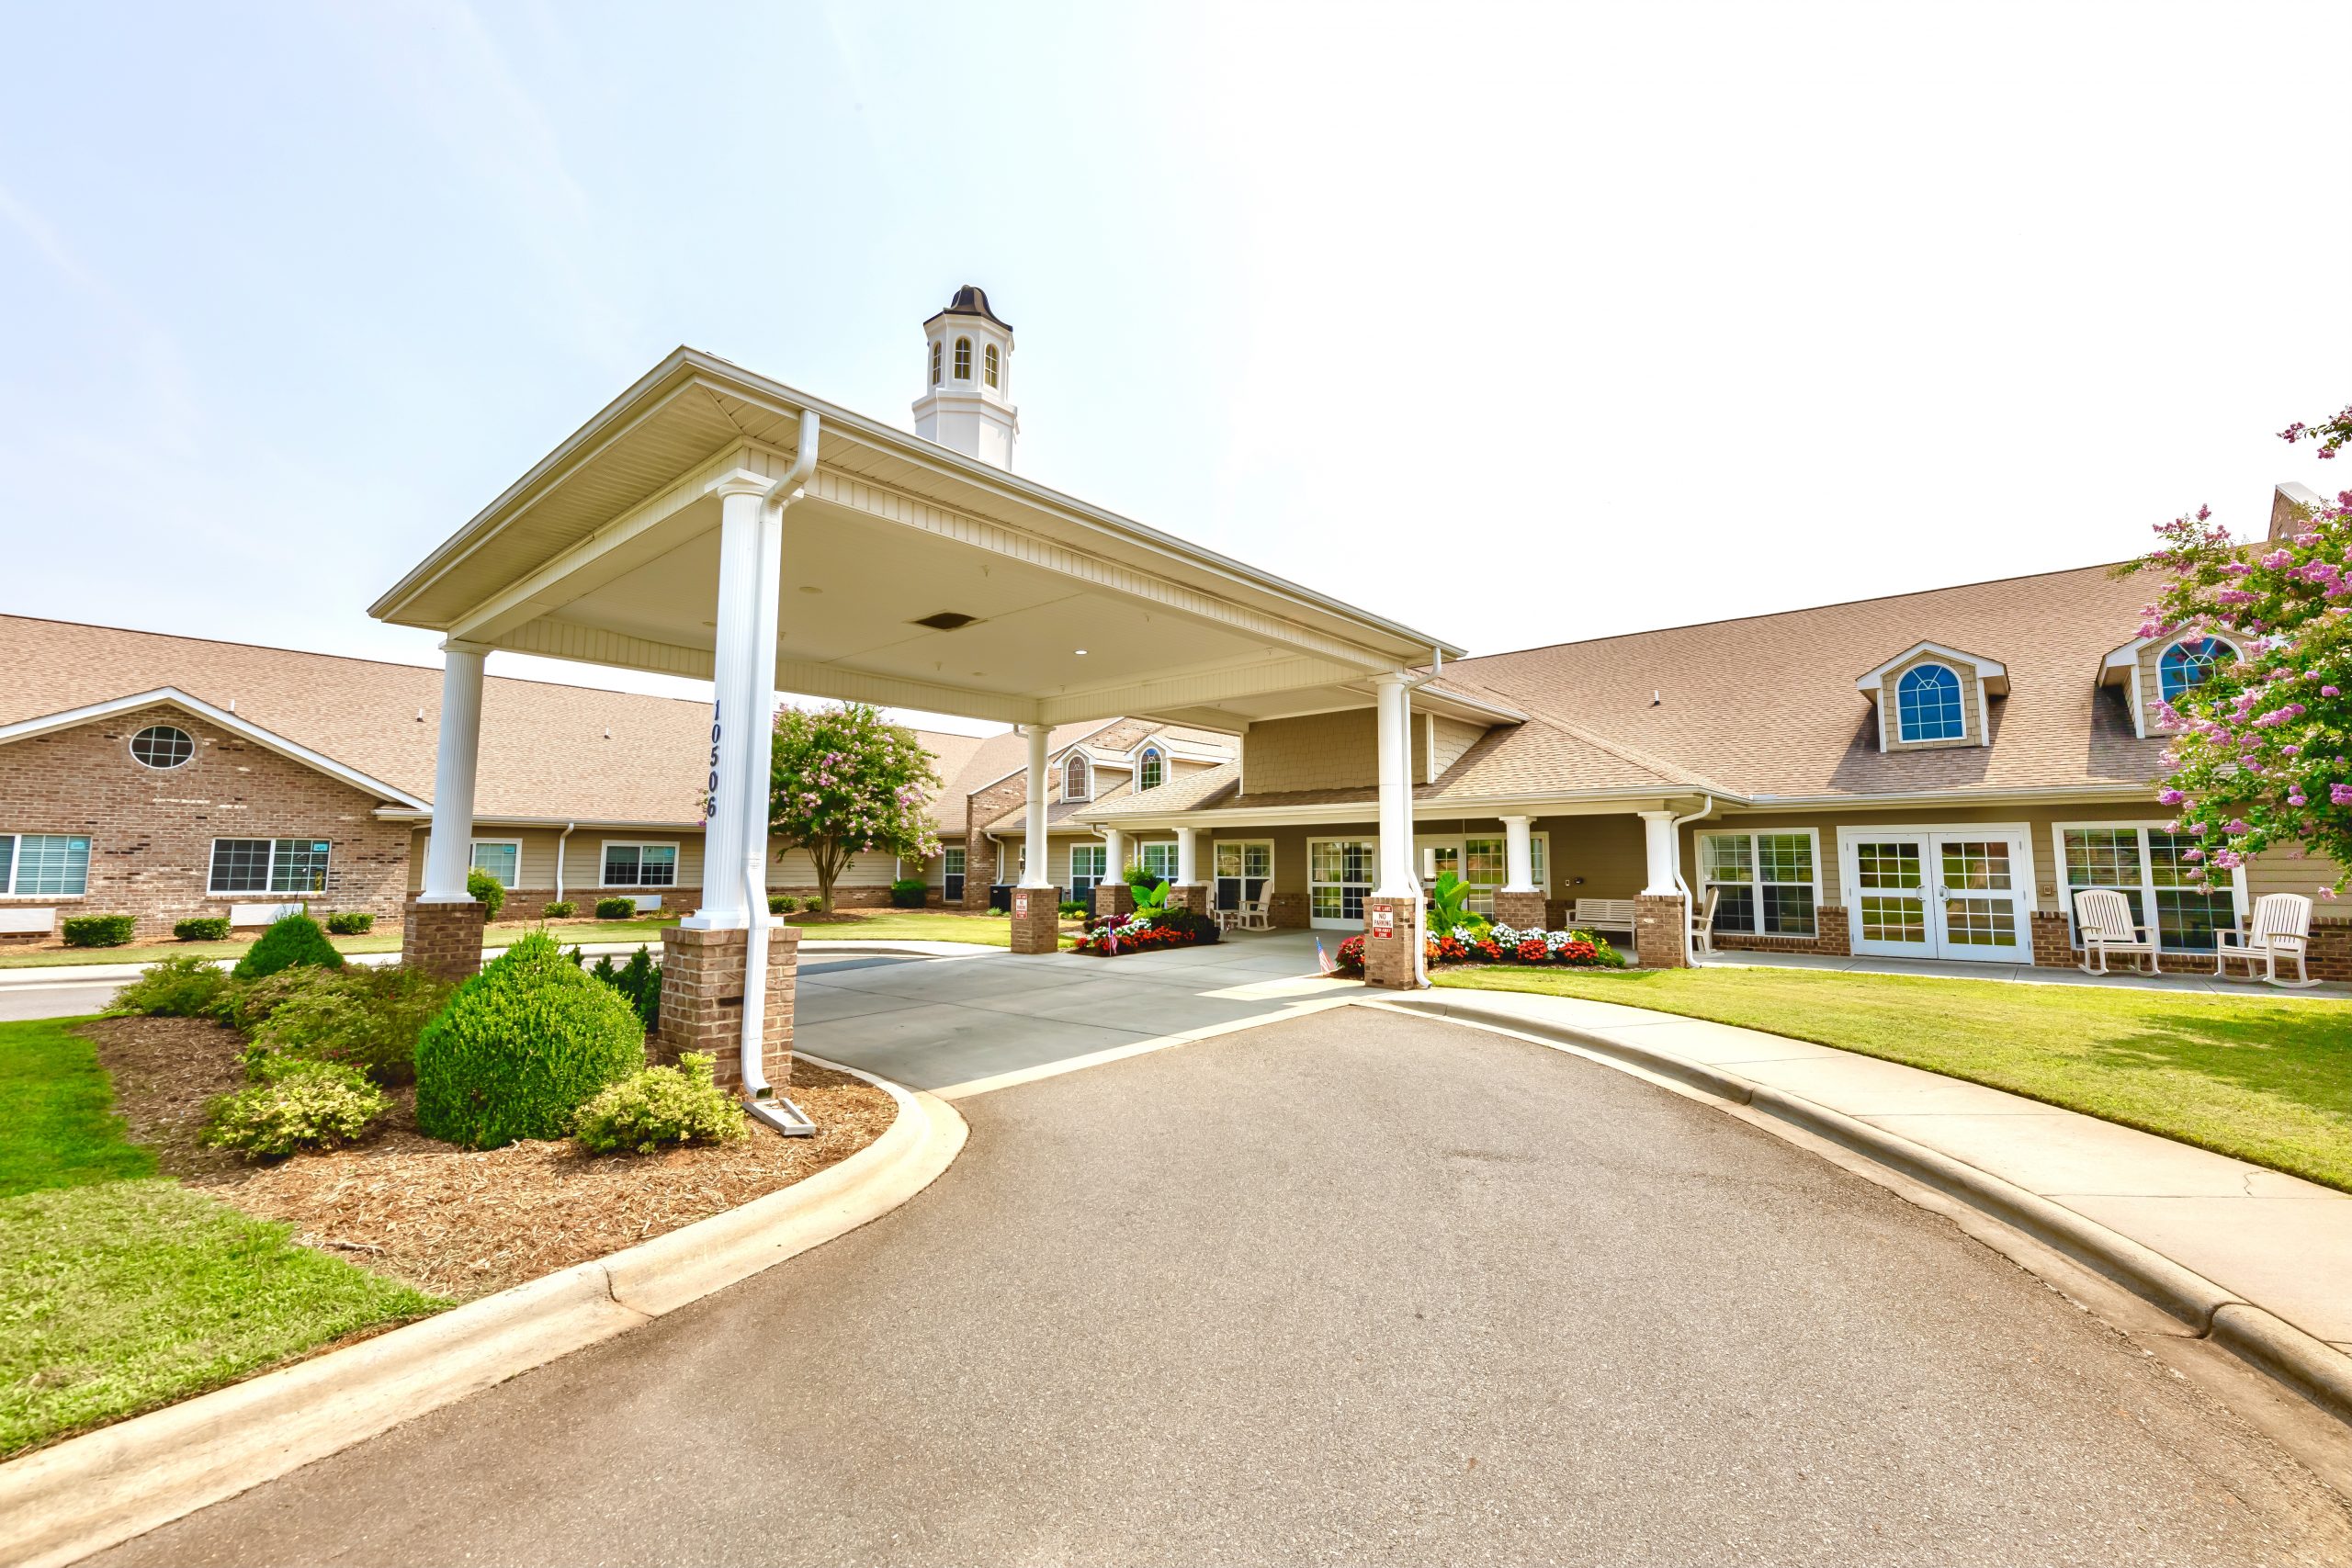
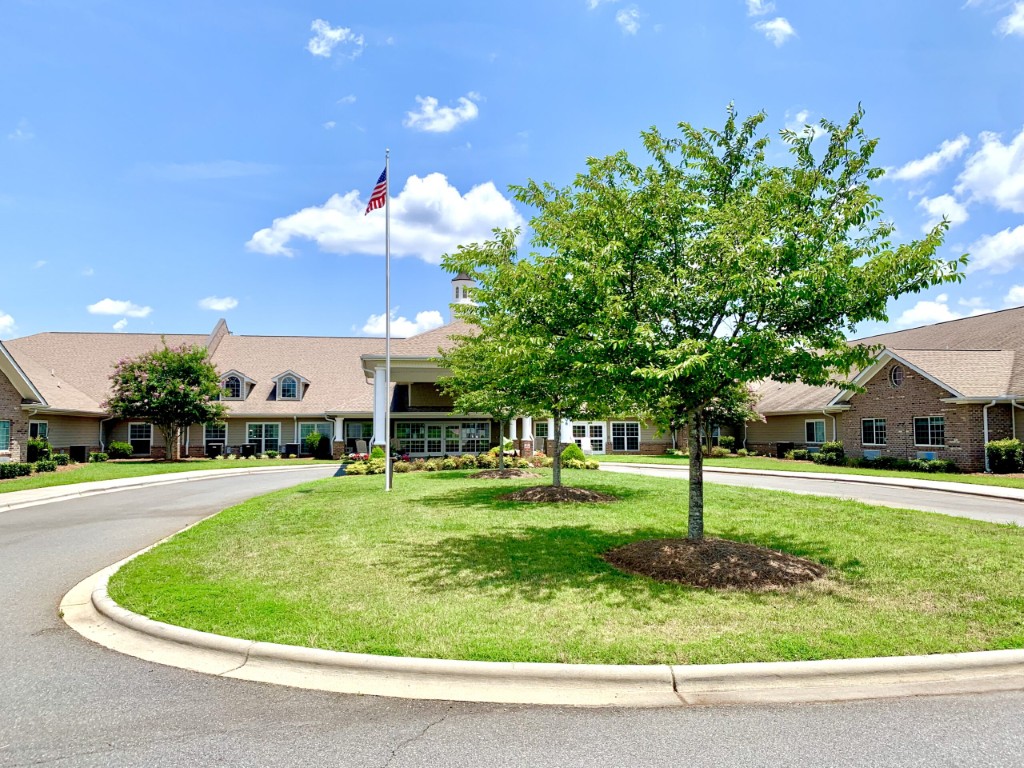
Maintain the skills you need to continue enjoying life in Clear Creek Nursing and Rehabilitation Center, a reliable and welcoming community in Mint Hill, NC for short-term and long-term care. Here, residents’ needs are met with compassionate and dignified care and assistance from an interdisciplinary care team. The community features a team of RNS, LPNs, therapists, dieticians, activity directors, and a community-based chaplain to ensure residents’ physical, social, nutritional, and mental health needs are met.

As a community surrounded by nature, lush trees, and vast green spaces, Clear Creek Nursing and Rehabilitation Center provides a healing and relaxing environment for maintaining your well-being. Fun opportunities for fitness, socialization, and hobbies are also available to keep residents active, connected, and entertained. Proper nourishment is also guaranteed with fresh and healthy meals served daily. Here, they go above and beyond in providing a nurturing environment that promotes overall wellness.

(704) 545-2377

Managed by Marissa McNally

Administrator

Marissa McNally leads Clear Creek Nursing & Rehab with dedication and compassion. Her journey in long-term care began during the Covid-19 pandemic, progressing from Personal Care Assistant to Medication Aide. She earned her MBA and licensure to oversee skilled nursing facilities in North Carolina. Marissa brings a fresh perspective and vibrant energy, committed to serving residents with genuine care and respect.

Quality ratings

Measured by Centers for Medicare & Medicaid Services (CMS)

Overall rating Info The Overall CMS Rating combines results from health inspections, staffing levels and quality measures. Health inspections carry the most weight. Staffing and quality scores can increase or decrease the final rating based on performance compared to state and national standards.
1/5
North Carolina average: 3.0/5
Health Inspection Info Based on the results of the facility's three most recent standard inspections and any complaint investigations. CMS reviews the number, scope, and severity of deficiencies, with more recent findings weighted more heavily.
2/5
North Carolina average: 3.4/5
Staffing Info Measures average nursing staff hours per resident per day, including Registered Nurses (RNs) and total nursing staff. Ratings are adjusted based on the level of care residents require and are compared to state and national benchmarks.
4/5
North Carolina average: 3.3/5
Quality Measures Info Based on clinical and physical health indicators reported to CMS, such as hospital readmissions, falls, pressure ulcers, and improvements in mobility. These measures reflect how well residents' health needs are being managed.
1/5
North Carolina average: 3.6/5

Nursing care per resident

Info This shows how many total hours of nursing staff time are available per resident each day. Higher numbers usually mean more staff support.
4h 42m per day

This home provides 4% less nursing time per resident than the North Carolina average.

North Carolina average: 4h 55m per day

Staffing hours breakdown

Info Hours of care per resident per day, broken down by staff type. Data from CMS Medicare.
Staff type Facility State avg National avg
Registered Nurse (RN) Info Registered nurse hours per resident per day. 41m per day 35m per day 41m per day
Nurse Aide Info Nurse aide hours per resident per day. 2h 38m per day 2h 19m per day 2h 21m per day
Total Nursing (Weekend) Info Total number of nurse staff hours per resident per day on weekends. 3h 45m per day 3h 20m per day 3h 26m per day
Physical Therapist Info Physical therapist staff hours per resident per day. 3m per day 5m per day 4m per day
RN (Weekend) Info Registered nurse hours per resident per day on weekends. 22m per day 23m per day 29m per day

Capacity and availability

Medium-capacity home

Offers a balance of services and community atmosphere.

Total beds 120

This home usually has availability

Lower occupancy suggests more openings may be available.

Lower demand than the North Carolina average
Occupancy rate 69.6%
Residents per day (avg) 106
Occupancy rate
69.6%
Residents per day (avg)
106

Who this home usually serves

TYPE OF STAY

Primarily short stays

Residents typically stay for brief periods, with frequent admissions and discharges throughout the year.

Might be optimal for
Post-acute recovery Temporary care Transitional stays

Breakdown by payment type

Medicare

24% of new residents, usually for short-term rehab.

Typical stay 1 - 2 months

Private pay

66% of new residents, often for short stays.

Typical stay 2 months

Medicaid

10% of new residents, often for long-term daily care.

Typical stay 2 years

Finances and operations

Privately-owned community
Operated by a business corporation.
Home revenue
$11.5M
Profit
$160.1K
Privately-owned community Operated by a business corporation.
Home revenue
$11,452,715.00
Profit
$160,123.00
Payroll costs Info The portion of the home's budget spent on staff, including nurses, caregivers, and other employees who support care and operations.
$2.9M
25.7% of revenue
Other operating costs Info All remaining costs needed to run the home, such as food, utilities, building maintenance, supplies and administrative expenses.
$8.4M
Total costs $11.3M
Walk Score
Walk Score: 5 / 100
Car-dependent. Most errands require a car, with limited nearby walkable options.

About this community

Additional licensing details

CMS Certification Number: 345562

Safety & Compliance

Staffing

Key information about the people who lead and staff this community.

Leadership

Contact: Mr. Phillip Hill, Vice President of Operations

Care Services

Nursing Services
Rehabilitation Services
Licensed Nurses/CNAs
24-Hour Staffing
Short-Term Rehab

All Levels of Care

Short-Term Care
Long-Term Care

Amenities & Lifestyle

Private & Semi-Private Rooms
Nurse Stations Assigned To Each Hall
Lounge And Activity Areas
Engaging Social Activities And Events
Inclusive Pricing For Cable & Secure Wi-Fi
Daily Housekeeping
Linen Service
Personal Laundry
And Trash Removal
Beauty Salon

Programs & Activities

Activities
Engaging social activities and events are provided for residents.
Specific Programs
Short-term Care & Rehabilitation, Long-term Care, Principle Therapy Services, Family & Caregiver Resources, Provider Resources, Careers, Make a Payment, Schedule a Tour
Operating Hours
24/7

Dining & Nutrition

Food Description
Clear Creek Nursing & Rehabilitation Center provides a nourishing, tasteful, well-balanced diet that meets the daily nutritional and special dietary needs of each resident.

What does this home offer?

Housing options icon

Housing Options: Private / Semi-Private Rooms

Building type icon
Building type icon

Building Type: Single-story

Dining services icon

Dining Services

Beauty services icon

Beauty Services

Transportation services icon

Transportation Services

Housekeeping icon
Housekeeping icon

Housekeeping Services

Recreational activities icon

Recreational Activities

Exercise program icon

Exercise Programs

Health Programs icon

Health Programs

Types of Care at Clear Creek Nursing and Rehabilitation Center

Nursing Home
Contact Clear Creek Nursing and Rehabilitation Center

Inspection History

In North Carolina, the Department of Health and Human Services, Division of Health Service Regulation conducts unannounced surveys to ensure nursing and adult care homes meet safety standards.

6 visits/inspections

5 visits/inspections triggered by complaints

1 routine inspections

1 other visits

Results

6 with issues

0 without issues

Latest inspection

Date March 21, 2025
Complaint Investigation

40 deficiencies

Deficiencies indicate regulatory issues. A higher number implies the facility had several areas requiring improvement.

North Carolina average: 46 deficiencies

Health Inspection History

Inspections
Total health inspections 5

North Carolina average 4


Last Health inspection on Mar 2025

Total health citations 40

North Carolina average 20.9

Citations per inspection
8

North Carolina average 4.99


Health citations are formal notices following inspections when they fail to comply with safety and care standards.

32 of 40 citations resulted from standard inspections; 6 of 40 resulted from complaint investigations; and 2 of 40 came from combined inspections (standard and complaint).

Breakdown of citation severity (last 3 years)
Critical Health citations More info 1
23% better than North Carolina average

North Carolina average: 1.3


Serious Health citations More info 4
344% worse than North Carolina average

North Carolina average: 0.9

1 critical citation More info North Carolina average: 1.3

4 serious citations More info North Carolina average: 0.9

33 moderate citations More info North Carolina average: 17.1

2 minor citations More info North Carolina average: 1.6
Citations history (last 3 years)
Infection Control moderate citation Info Issues related to preventing and controlling infections, including hygiene practices and safety protocols. Mar 21, 2025
Corrected

Nursing Services moderate citation Info Issues related to the availability and quality of nursing staff and the care they provide. Mar 21, 2025
Corrected

Quality of Care moderate citation Info Issues related to how well residents receive appropriate treatment and support for their medical and daily care needs. Mar 21, 2025
Corrected

Quality of Care moderate citation Info Issues related to how well residents receive appropriate treatment and support for their medical and daily care needs. Mar 21, 2025
Corrected

Compare Nursing Homes around Mecklenburg County The information below is reported by the North Carolina Department of Health and Human Services, Division of Health Service Regulation.

5 facilities compared · CMS & NC Dept. of Health data · Updated Apr 2026

Filter by care type
Pineville Rehabilitation & Living Center
AL

Assisted Living A licensed, long-term care setting for seniors or individuals with disabilities who need help with daily activities — like bathing, dressing, and medication management — but not 24-hour skilled nursing. Offers housing, meals, and around-the-clock support while aiming to maximize resident independence.

HC

Home Care Professional care delivered in the person's own home — from companionship and errands to skilled nursing and therapy. Allows seniors to age in place. Medicare covers skilled home health when medically necessary.

NH

Nursing Home Licensed facility providing 24/7 skilled nursing care for residents with complex, ongoing medical needs. Staffed by RNs, LPNs, and CNAs. Inspected and star-rated annually by CMS. Accepts Medicare (short-term rehab) and Medicaid (long-term care).

RC

Respite Care Short-term temporary care — days to weeks — to give family caregivers a break. Full care provided during the stay. Often used after hospitalization or to trial a facility before a permanent placement decision.

Pineville
106
68.3%
-11%
3.96
+118%
0%
3
45
9.0
3
84
A+
25
Ncnh Holdings Llc
$11.9M
$3.2M
26.8%
345415
Private / Semi-Private Rooms
University Place Nursing & Rehabilitation
MC

Memory Care Secured, specialized care for people living with Alzheimer's or dementia. Staff trained in cognitive impairment, with higher staff-to-resident ratios and an environment designed to reduce confusion and wandering risk.

NH

Nursing Home Licensed facility providing 24/7 skilled nursing care for residents with complex, ongoing medical needs. Staffed by RNs, LPNs, and CNAs. Inspected and star-rated annually by CMS. Accepts Medicare (short-term rehab) and Medicaid (long-term care).

Charlotte (University City North)
217
68.1%
-11%
4.12
-29%
+4%
2
35
5.0
2
162
A+
29
-
$17.1M
$6.1M
35.9%
345142
Private / Semi-Private Rooms
Clear Creek Nursing and Rehabilitation Center
NH

Nursing Home Licensed facility providing 24/7 skilled nursing care for residents with complex, ongoing medical needs. Staffed by RNs, LPNs, and CNAs. Inspected and star-rated annually by CMS. Accepts Medicare (short-term rehab) and Medicaid (long-term care).

Mint Hill
120
69.6%
-9%
4.71
+20%
+18%
3
40
8.0
5
106
-
5
Anderson, Coleen
$11.2M
$2.9M
26.3%
345562
Private / Semi-Private Rooms
The Stewart Health Center
AL

Assisted Living A licensed, long-term care setting for seniors or individuals with disabilities who need help with daily activities — like bathing, dressing, and medication management — but not 24-hour skilled nursing. Offers housing, meals, and around-the-clock support while aiming to maximize resident independence.

MC

Memory Care Secured, specialized care for people living with Alzheimer's or dementia. Staff trained in cognitive impairment, with higher staff-to-resident ratios and an environment designed to reduce confusion and wandering risk.

NH

Nursing Home Licensed facility providing 24/7 skilled nursing care for residents with complex, ongoing medical needs. Staffed by RNs, LPNs, and CNAs. Inspected and star-rated annually by CMS. Accepts Medicare (short-term rehab) and Medicaid (long-term care).

Charlotte (Beverly Woods)
-
78.2%
+2%
-
-
-
1
0
0.0
0
56
-
15
The Cypress Of Charlotte Llc
$10.9M
$12.9M
118.4%
345495
Private / Shared Rooms
Myers Park Nursing Center
-
NH

Nursing Home Licensed facility providing 24/7 skilled nursing care for residents with complex, ongoing medical needs. Staffed by RNs, LPNs, and CNAs. Inspected and star-rated annually by CMS. Accepts Medicare (short-term rehab) and Medicaid (long-term care).

Charlotte (Myers Park)
-
-
-
-
-
-
-
-
-
0
0
0.0
0
-
A+
83
-
-
-
-
-
Private Suite

Places of interest near Clear Creek Nursing and Rehabilitation Center

Address 4.4 miles from city center

Address 10506 Clear Creek Commerce Dr, Mint Hill, NC 28227

Calculate Travel Distance to Clear Creek Nursing and Rehabilitation Center

Add your location

Address

Staffing Data (Q2 2025)

This data corresponds to Q2 2025 and is based on CMS Payroll-Based Journal.

Total staff 167
Employees 161
Contractors 6
Staff to resident ratio 1.61:1
13% worse than North Carolina average

North Carolina average ratio: 1.85:1

Avg staff/day 59
Average shift 8.9 hours
11% better than North Carolina average

North Carolina average: 8 hours

Total staff hours (quarter) 47,674
Nursing staff breakdown
Registered Nurse

Manages medical care and health needs.

Total count 18
Average shift length Info Average shift length. Calculated as total hours divided by days worked and average staff per day. 9.6 hours

This role is partially covered by contractors.

Licensed Practical Nurse

Assists with medical care and medications.

Total count 24
Average shift length Info Average shift length. Calculated as total hours divided by days worked and average staff per day. 9.7 hours

No contractors work on this role.

Certified Nursing Assistant

Helps with daily care and mobility.

Total count 71
Average shift length Info Average shift length. Calculated as total hours divided by days worked and average staff per day. 9.3 hours

No contractors work on this role.

Contractor staffing

Total hours from contractors

1%

482 contractor hours this quarter

Registered Nurse: 2 Occupational Therapy Aide: 2 Medical Director: 1 Occupational Therapy Assistant: 1
Staff by category
Certified Nursing Assistant7107120,87591100%9.3
Licensed Practical Nurse240246,46191100%9.7
Registered Nurse162186,13691100%9.6
Medication Aide/Technician110114,17991100%10.1
Speech Language Pathologist110112,0738897%6.9
Clinical Nurse Specialist3031,1186673%8.6
Physical Therapy Aide4049527178%7.3
Physical Therapy Assistant3038687380%7
RN Director of Nursing2028617279%7
Administrator2028566571%8
Qualified Social Worker7077976673%5.9
Dietitian1015086875%7.5
Nurse Practitioner1015046369%8
Mental Health Service Worker1014956167%8.1
Respiratory Therapy Technician3034596268%7.2
Other Dietary Services Staff1012526066%4.2
Occupational Therapy Aide0221621719%7.7
Medical Director011623134%2
Occupational Therapy Assistant0115778%8.1
71 Certified Nursing Assistant
% of Days 100%
24 Licensed Practical Nurse
% of Days 100%
18 Registered Nurse
% of Days 100%
11 Medication Aide/Technician
% of Days 100%
11 Speech Language Pathologist
% of Days 97%
3 Clinical Nurse Specialist
% of Days 73%
4 Physical Therapy Aide
% of Days 78%
3 Physical Therapy Assistant
% of Days 80%
2 RN Director of Nursing
% of Days 79%
2 Administrator
% of Days 71%
7 Qualified Social Worker
% of Days 73%
1 Dietitian
% of Days 75%
1 Nurse Practitioner
% of Days 69%
1 Mental Health Service Worker
% of Days 67%
3 Respiratory Therapy Technician
% of Days 68%
1 Other Dietary Services Staff
% of Days 66%
2 Occupational Therapy Aide
% of Days 19%
1 Medical Director
% of Days 34%
1 Occupational Therapy Assistant
% of Days 8%

Facility Characteristics

Source: CMS Long-Term Care Facility Characteristics (Data as of Jan 2026)

Total census
104 residents
Residents by payment source
Medicare
10 residents (9.6%)
Medicaid
57 residents (54.8%)
Private pay or other
37 residents (35.6%)
Programs & Services
Residents' Group

Residents meet regularly to discuss policies, care quality, and activities

Active Resident Council

Organized group of residents that meets regularly to discuss facility policies, quality of life, and activities.

Quality of care over time

These measures show how residents usually do over time at this home, based on health outcomes and preventive care.

High-risk clinical events score Info A composite score based on pressure ulcers, falls with injury, weight loss, walking ability decline, and activities of daily living decline. 7.8
32% better than North Carolina average

North Carolina average: 11.5

Functional decline score Info A composite score based on activities of daily living decline, walking ability decline, and incontinence. 9.8
52% better than North Carolina average

North Carolina average: 20.6

Long-stay resident measures
Above average North Carolina avg: 2.9 Info CMS star rating based on long-stay quality measure performance. 5 stars = significantly above average, 1 star = significantly below average.
Need for Help with Daily Activities Increased Info Percent of long-stay residents whose need for help with daily activities has increased 12.3%
30% better than North Carolina average

North Carolina average: 17.5%

Walking Ability Worsened Info Percent of long-stay residents whose ability to move independently worsened 10.5%
55% better than North Carolina average

North Carolina average: 23.3%

Low Risk Residents with Bowel/Bladder Incontinence Info Percent of low risk long-stay residents who lose control of their bowels or bladder 6.6%
69% better than North Carolina average

North Carolina average: 21.4%

Falls with Major Injury Info Percent of long-stay residents experiencing one or more falls with major injury 3.6%
In line with North Carolina average

North Carolina average: 3.6%

High Risk Residents with Pressure Ulcers Info Percent of long-stay high risk residents with pressure ulcers 7.6%
20% worse than North Carolina average

North Carolina average: 6.3%

Urinary Tract Infection Info Percent of long-stay residents with a urinary tract infection 0.3%
90% better than North Carolina average

North Carolina average: 2.6%

Lost Too Much Weight Info Percent of long-stay residents who lose too much weight 5.0%
32% better than North Carolina average

North Carolina average: 7.4%

Depressive Symptoms Info Percent of long-stay residents who have depressive symptoms 0.0%
100% better than North Carolina average

North Carolina average: 4.4%

Antipsychotic Use Info Percent of long-stay residents who received an antipsychotic medication 14.4%
7% worse than North Carolina average

North Carolina average: 13.4%

Pneumococcal Vaccine Info Percent of long-stay residents assessed and appropriately given the pneumococcal vaccine 99.7%
9% better than North Carolina average

North Carolina average: 91.6%

Influenza Vaccine Info Percent of long-stay residents assessed and appropriately given the seasonal influenza vaccine 99.1%
5% better than North Carolina average

North Carolina average: 94.1%

Hospitalizations per 1,000 days Info Number of hospitalizations per 1,000 long-stay resident days. 2.17
23% worse than North Carolina average

North Carolina average: 1.77

ED visits per 1,000 days Info Number of outpatient emergency department visits per 1,000 long-stay resident days. 1.64
10% better than North Carolina average

North Carolina average: 1.82

Short-stay resident measures
Significantly below average North Carolina avg: 2.7 Info CMS star rating based on short-stay quality measure performance. 5 stars = much above average, 1 star = much below average.
Pneumococcal Vaccine Info Percent of short-stay residents assessed and appropriately given the pneumococcal vaccine 97.5%
22% better than North Carolina average

North Carolina average: 79.9%

Antipsychotic medication increase Info Percent of short-stay residents who newly received an antipsychotic medication 3.4%
127% worse than North Carolina average

North Carolina average: 1.5%

Influenza Vaccine Info Percent of short-stay residents assessed and appropriately given the seasonal influenza vaccine 90.5%
16% better than North Carolina average

North Carolina average: 78.1%

Re-hospitalized after SNF stay Info Percentage of short-stay residents who were re-hospitalized after their nursing home admission. 40.3%
76% worse than North Carolina average

North Carolina average: 22.9%

Emergency department visits Info Percentage of short-stay residents who had an outpatient emergency department visit. 15.7%
19% worse than North Carolina average

North Carolina average: 13.2%

Falls with major injury Info Percentage of SNF residents who experience falls with major injury during their stay. 0.0%
100% better than North Carolina average

North Carolina average: 0.8%

Ability to care for self at discharge Info Percentage of residents at or above expected ability to care for themselves at discharge. 30.3%
44% worse than North Carolina average

North Carolina average: 53.7%

Successful return to home or community Info Rate of successful return to home or community from a skilled nursing facility. 47.6%
6% worse than North Carolina average

North Carolina average: 50.6%

Penalties and fines

Federal penalties imposed by CMS for regulatory violations, including civil money penalties (fines) and denials of payment for new Medicare/Medicaid admissions.

Source: CMS Penalties Database (Data as of Jan 2026)

Total fines amount $284K
274% higher than North Carolina average

North Carolina average: $76K

Number of fines 3
28% more fines than North Carolina average

North Carolina average: 2.3

Payment Denials Info Serious action where Medicare and/or Medicaid temporarily stops payments for new residents until issues are fixed. 2
418% more payment denials than North Carolina average

North Carolina average: 0.4

Fines amount comparison
This facility $284K
North Carolina average $76K
Penalty History

Penalties are imposed by CMS for violations of federal nursing home regulations.

Civil Money Penalty Info Fines imposed for noncompliance, which can be assessed per day or per instance of violation. Apr 23, 2024
$17K
Civil Money Penalty Info Fines imposed for noncompliance, which can be assessed per day or per instance of violation. Nov 17, 2023
$89K
Payment Denial Info Serious action where Medicare and/or Medicaid temporarily stops payments for new residents until issues are fixed. Nov 17, 2023
7 days
Civil Money Penalty Info Fines imposed for noncompliance, which can be assessed per day or per instance of violation. Jul 13, 2023
$179K

Last updated: Jan 2026

Guides for Better Senior Living

Care Cost Calculator: See Prices in Your Area

Nursing Home Data Explorer

Don’t Wait Too Long: 7 Red Flag Signs Your Parent Needs Assisted Living Now

The True Cost of Assisted Living in 2025 – And How Families Are Paying For It

Understanding Senior Living Costs: Pricing Models, Discounts & Financial Assistance

Financial Aid for North Carolina Seniors

Get financial aid guidance

Community Alternatives Program for Disabled Adults

NC Medicaid CAP/DA

Age 65+ or disabled, North Carolina resident, Medicaid- eligible, nursing home-level care need.

~$2,829/month (300% FBR, individual).

$2,000 (individual), $3,000 (couple).

High demand; waitlists common in urban areas.

North Carolina Senior Care Options

NC SCO (via NFCSP)

Caregiver of someone 60+ (or with dementia), North Carolina resident.

No strict limit; prioritizes low-income.

Not applicable.

Limited slots; rural/urban balance.

Program of All-Inclusive Care for the Elderly (PACE)

North Carolina PACE (e.g., PACE of the Triad)

Age 55+, NC resident (specific counties), NFLOC, safe with PACE support.

~$2,829/month (Medicaid-eligible); private pay option available.

$2,000 (individual), $3,000 (couple) for Medicaid enrollees.

Available in 10+ counties (e.g., Guilford, Wake); multiple providers (e.g., PACE of the Southern Piedmont).

In-Home Aide Services

North Carolina In-Home Aide Services

Age 60+, NC resident, unable to perform 1+ ADL, at risk of nursing home placement.

No strict cap; prioritizes low-income (~$24,980/year).

Not assessed; need-based.

Family can be aides; varies by county funding.

Medicare Savings Program (MSP)

North Carolina Medicare Savings Program

Age 65+ or disabled, NC resident, Medicare Part A/B.

~$2,510/month (QMB), ~$3,380/month (SLMB), ~$3,598/month (QI)—individual.

$9,430 (individual), $14,130 (couple).

Three tiers; no waitlist; includes Extra Help for Part D.

Low-Income Energy Assistance Program (LIHEAP)

North Carolina LIHEAP

Age 60+ prioritized, NC resident, low-income household.

~$3,970/month (individual, 185% FPL).

Not assessed; income-focused.

Covers oil, gas, electric; emergency aid via Crisis Intervention Program (CIP).

Senior Community Service Employment Program (SCSEP)

North Carolina SCSEP

Age 55+, unemployed, low-income, NC resident.

~$1,983/month (125% FPL).

Not specified; income-focused.

Priority for veterans, rural residents; AARP partnership.

VA Aid and Attendance (A&A) and Housebound Benefits

North Carolina VA Aid and Attendance/Housebound

Age 65+ or disabled veteran/spouse, NC resident, wartime service, need for ADL help (A&A) or homebound.

Net income < ~$1,984/month (veteran with dependent, A&A); pension offsets income.

~$155,356 (net worth limit).

High veteran demand in rural/urban areas.

Urgent Repair Program (URP)

North Carolina Urgent Repair Program

Age 60+ prioritized, NC resident, homeowner, low-income.

~$30,258/year (50% AMI, varies by county).

Not strictly assessed; home value considered.

Forgivable at $2,000/year; statewide via local partners.

State/County Special Assistance (SA)

North Carolina Special Assistance

Age 65+ (or disabled), NC resident, in licensed adult care home, low-income.

~$1,255/month (individual, 100% FPL); varies by facility rate.

$2,000 (individual).

Covers assisted living; counties supplement state funds.