Clear Creek Nursing and Rehabilitation Center

Nursing Home in Mecklenburg County

CMS overall rating Info The Overall CMS Rating is scored from 1 to 5 stars and combines results from health inspections, staffing levels, and quality measures. Health inspections carry the most weight. Staffing and quality scores can increase or decrease the final rating based on performance compared to state and national standards.

Overview of Clear Creek Nursing and Rehabilitation Center

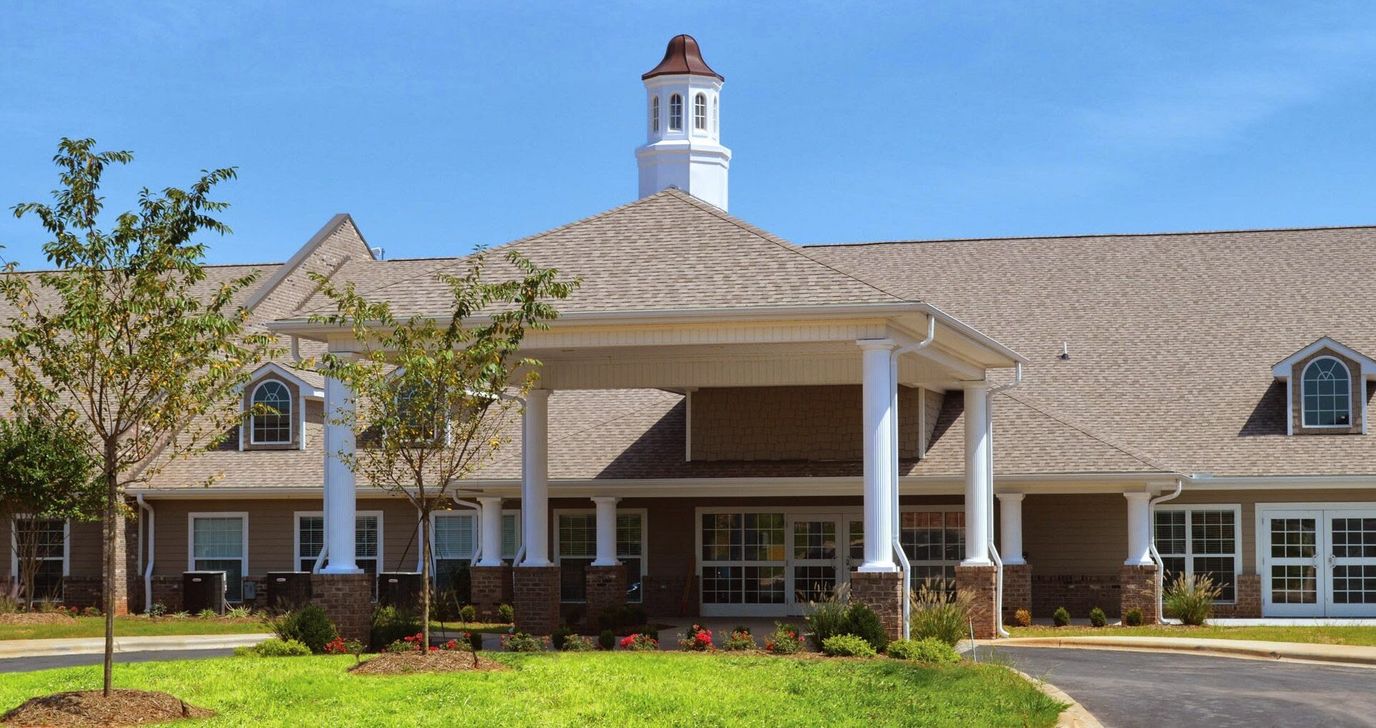
Maintain the skills you need to continue enjoying life in Clear Creek Nursing and Rehabilitation Center, a reliable and welcoming community in Mint Hill, NC for short-term and long-term care. Here, residents’ needs are met with compassionate and dignified care and assistance from an interdisciplinary care team. The community features a team of RNS, LPNs, therapists, dieticians, activity directors, and a community-based chaplain to ensure residents’ physical, social, nutritional, and mental health needs are met.

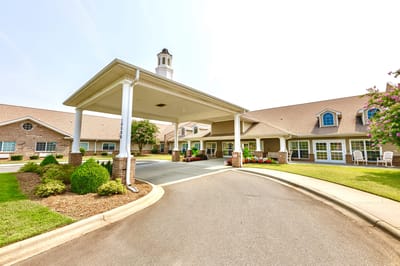
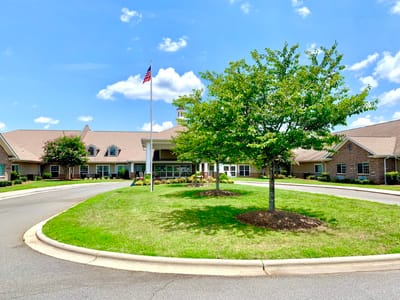
As a community surrounded by nature, lush trees, and vast green spaces, Clear Creek Nursing and Rehabilitation Center provides a healing and relaxing environment for maintaining your well-being. Fun opportunities for fitness, socialization, and hobbies are also available to keep residents active, connected, and entertained. Proper nourishment is also guaranteed with fresh and healthy meals served daily. Here, they go above and beyond in providing a nurturing environment that promotes overall wellness.

(704) 545-2377

Managed by Marissa McNally

Administrator

Marissa McNally leads Clear Creek Nursing & Rehab with dedication and compassion. Her journey in long-term care began during the Covid-19 pandemic, progressing from Personal Care Assistant to Medication Aide. She earned her MBA and licensure to oversee skilled nursing facilities in North Carolina. Marissa brings a fresh perspective and vibrant energy, committed to serving residents with genuine care and respect.

Quality ratings

Measured by Centers for Medicare & Medicaid Services (CMS)

Overall rating Info The Overall CMS Rating combines results from health inspections, staffing levels and quality measures. Health inspections carry the most weight. Staffing and quality scores can increase or decrease the final rating based on performance compared to state and national standards.
1/5 ▼ 2.0 North Carolina average: 3.0/5
Health Inspection Info Based on the results of the facility's three most recent standard inspections and any complaint investigations. CMS reviews the number, scope, and severity of deficiencies, with more recent findings weighted more heavily.
2/5 ▼ 1.4 North Carolina average: 3.4/5
Staffing Info Measures average nursing staff hours per resident per day, including Registered Nurses (RNs) and total nursing staff. Ratings are adjusted based on the level of care residents require and are compared to state and national benchmarks.
4/5 ▲ 0.7 North Carolina average: 3.3/5
Quality Measures Info Based on clinical and physical health indicators reported to CMS, such as hospital readmissions, falls, pressure ulcers, and improvements in mobility. These measures reflect how well residents' health needs are being managed.
1/5 ▼ 2.6 North Carolina average: 3.6/5

Staffing hours breakdown

Info Daily nursing hours per resident by staff type, reported to CMS. Higher is generally better — compare this facility to state and national averages to see where staffing stands.

Hours per resident per day — compared to North Carolina state averages

Total nursing care / resident Info This home is ranked 23rd out of 76 homes in North Carolina.

Total adjusted nursing hours per resident per day, combining RN, LPN, and aide time. CMS adjusts this for case-mix so facilities can be fairly compared.
4h 42m per day
Rank #23 / 76Nurse hours — state benchmarkedThis home is ranked 23rd out of 76 homes in North Carolina.Shows adjusted nurse hours per resident per day benchmarked to the North Carolina average, with a ranking across 76 North Carolina SNFs. More hours mean more direct care. The national average is about 3.5 hrs; below 3.0 is a red flag.
This facility North Carolina avg (4h 55m per day)
vs North Carolina avg
-4%

2 of 6 metrics below state avg

Standout metric Registered Nurse (RN) is +17% above state avg
Staff typeHours / dayvs state avg
Registered Nurse (RN) Info RNs hold the highest nursing license and can assess residents, interpret test results, and direct care plans. More RN hours per day often signals stronger clinical oversight and faster response to health changes. 41m per day ▲ 17% State avg: 35m per day · National avg: 41m per day
LPN / LVN Info Licensed Practical Nurses (LPNs) or Licensed Vocational Nurses (LVNs) deliver routine hands-on care — medication administration, wound dressing, and monitoring vital signs. They work under RN supervision and make up a large share of daily bedside care. 53m per day ■ Avg State avg: 52m per day · National avg: 52m per day
Nurse Aide Info Certified Nurse Aides (CNAs) provide the most direct day-to-day assistance: bathing, dressing, feeding, and mobility. Nurse aide hours are typically the largest staffing category and directly affect residents' quality of life. 2h 38m per day ▲ 14% State avg: 2h 19m per day · National avg: 2h 21m per day
Total Nursing (Weekend) Info Combined nursing hours (RN + LPN + Nurse Aide) per resident per day on weekends. Staffing often drops on weekends — this figure reveals whether the facility maintains adequate coverage outside of weekday hours. 3h 41m per day ▲ 10% State avg: 3h 20m per day · National avg: 3h 26m per day
Physical Therapist Info Hours per resident per day provided by licensed Physical Therapists (PTs) or PT Assistants. PT services help residents recover mobility after injury or illness and are especially important for post-acute (short-stay) rehabilitation. 3m per day ▼ 40% State avg: 5m per day · National avg: 4m per day
RN (Weekend) Info Registered nurse hours specifically on weekends. Facilities sometimes reduce RN presence on Saturdays and Sundays — a low weekend RN figure compared to weekday hours can indicate reduced clinical oversight when most administrative staff are absent. 22m per day ▼ 4% State avg: 23m per day · National avg: 29m per day

Capacity and availability

This home usually has availability

Occupancy lower than 85% suggests more openings may be available.

Lower occupancy than the North Carolina average: 76.4%
Occupancy rate 69.6% Rank #68 / 82Occupancy rate — state benchmarkedThis home is ranked 68th out of 82 homes in North Carolina.Shows this facility's occupancy rate versus the North Carolina average, with its statewide rank out of 82. Higher occupancy signals strong local demand and financial stability.
Avg. Length of Stay 119 days
Occupancy rate
69.6% Rank #68 / 82Occupancy rate — state benchmarkedThis home is ranked 68th out of 82 homes in North Carolina.Shows this facility's occupancy rate versus the North Carolina average, with its statewide rank out of 82. Higher occupancy signals strong local demand and financial stability.
Avg. Length of Stay
119 days

Who this home usually serves

TYPE OF STAY

Primarily short stays

Residents typically stay for brief periods, with frequent admissions and discharges throughout the year.

Might be optimal for
Post-acute recovery Temporary care Transitional stays

Breakdown by payment type

Medicare

24% of new residents, usually for short-term rehab.

Typical stay 1 - 2 months

Private pay

66% of new residents, often for short stays.

Typical stay 2 months

Medicaid

10% of new residents, often for long-term daily care.

Typical stay 2 years

Finances and operations

Privately-owned community
Operated by a business corporation.
Home revenue
$11.5M
Profit
$160.1K
Privately-owned community Operated by a business corporation.
Home revenue
$11.5M Rank #59 / 83Revenue — state benchmarkedThis home is ranked 59th out of 83 homes in North Carolina.Shows this facility's annual revenue compared to the North Carolina SNF average. Higher revenue generally means more resources for staffing and capital — read alongside Payroll %.
Profit
$160.1K
Payroll costs Info The portion of the home's budget spent on staff, including nurses, caregivers, and other employees who support care and operations. Rank #78 / 83Payroll — state benchmarkedThis home is ranked 78th out of 83 homes in North Carolina.Shows total annual staff payroll benchmarked to the North Carolina average. Higher payroll investment relative to peers often signals better staffing and less reliance on cheaper contract labor.
$2.9M
25.7% of revenue Rank #79 / 83Payroll % — state benchmarkedThis home is ranked 79th out of 83 homes in North Carolina.Shows payroll as a percentage of revenue versus the North Carolina average. Well-run SNFs often land around 55–65%. Below 25% may signal understaffing or heavy agency use — read with Staffing ratings.
Other operating costs Info All remaining costs needed to run the home, such as food, utilities, building maintenance, supplies and administrative expenses.
$8.4M
Total costs $11.3M
Walk Score
Walk Score: 5 / 100 Rank #60 / 70Walk Score — state benchmarkedThis home is ranked 60th out of 70 homes in North Carolina.Shows how walkable this facility's neighborhood is compared to the average Walk Score across North Carolina SNFs. Higher scores benefit residents, families, and staff.
Car-dependent. Most errands require a car, with limited nearby walkable options.

About this community

License Details

CMS Certification Number345562

Staffing

Key information about the people who lead and staff this community.

Leadership

ContactMr. Phillip Hill, Vice President of Operations

Therapy & Rehabilitation

2 services
Rehabilitation Services
Short-Term Rehab

Staffing & Medical

1 service
24-Hour Staffing

Amenities & Lifestyle

Private & Semi-Private Rooms
Nurse Stations Assigned To Each Hall
Lounge And Activity Areas
Engaging Social Activities And Events
Inclusive Pricing For Cable & Secure Wi-Fi
Daily Housekeeping
Linen Service
Personal Laundry
And Trash Removal
Beauty Salon
ActivitiesEngaging social activities and events are provided for residents.
Specific ProgramsShort-term Care & Rehabilitation, Principle Therapy Services, Family & Caregiver Resources, Provider Resources, Careers, Make a Payment, Schedule a Tour
Operating Hours24/7

Dining & Nutrition

Food DescriptionClear Creek Nursing & Rehabilitation Center provides a nourishing, tasteful, well-balanced diet that meets the daily nutritional and special dietary needs of each resident.

What does this home offer?

Housing options icon

Housing Options: Private / Semi-Private Rooms

Building type icon
Building type icon

Building Type: Single-story

Dining services icon

Dining Services

Beauty services icon

Beauty Services

Transportation services icon

Transportation Services

Housekeeping icon
Housekeeping icon

Housekeeping Services

Recreational activities icon

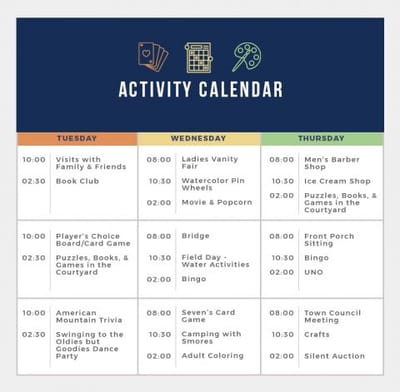
Recreational Activities

Exercise program icon

Exercise Programs

Health Programs icon

Health Programs

Types of Care at Clear Creek Nursing and Rehabilitation Center

Nursing Home

Contact Clear Creek Nursing and Rehabilitation Center

Inspection History

In North Carolina, the Department of Health and Human Services, Division of Health Service Regulation conducts unannounced surveys to ensure nursing and adult care homes meet safety standards.

6 visits/inspections Info Inspections are mandatory, regular evaluations conducted by state health departments or regulatory agencies. They ensure the community provides safe, compliant care, covering areas like resident health, staff and management.

Latest inspection

Date March 21, 2025
Complaint Investigation

40 deficiencies

Deficiencies indicate regulatory issues. A higher number implies the facility had several areas requiring improvement.

North Carolina average: 46 deficiencies

Inspection Report Summary for Clear Creek Nursing and Rehabilitation Center

The most recent inspection on March 21, 2025, identified deficiencies related to unresolved Resident Council grievances, incomplete PASRR level II referrals, urinary catheter care, respiratory orders, nurse aide performance reviews, medical record documentation, and infection control practices. Earlier inspections showed a pattern of issues with resident care, including supervision during meals, abuse prevention, medication management, and infection control, with some complaints substantiated and others unsubstantiated. Inspectors cited repeated failures in catheter care, grievance resolution, and infection prevention, as well as concerns about verbal abuse and delays in implementing physician orders. Complaint investigations revealed both substantiated and unsubstantiated allegations, including one involving verbal abuse and neglect and another concerning delayed catheter removal increasing infection risk. The inspection history indicates ongoing challenges with compliance in multiple care areas, with recent findings consistent with prior deficiencies.

Health Inspection History

Inspections
Total health inspections 5

North Carolina average 4


Last Health inspection on Mar 2025

Total health citations
40 Rank #76 / 81Health citations — state benchmarkedThis home is ranked 76th out of 81 homes in North Carolina.Shows this facility's total health deficiency citations benchmarked to the North Carolina state average, with a ranking across all 81 NC SNFs. Lower citation counts earn a better rank.

North Carolina average 20.9

Citations per inspection
8

North Carolina average 4.99


Health citations are formal notices following inspections when they fail to comply with safety and care standards.

32 of 40 citations resulted from standard inspections; 6 of 40 resulted from complaint investigations; and 2 of 40 came from combined inspections (standard and complaint).

Breakdown of citation severity (last 3 years)
Critical Health citations More info
1 Rank #33 / 38Severe citations — state benchmarkedThis home is ranked 33rd out of 38 homes in North Carolina.Shows citations where actual resident harm occurred, compared to the North Carolina average and ranked across 38 SNFs statewide. Even a single severe citation is significant — lower is always better.
23% better than North Carolina average

North Carolina average: 1.3


Serious Health citations More info 4
344% worse than North Carolina average

North Carolina average: 0.9

1 critical citation More info North Carolina average: 1.3

4 serious citations More info North Carolina average: 0.9

33 moderate citations More info North Carolina average: 17.1

2 minor citations More info North Carolina average: 1.6
Citations history (last 3 years)
Infection Control moderate citation Info Issues related to preventing and controlling infections, including hygiene practices and safety protocols. Mar 21, 2025
Corrected

Nursing Services moderate citation Info Issues related to the availability and quality of nursing staff and the care they provide. Mar 21, 2025
Corrected

Quality of Care moderate citation Info Issues related to how well residents receive appropriate treatment and support for their medical and daily care needs. Mar 21, 2025
Corrected

Quality of Care moderate citation Info Issues related to how well residents receive appropriate treatment and support for their medical and daily care needs. Mar 21, 2025
Corrected

Compare Nursing Homes around Mecklenburg County The information below is reported by the North Carolina Department of Health and Human Services, Division of Health Service Regulation.

5 facilities compared · CMS & NC Dept. of Health data · Updated Apr 2026

Filter by care type
Pineville Rehabilitation & Living Center
AL

Assisted Living A licensed, long-term care setting for seniors or individuals with disabilities who need help with daily activities — like bathing, dressing, and medication management — but not 24-hour skilled nursing. Offers housing, meals, and around-the-clock support while aiming to maximize resident independence.

HC

Home Care Professional care delivered in the person's own home — from companionship and errands to skilled nursing and therapy. Allows seniors to age in place. Medicare covers skilled home health when medically necessary.

NH

Nursing Home Licensed facility providing 24/7 skilled nursing care for residents with complex, ongoing medical needs. Staffed by RNs, LPNs, and CNAs. Inspected and star-rated annually by CMS. Accepts Medicare (short-term rehab) and Medicaid (long-term care).

RC

Respite Care Short-term temporary care — days to weeks — to give family caregivers a break. Full care provided during the stay. Often used after hospitalization or to trial a facility before a permanent placement decision.

Pineville (Lakeview Drive)106 68.3% -11%3.96 +118%0%3459.0384A+ 25 Ncnh Holdings Llc$12.1M$3.2M26.3%345415
University Place Nursing & Rehabilitation
MC

Memory Care Secured, specialized care for people living with Alzheimer's or dementia. Staff trained in cognitive impairment, with higher staff-to-resident ratios and an environment designed to reduce confusion and wandering risk.

NH

Nursing Home Licensed facility providing 24/7 skilled nursing care for residents with complex, ongoing medical needs. Staffed by RNs, LPNs, and CNAs. Inspected and star-rated annually by CMS. Accepts Medicare (short-term rehab) and Medicaid (long-term care).

Charlotte (University City North)217 68.1% -11%4.12 -29%+4%2355.02162A+ 29 -$17.4M$6.1M35.3%345142
Clear Creek Nursing and Rehabilitation Center
NH

Nursing Home Licensed facility providing 24/7 skilled nursing care for residents with complex, ongoing medical needs. Staffed by RNs, LPNs, and CNAs. Inspected and star-rated annually by CMS. Accepts Medicare (short-term rehab) and Medicaid (long-term care).

Mint Hill (Clear Creek Commerce Drive)120 69.6% -9%4.71 +20%+18%3408.05106- 5 Anderson, Coleen$11.5M$2.9M25.7%345562
The Stewart Health Center
AL

Assisted Living A licensed, long-term care setting for seniors or individuals with disabilities who need help with daily activities — like bathing, dressing, and medication management — but not 24-hour skilled nursing. Offers housing, meals, and around-the-clock support while aiming to maximize resident independence.

MC

Memory Care Secured, specialized care for people living with Alzheimer's or dementia. Staff trained in cognitive impairment, with higher staff-to-resident ratios and an environment designed to reduce confusion and wandering risk.

NH

Nursing Home Licensed facility providing 24/7 skilled nursing care for residents with complex, ongoing medical needs. Staffed by RNs, LPNs, and CNAs. Inspected and star-rated annually by CMS. Accepts Medicare (short-term rehab) and Medicaid (long-term care).

Charlotte (Beverly Woods)- 78.2% +2%- --100.0056- 15 The Cypress Of Charlotte Llc$35.4M$12.9M36.5%345495
Myers Park Nursing Center -
NH

Nursing Home Licensed facility providing 24/7 skilled nursing care for residents with complex, ongoing medical needs. Staffed by RNs, LPNs, and CNAs. Inspected and star-rated annually by CMS. Accepts Medicare (short-term rehab) and Medicaid (long-term care).

Charlotte (Myers Park)---------000.00-A+ 83 -----

Financial Assistance for
Nursing Home in North Carolina

Get Financial aid guidance

Community Alternatives Program for Disabled Adults

NC Medicaid CAP/DA

Age 65+ or disabled
General North Carolina resident, Medicaid- eligible, nursing home-level care need.
Income Limits (2025) ~$2,829/month 300% FBR, individual
Asset Limits $2,000 (individual), $3,000 (couple).
NC

High demand; waitlists common in urban areas.

Benefits
Personal care (5-7 hours/day) Respite (240 hours/year) Adult day care ($60/day) Home modifications ($1,500 avg.)

North Carolina Senior Care Options

NC SCO (via NFCSP)

Age Caregiver of someone 60+ (or with dementia)
General North Carolina resident.
Income Limits No strict limit; prioritizes low-income.
Asset Limits Not applicable.
NC

Limited slots; rural/urban balance.

Benefits
In-home respite (4-6 hours/day) Adult day care (~$60/day) Short-term facility care (up to 5 days)

Program of All-Inclusive Care for the Elderly (PACE)

North Carolina PACE (e.g., PACE of the Triad)

Age 55+
General NC resident (specific counties), NFLOC, safe with PACE support.
Income Limits (2025) ~$2,829/month (Medicaid-eligible); private pay option available.
Asset Limits $2,000 (individual), $3,000 (couple) for Medicaid enrollees.
NC

Available in 10+ counties (e.g., Guilford, Wake); multiple providers (e.g., PACE of the Southern Piedmont).

Benefits
Personal care (5-7 hours/day) Medical care Meals Transportation Respite Therapies

In-Home Aide Services

North Carolina In-Home Aide Services

Age 60+
General NC resident, unable to perform 1+ ADL, at risk of nursing home placement.
Income Limits (2025) No strict cap; prioritizes low-income ~$24,980/year
Asset Limits Not assessed; need-based.
NC

Family can be aides; varies by county funding.

Benefits
Personal care (5-20 hours/week) Meal prep Respite (~5 days/year) Errands

Medicare Savings Program (MSP)

North Carolina Medicare Savings Program

Age 65+ or disabled
General NC resident, Medicare Part A/B.
Income Limits (2025) ~$2,510/month (QMB), ~$3,380/month (SLMB), ~$3,598/month (QI)—individual.
Asset Limits $9,430 (individual), $14,130 (couple).
NC

Three tiers; no waitlist; includes Extra Help for Part D.

Benefits
Covers Part B premiums ($174.70/month) Deductibles ($240/year) Copays (~20%)

Low-Income Energy Assistance Program (LIHEAP)

North Carolina LIHEAP

Age 60+ prioritized
General NC resident, low-income household.
Income Limits (2025) ~$3,970/month individual, 185% FPL
Asset Limits Not assessed; income-focused.
NC

Covers oil, gas, electric; emergency aid via Crisis Intervention Program (CIP).

Benefits
Heating/cooling aid ($300-$1,000/season) Emergency fuel ($600 max via CIP)

Senior Community Service Employment Program (SCSEP)

North Carolina SCSEP

Age 55+
General unemployed, low-income, NC resident.
Income Limits (2025) ~$1,983/month 125% FPL
Asset Limits Not specified; income-focused.
NC

Priority for veterans, rural residents; AARP partnership.

Benefits
Paid training (~20 hours/week at ~$7.25/hour) Job placement

VA Aid and Attendance (A&A) and Housebound Benefits

North Carolina VA Aid and Attendance/Housebound

Age 65+ or disabled veteran/spouse
General NC resident, wartime service, need for ADL help (A&A) or homebound.
Income Limits (2025) Net income < ~$1,984/month (veteran with dependent, A&A); pension offsets income.
Asset Limits ~$155,356 net worth limit
NC

High veteran demand in rural/urban areas.

Benefits
Cash (~$1,433-$2,642/month veteran, ~$951-$1,318 spouse) for care costs (e.g., in-home, assisted living)

Urgent Repair Program (URP)

North Carolina Urgent Repair Program

Age 60+ prioritized
General NC resident, homeowner, low-income.
Income Limits (2025) ~$30,258/year 50% AMI, varies by county
Asset Limits Not strictly assessed; home value considered.
NC

Forgivable at $2,000/year; statewide via local partners.

Benefits
Repairs (~$8,000-$12,000 avg.) for safety (e.g., roofs, heating, accessibility)

State/County Special Assistance (SA)

North Carolina Special Assistance

Age 65+ (or disabled)
General NC resident, in licensed adult care home, low-income.
Income Limits (2025) ~$1,255/month (individual, 100% FPL); varies by facility rate.
Asset Limits $2,000 individual
NC

Covers assisted living; counties supplement state funds.

Benefits
Cash (~$1,200-$1,500/month) for room/board; Medicaid covers care services

Places of interest near Clear Creek Nursing and Rehabilitation Center

Address 4.4 miles from city center Info Estimated distance in miles from Mint Hill's city center to Clear Creek Nursing and Rehabilitation Center's address, calculated via Google Maps.

Calculate Travel Distance to Clear Creek Nursing and Rehabilitation Center

Add your location

Address

Staffing Data (Q2 2025)

This data corresponds to Q2 2025 and is based on CMS Payroll-Based Journal.

Total staff 167
Employees 161
Contractors 6
Staff to resident ratio 1.61:1
13% worse than North Carolina average

North Carolina average ratio: 1.85:1

Avg staff/day 59
Average shift 8.9 hours
11% better than North Carolina average

North Carolina average: 8 hours

Total staff hours (quarter) 47,674
Nursing staff breakdown
Registered Nurse

Manages medical care and health needs.

Total count 18
Average shift length Info Average shift length. Calculated as total hours divided by days worked and average staff per day. 9.6 hours

This role is partially covered by contractors.

Licensed Practical Nurse

Assists with medical care and medications.

Total count 24
Average shift length Info Average shift length. Calculated as total hours divided by days worked and average staff per day. 9.7 hours

No contractors work on this role.

Certified Nursing Assistant

Helps with daily care and mobility.

Total count 71
Average shift length Info Average shift length. Calculated as total hours divided by days worked and average staff per day. 9.3 hours

No contractors work on this role.

Contractor staffing

Total hours from contractors

1%

482 contractor hours this quarter

Registered Nurse: 2 Occupational Therapy Aide: 2 Medical Director: 1 Occupational Therapy Assistant: 1
Staff by category
Certified Nursing Assistant7107120,87591100%9.3
Licensed Practical Nurse240246,46191100%9.7
Registered Nurse162186,13691100%9.6
Medication Aide/Technician110114,17991100%10.1
Speech Language Pathologist110112,0738897%6.9
Clinical Nurse Specialist3031,1186673%8.6
Physical Therapy Aide4049527178%7.3
Physical Therapy Assistant3038687380%7
RN Director of Nursing2028617279%7
Administrator2028566571%8
Qualified Social Worker7077976673%5.9
Dietitian1015086875%7.5
Nurse Practitioner1015046369%8
Mental Health Service Worker1014956167%8.1
Respiratory Therapy Technician3034596268%7.2
Other Dietary Services Staff1012526066%4.2
Occupational Therapy Aide0221621719%7.7
Medical Director011623134%2
Occupational Therapy Assistant0115778%8.1
71 Certified Nursing Assistant
% of Days 100%
24 Licensed Practical Nurse
% of Days 100%
18 Registered Nurse
% of Days 100%
11 Medication Aide/Technician
% of Days 100%
11 Speech Language Pathologist
% of Days 97%
3 Clinical Nurse Specialist
% of Days 73%
4 Physical Therapy Aide
% of Days 78%
3 Physical Therapy Assistant
% of Days 80%
2 RN Director of Nursing
% of Days 79%
2 Administrator
% of Days 71%
7 Qualified Social Worker
% of Days 73%
1 Dietitian
% of Days 75%
1 Nurse Practitioner
% of Days 69%
1 Mental Health Service Worker
% of Days 67%
3 Respiratory Therapy Technician
% of Days 68%
1 Other Dietary Services Staff
% of Days 66%
2 Occupational Therapy Aide
% of Days 19%
1 Medical Director
% of Days 34%
1 Occupational Therapy Assistant
% of Days 8%

Facility Characteristics

Source: CMS Long-Term Care Facility Characteristics (Data as of Jan 2026)

Total residents 104
Medicare
10
9.6% of residents
Medicaid
57
54.8% of residents
Private pay or other
37
35.6% of residents
Programs & Services
Residents Group

Residents meet regularly to discuss policies, care quality, and activities

Active Resident Council

Organized group of residents that meets regularly to discuss facility policies, quality of life, and activities.

Quality of care over time

These measures show how residents usually do over time at this home, based on health outcomes and preventive care.

High-risk clinical events score Info A composite score based on pressure ulcers, falls with injury, weight loss, walking ability decline, and activities of daily living decline. 7.8
32% better than North Carolina average

North Carolina average: 11.5

Functional decline score Info A composite score based on activities of daily living decline, walking ability decline, and incontinence. 9.8
52% better than North Carolina average

North Carolina average: 20.6

Long-stay resident measures
Above average North Carolina avg: 2.9 Info CMS star rating based on long-stay quality measure performance. 5 stars = significantly above average, 1 star = significantly below average.
Need for Help with Daily Activities Increased Info Percent of long-stay residents whose need for help with daily activities has increased 12.3%
30% better than North Carolina average

North Carolina average: 17.5%

Walking Ability Worsened Info Percent of long-stay residents whose ability to move independently worsened 10.5%
55% better than North Carolina average

North Carolina average: 23.3%

Low Risk Residents with Bowel/Bladder Incontinence Info Percent of low risk long-stay residents who lose control of their bowels or bladder 6.6%
69% better than North Carolina average

North Carolina average: 21.4%

Falls with Major Injury Info Percent of long-stay residents experiencing one or more falls with major injury 3.6%
In line with North Carolina average

North Carolina average: 3.6%

High Risk Residents with Pressure Ulcers Info Percent of long-stay high risk residents with pressure ulcers 7.6%
20% worse than North Carolina average

North Carolina average: 6.3%

Urinary Tract Infection Info Percent of long-stay residents with a urinary tract infection 0.3%
90% better than North Carolina average

North Carolina average: 2.6%

Lost Too Much Weight Info Percent of long-stay residents who lose too much weight 5.0%
32% better than North Carolina average

North Carolina average: 7.4%

Depressive Symptoms Info Percent of long-stay residents who have depressive symptoms 0.0%
100% better than North Carolina average

North Carolina average: 4.4%

Antipsychotic Use Info Percent of long-stay residents who received an antipsychotic medication 14.4%
7% worse than North Carolina average

North Carolina average: 13.4%

Pneumococcal Vaccine Info Percent of long-stay residents assessed and appropriately given the pneumococcal vaccine 99.7%
9% better than North Carolina average

North Carolina average: 91.6%

Influenza Vaccine Info Percent of long-stay residents assessed and appropriately given the seasonal influenza vaccine 99.1%
5% better than North Carolina average

North Carolina average: 94.1%

Hospitalizations per 1,000 days Info Number of hospitalizations per 1,000 long-stay resident days. 2.17
23% worse than North Carolina average

North Carolina average: 1.77

ED visits per 1,000 days Info Number of outpatient emergency department visits per 1,000 long-stay resident days. 1.64
10% better than North Carolina average

North Carolina average: 1.82

Short-stay resident measures
Significantly below average North Carolina avg: 2.9 Info CMS star rating based on short-stay quality measure performance. 5 stars = much above average, 1 star = much below average.
Pneumococcal Vaccine Info Percent of short-stay residents assessed and appropriately given the pneumococcal vaccine 97.5%
22% better than North Carolina average

North Carolina average: 79.9%

Antipsychotic medication increase Info Percent of short-stay residents who newly received an antipsychotic medication 3.4%
127% worse than North Carolina average

North Carolina average: 1.5%

Influenza Vaccine Info Percent of short-stay residents assessed and appropriately given the seasonal influenza vaccine 90.5%
16% better than North Carolina average

North Carolina average: 78.1%

Re-hospitalized after SNF stay Info Percentage of short-stay residents who were re-hospitalized after their nursing home admission. 40.3%
76% worse than North Carolina average

North Carolina average: 22.9%

Emergency department visits Info Percentage of short-stay residents who had an outpatient emergency department visit. 15.7%
19% worse than North Carolina average

North Carolina average: 13.2%

Falls with major injury Info Percentage of SNF residents who experience falls with major injury during their stay. 0.0%
100% better than North Carolina average

North Carolina average: 0.8%

Ability to care for self at discharge Info Percentage of residents at or above expected ability to care for themselves at discharge. 30.3%
44% worse than North Carolina average

North Carolina average: 53.7%

Successful return to home or community Info Rate of successful return to home or community from a skilled nursing facility. 47.6%
6% worse than North Carolina average

North Carolina average: 50.6%

Penalties and fines

Federal penalties imposed by CMS for regulatory violations, including civil money penalties (fines) and denials of payment for new Medicare/Medicaid admissions.

Source: CMS Penalties Database (Data as of Jan 2026)

Total fines amount $284K
274% higher than North Carolina average

North Carolina average: $76K

Number of fines 3 Rank #33 / 41Federal fines — state benchmarkedThis home is ranked 33rd out of 41 homes in North Carolina.Shows this facility's CMS fine count alongside the North Carolina average, and where it ranks among all 41 skilled nursing facilities in the state. Fewer fines mean a better rank.
28% more fines than North Carolina average

North Carolina average: 2.3

Payment Denials Info Serious action where Medicare and/or Medicaid temporarily stops payments for new residents until issues are fixed. 2
418% more payment denials than North Carolina average

North Carolina average: 0.4

Fines amount comparison
This facility $284K
North Carolina average $76K
Penalty History

Penalties are imposed by CMS for violations of federal nursing home regulations.

Civil Money Penalty Info Fines imposed for noncompliance, which can be assessed per day or per instance of violation. Apr 23, 2024
$17K
Civil Money Penalty Info Fines imposed for noncompliance, which can be assessed per day or per instance of violation. Nov 17, 2023
$89K
Payment Denial Info Serious action where Medicare and/or Medicaid temporarily stops payments for new residents until issues are fixed. Nov 17, 2023
7 days
Civil Money Penalty Info Fines imposed for noncompliance, which can be assessed per day or per instance of violation. Jul 13, 2023
$179K

Last updated: Jan 2026

Guides for Better Senior Living

Care Cost Calculator: See Prices in Your Area

Nursing Home Data Explorer

Don’t Wait Too Long: 7 Red Flag Signs Your Parent Needs Assisted Living Now

The True Cost of Assisted Living in 2025 – And How Families Are Paying For It

Understanding Senior Living Costs: Pricing Models, Discounts & Financial Assistance

Explore Open Rooms
1 Contact details
2 What type of senior care service are you looking for?
3 What budget do you have in mind for senior care?
4 How soon do you need to find care?
5 Additional details

Thank you for your interest!

Our team will be in touch shortly to help with next steps.