Myers Park Nursing Center
Nursing Home · Charlotte, NC
CMS overall rating Info The Overall CMS Rating is scored from 1 to 5 stars and combines results from health inspections, staffing levels, and quality measures. Health inspections carry the most weight. Staffing and quality scores can increase or decrease the final rating based on performance compared to state and national standards.

Myers Park Nursing Center

Nursing Home · Charlotte, NC
CMS overall rating Info The Overall CMS Rating is scored from 1 to 5 stars and combines results from health inspections, staffing levels, and quality measures. Health inspections carry the most weight. Staffing and quality scores can increase or decrease the final rating based on performance compared to state and national standards.
Calculator: See prices in your area
Myers Park Nursing Center accepts Medicaid, Medicare, and private pay.

Overview of Myers Park Nursing Center

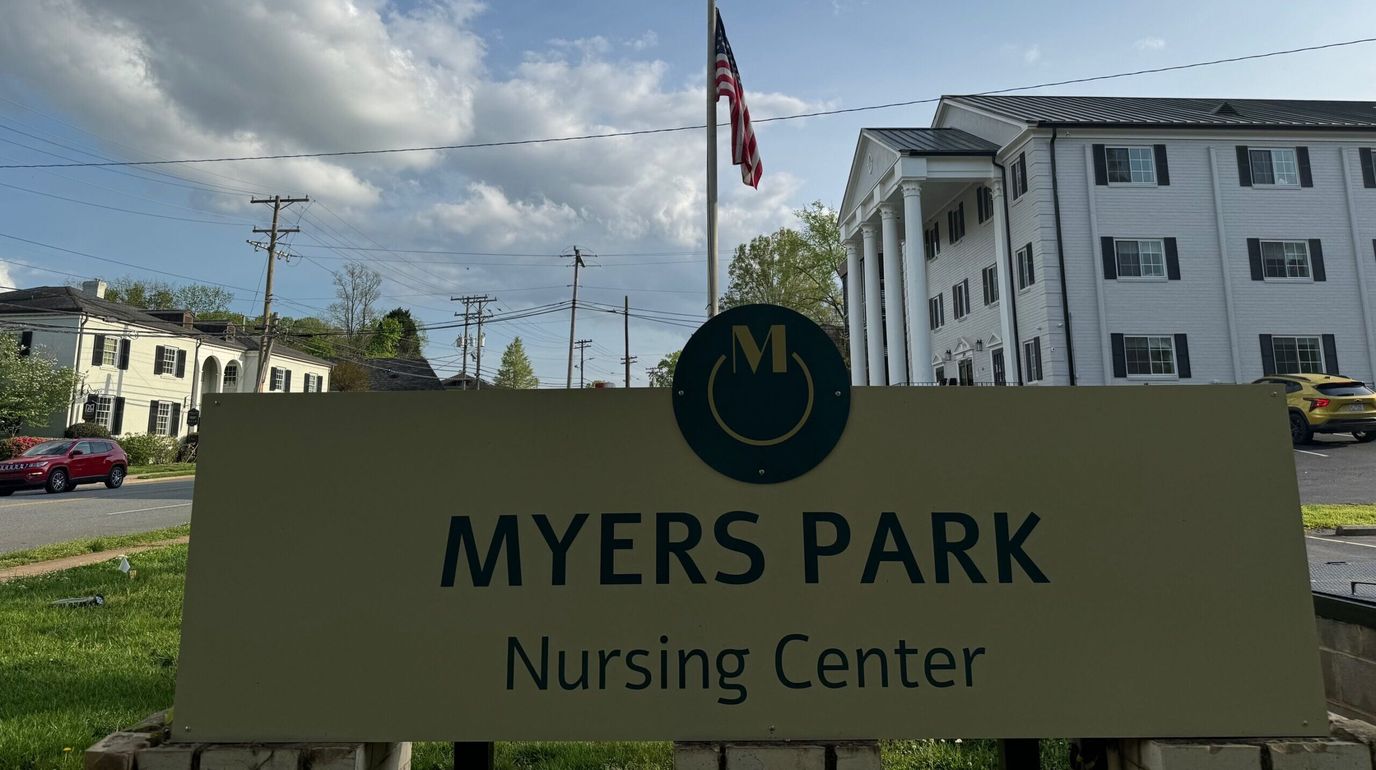
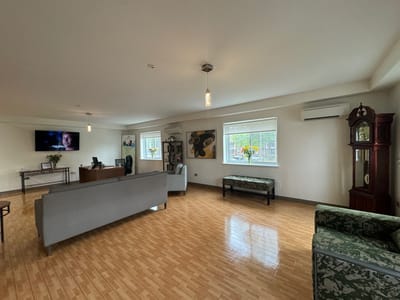
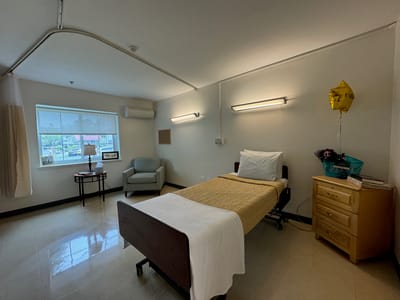
Myers Park Nursing Center is a leading community in Charlotte, NC, dedicated to offering outstanding skilled nursing care, rehabilitation services, and memory care to its residents. The community provides its residents with personalized care plans and a team of well-experienced caregivers and healthcare professionals to accommodate their unique needs. By offering assistance with daily living activities, medication management, therapy services, and essential medical interventions, the community makes sure residents are well-equipped to maintain their health and well-being.

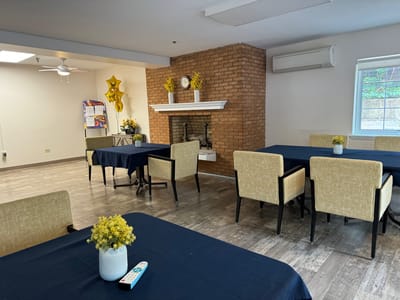
The community also has an array of fun and engaging recreational activities to stimulate their minds and keep them active while receiving compassionate care. Nutritional meals are also served daily to help residents maintain proper nourishment and nutrition. At Myers Park Nursing Center, they strive to create a comfortable and nurturing environment for recovering their overall functioning and well-being.

(704) 334-1671

Quality ratings

Measured by Centers for Medicare & Medicaid Services (CMS)

Overall rating Info The Overall CMS Rating combines results from health inspections, staffing levels and quality measures. Health inspections carry the most weight. Staffing and quality scores can increase or decrease the final rating based on performance compared to state and national standards.
▼ 66.3% Below NC avg. ▼ 66.3% Below NC avg.Click the badge to see the full State ranking.Click here to see the full State ranking.
Health Inspection Info Based on the results of the facility's three most recent standard inspections and any complaint investigations. CMS reviews the number, scope, and severity of deficiencies, with more recent findings weighted more heavily.
▼ 70.6% Below NC avg. ▼ 70.6% Below NC avg.Click the badge to see the full State ranking.Click here to see the full State ranking.
Staffing Info Measures average nursing staff hours per resident per day, including Registered Nurses (RNs) and total nursing staff. Ratings are adjusted based on the level of care residents require and are compared to state and national benchmarks.
▲ 20.5% Above NC avg. ▲ 20.5% Above NC avg.Click the badge to see the full State ranking.Click here to see the full State ranking.
Quality Measures Info Based on clinical and physical health indicators reported to CMS, such as hospital readmissions, falls, pressure ulcers, and improvements in mobility. These measures reflect how well residents' health needs are being managed.
▲ 12.4% Above NC avg. ▲ 12.4% Above NC avg.Click the badge to see the full State ranking.Click here to see the full State ranking.

Staffing hours breakdown

Info Daily nursing hours per resident by staff type, reported to CMS. Higher is generally better — compare this facility to state and national averages to see where staffing stands.

Hours per resident per day — compared to North Carolina state averages

Total nursing care / resident Info This home is ranked 1st out of 90 homes in North Carolina. Total adjusted nursing hours per resident per day, combining RN, LPN, and aide time. CMS adjusts this for case-mix so facilities can be fairly compared.
11h 28m per day
Rank #1 / 90Nurse hours — State benchmarkedThis home is ranked 1st out of 90 homes in North Carolina. Shows adjusted nurse hours per resident per day benchmarked to the North Carolina average, with a ranking across 90 North Carolina SNFs. More hours mean more direct care. The national average is about 3.5 hrs; below 3.0 is a red flag.Click the rank badge to see the full State ranking.Click here to see the full State ranking.
This facility North Carolina avg (4h 55m per day)
vs North Carolina avg
+134%

0 of 1 metrics below state avg

Standout metric Total Nursing (Weekend) is +183% above state avg
Staff typeHours / Day / Residentvs state avg
Total Nursing (Weekend) Info Combined nursing hours (RN + LPN + Nurse Aide) per resident per day on weekends. Staffing often drops on weekends — this figure reveals whether the facility maintains adequate coverage outside of weekday hours. 9h 26m per day ▲ 183% State avg: 3h 20m per day · National avg: 3h 26m per day

Types of Care at Myers Park Nursing Center

Nursing Home

Capacity and availability

This home usually has availability

Occupancy lower than 85% suggests more openings may be available.

Lower occupancy than the North Carolina average: 76.4%
Occupancy rate 66.9% Rank #81 / 94Occupancy rate — State benchmarkedThis home is ranked 81st out of 94 homes in North Carolina. Shows this facility's occupancy rate versus the North Carolina average, with its Statewide rank out of 94. Higher occupancy signals strong local demand and financial stability.Click the rank badge to see the full State ranking.Click here to see the full State ranking.
Avg. Length of Stay 191 days
Occupancy rate
66.9% Rank #81 / 94Occupancy rate — State benchmarkedThis home is ranked 81st out of 94 homes in North Carolina. Shows this facility's occupancy rate versus the North Carolina average, with its Statewide rank out of 94. Higher occupancy signals strong local demand and financial stability.Click the rank badge to see the full State ranking.Click here to see the full State ranking.
Avg. Length of Stay
191 days
Walk Score
Walk Score: 83 / 100 Rank #1 / 100Walk Score — State benchmarkedThis home is ranked 1st out of 100 homes in North Carolina. Shows how walkable this facility's neighborhood is compared to the average Walk Score across North Carolina SNFs. Higher scores benefit residents, families, and staff.Click the rank badge to see the full State ranking.Click here to see the full State ranking.
Very walkable. Most errands can be accomplished on foot, and many essentials are within a short walk.
BBB Rating
BBB Rating: A+ (Not Accredited)
An independent rating from the Better Business Bureau based on factors such as complaint history, transparency, and business practices.
How BBB ratings work

About this community

Staffing

Key information about the people who lead and staff this community.

Leadership

ContactMs. Stacey Taylor, Director of Nursing

Payment & Insurance

2 services
Accept Medicaid
Accept Medicare

Therapy & Rehabilitation

3 services
Rehabilitation Services
Respite Care
Short-Term Rehab

Staffing & Medical

1 service
24-Hour Staffing

Amenities & Lifestyle

Private Suites
Dining Excellence
Fitness Center
Therapy Rooms
Tranquil Courtyards
Walking Paths
Outdoor Recreation Areas
Pet-Friendly Spaces
Beautiful Views

Dining & Nutrition

Food DescriptionNutritious and delicious meals prepared by talented chefs, fostering social interaction and a sense of community.

Contact Myers Park Nursing Center

Inspection History

In North Carolina, the Department of Health and Human Services, Division of Health Service Regulation conducts unannounced surveys to ensure nursing and adult care homes meet safety standards.

Since 2023 · 3 years of data 66 deficiencies 11 inspections 0 penalties

Inspection Scorecard Info This scorecard compares key inspection, citation, and complaint metrics at this facility against the North Carolina state average. Metrics rated ≥15% worse than average are highlighted in red; those ≥15% better are highlighted in green.

Since 2023 vs. North Carolina state average
Overall vs. NC average 3 Worse Metrics worse than North Carolina average:
• Total deficiencies (43% above)
• Deficiencies per year (44% above)
• Deficiencies per inspection (173% above)
1 Better Metrics better than North Carolina average:
• Total inspections (48% below)
Latest Inspection February 12, 2025 Complaint Investigation

Deficiencies Info Deficiencies are formal regulatory issues recorded during state inspections.

This FacilityNC Averagevs. NC Avg
Total deficiencies Info Formal regulatory issues recorded by inspectors across all inspection types. 6646 This facility has 43% more total deficiencies than a typical North Carolina nursing home (66 vs. NC avg 46).↑ 43% worse
Deficiencies per year Info Average deficiencies per year since 2023. 2215.3 This facility has 44% more deficiencies per year than a typical North Carolina nursing home (22 vs. NC avg 15.3).↑ 44% worse
Deficiencies per inspection Info Average deficiencies per inspection. 62.2 This facility has 173% more deficiencies per inspection than a typical North Carolina nursing home (6 vs. NC avg 2.2).↑ 173% worse

Inspections Info State inspections evaluate whether the facility meets health and safety standards.

This FacilityNC Averagevs. NC Avg
Total inspections Info Combined count of all routine and focused inspections. Excludes complaint investigations. 1121 This facility has 48% fewer total inspections than a typical North Carolina nursing home (11 vs. NC avg 21).↓ 48% better

Read the full inspection reports for this facility, including detailed findings and corrective actions.

Show Inspection Reports

Health Inspection History

Inspections Since 2023
Total health inspections 11

North Carolina average 4


Last Health inspection on Feb 2025

Total health citations
55 Rank #95 / 95Health citations — State benchmarkedThis home is ranked 95th out of 95 homes in North Carolina. Shows this facility's total health deficiency citations benchmarked to the North Carolina State average, with a ranking across all 95 NC SNFs. Lower citation counts earn a better rank.Click the rank badge to see the full State ranking.Click here to see the full State ranking.

North Carolina average 20.9

Citations per inspection
5 Rank #61 / 95Citations per inspection — State benchmarkedThis home is ranked 61st out of 95 homes in North Carolina. Shows average deficiency citations per CMS inspection for this facility versus the North Carolina mean across 95 SNFs with citation data. Lower is better.Click the rank badge to see the full State ranking.Click here to see the full State ranking.

North Carolina average 4.99


Health citations are formal notices following inspections when they fail to comply with safety and care standards.

21 of 55 citations resulted from standard inspections; 24 of 55 resulted from complaint investigations; and 10 of 55 came from combined inspections (standard and complaint).

Breakdown of citation severity (last 3 years)
Critical Health citations
13
900% worse than North Carolina average

North Carolina average: 1.3


Serious Health citations
1 Rank #1 / 36Serious citations (G–I) — State benchmarkedThis home is ranked 1st out of 36 homes in North Carolina. Shows G–I scope serious health citations for this facility versus other North Carolina SNFs. Lower counts rank better.Click the rank badge to see the full State ranking.Click here to see the full State ranking.
11% worse than North Carolina average

North Carolina average: 0.9

13 critical citations North Carolina average: 1.3

1 serious citation North Carolina average: 0.9

41 moderate citations North Carolina average: 17.1

0 minor citations North Carolina average: 1.6
Citations history (last 3 years)
Abuse/Neglect critical citation Feb 12, 2025
Corrected

Abuse/Neglect critical citation Feb 12, 2025
Corrected

Abuse/Neglect moderate citation Feb 12, 2025
Corrected

Administration moderate citation Feb 12, 2025
Corrected

Staffing Data

Reporting period: April 1 – June 30, 2025 (Q2 2025). Source: CMS Payroll-Based Journal report.

Total staff 33
Employees 24
Contractors 9
Staff to resident ratio 0.38:1
80% worse than North Carolina average
North Carolina average ratio: 1.85:1 North Carolina average ratio: 1.85:1See full North Carolina ranking
Avg staff/day 6
Average shift 7 hours
13% worse than North Carolina average
North Carolina average: 8 hours North Carolina average shift: 8 hoursSee full North Carolina ranking
Total staff hours (quarter) 3,181

Nursing staff breakdown

Q2 2025 · Apr 1 – Jun 30 More info This data comes from the CMS Payroll-Based Journal report covering April 1 – June 30, 2025.
Registered Nurse

Manages medical care and health needs.

Total count 1
Average shift length Info Average shift length. Calculated as total hours divided by days worked and average staff per day. 8 hours

No contractors work on this role.

Licensed Practical Nurse

Assists with medical care and medications.

Total count 7
Average shift length Info Average shift length. Calculated as total hours divided by days worked and average staff per day. 6.7 hours

This role is partially covered by contractors.

Certified Nursing Assistant

Helps with daily care and mobility.

Total count 16
Average shift length Info Average shift length. Calculated as total hours divided by days worked and average staff per day. 6.7 hours

This role is partially covered by contractors.

Contractor staffing

Q2 2025 · Apr 1 – Jun 30 More info This data comes from the CMS Payroll-Based Journal report covering April 1 – June 30, 2025.

Total hours from contractors

9.4%

298 contractor hours this quarter

Certified Nursing Assistant: 5 Licensed Practical Nurse: 4

Staff by category

Q2 2025 · Apr 1 – Jun 30 More info This data comes from the CMS Payroll-Based Journal report covering April 1 – June 30, 2025.
Certified Nursing Assistant115167404154%6.7
Administrator1015206586%8
Clinical Nurse Specialist1015206586%8
Mental Health Service Worker1015206586%8
Licensed Practical Nurse3473683546%6.7
Registered Nurse1012473141%8
RN Director of Nursing2021471722%6.1
Other Dietary Services Staff202881520%5.2
Medication Aide/Technician1012745%6.9
Dietitian101411%4
16 Certified Nursing Assistant
% of Days 54%
1 Administrator
% of Days 86%
1 Clinical Nurse Specialist
% of Days 86%
1 Mental Health Service Worker
% of Days 86%
7 Licensed Practical Nurse
% of Days 46%
1 Registered Nurse
% of Days 41%
2 RN Director of Nursing
% of Days 22%
2 Other Dietary Services Staff
% of Days 20%
1 Medication Aide/Technician
% of Days 5%
1 Dietitian
% of Days 1%

Penalties and fines

Includes penalties issued in 2023-2024

Federal penalties imposed by CMS for regulatory violations, including civil money penalties (fines) and denials of payment for new Medicare/Medicaid admissions.

Source: CMS Penalties Database (Data as of Jan 2026)

Total fines amount $433K Rank #97 / 97Federal fines — State benchmarkedThis home is ranked 97th out of 97 homes in North Carolina. Shows this facility's cumulative CMS federal fine dollars versus the North Carolina average among facilities with fines, and where it ranks among 97 skilled nursing facilities in the pool. Lower total dollars mean a better rank.Click the rank badge to see the full State ranking.Click here to see the full State ranking.
470% higher than North Carolina average

North Carolina average: $76K

Number of fines 6
156% more fines than North Carolina average

North Carolina average: 2.3

Payment Denials Info Serious action where Medicare and/or Medicaid temporarily stops payments for new residents until issues are fixed. 3
677% more payment denials than North Carolina average

North Carolina average: 0.4

Fines amount comparison
This facility $433K
North Carolina average $76K
Penalty History

Penalties are imposed by CMS for violations of federal nursing home regulations.

7 penalties in the past 3 years

Multiple penalties were reported in the last 3 years.

Payment Denial Info Serious action where Medicare and/or Medicaid temporarily stops payments for new residents until issues are fixed. Dec 1, 2024
52 days
Civil Money Penalty Info Fines imposed for noncompliance, which can be assessed per day or per instance of violation. Sep 11, 2024
$4K
Civil Money Penalty Info Fines imposed for noncompliance, which can be assessed per day or per instance of violation. Jul 26, 2024
$8K
Civil Money Penalty Info Fines imposed for noncompliance, which can be assessed per day or per instance of violation. Jul 26, 2024
$8K

Last updated: Jan 2026

Quality of care over time

These measures show how residents usually do over time at this home, based on health outcomes and preventive care.

High-risk clinical events score Info A composite score based on pressure ulcers, falls with injury, weight loss, walking ability decline, and activities of daily living decline. 5.9
49% better than North Carolina average

North Carolina average: 11.5

Functional decline score Info A composite score based on activities of daily living decline, walking ability decline, and incontinence. 9.9
52% better than North Carolina average

North Carolina average: 20.6

Long-stay resident measures
Above average Info CMS star rating based on long-stay quality measure performance. 5 stars = significantly above average, 1 star = significantly below average.
Need for Help with Daily Activities Increased Info Percent of long-stay residents whose need for help with daily activities has increased 5.9%
66% better than North Carolina average

North Carolina average: 17.5%

Walking Ability Worsened Info Percent of long-stay residents whose ability to move independently worsened 2.5%
89% better than North Carolina average

North Carolina average: 23.3%

Low Risk Residents with Bowel/Bladder Incontinence Info Percent of low risk long-stay residents who lose control of their bowels or bladder 21.2%
In line with North Carolina average

North Carolina average: 21.4%

Falls with Major Injury Info Percent of long-stay residents experiencing one or more falls with major injury 5.0%
38% worse than North Carolina average

North Carolina average: 3.6%

High Risk Residents with Pressure Ulcers Info Percent of long-stay high risk residents with pressure ulcers 7.0%
11% worse than North Carolina average

North Carolina average: 6.3%

Urinary Tract Infection Info Percent of long-stay residents with a urinary tract infection 0.4%
85% better than North Carolina average

North Carolina average: 2.6%

Lost Too Much Weight Info Percent of long-stay residents who lose too much weight 8.8%
20% worse than North Carolina average

North Carolina average: 7.4%

Depressive Symptoms Info Percent of long-stay residents who have depressive symptoms 0.0%
100% better than North Carolina average

North Carolina average: 4.4%

Antipsychotic Use Info Percent of long-stay residents who received an antipsychotic medication 16.5%
23% worse than North Carolina average

North Carolina average: 13.4%

Pneumococcal Vaccine Info Percent of long-stay residents assessed and appropriately given the pneumococcal vaccine 66.3%
28% worse than North Carolina average

North Carolina average: 91.6%

Influenza Vaccine Info Percent of long-stay residents assessed and appropriately given the seasonal influenza vaccine 93.2%
In line with North Carolina average

North Carolina average: 94.1%

Short-stay resident measures
Pneumococcal Vaccine Info Percent of short-stay residents assessed and appropriately given the pneumococcal vaccine 31.8%
60% worse than North Carolina average

North Carolina average: 79.9%

Antipsychotic medication increase Info Percent of short-stay residents who newly received an antipsychotic medication 2.8%
87% worse than North Carolina average

North Carolina average: 1.5%

Influenza Vaccine Info Percent of short-stay residents assessed and appropriately given the seasonal influenza vaccine 66.7%
15% worse than North Carolina average

North Carolina average: 78.1%

Falls with major injury Info Percentage of SNF residents who experience falls with major injury during their stay. 0.0%
100% better than North Carolina average

North Carolina average: 0.8%

Breakdown by payment type

Medicare

8% of new residents, usually for short-term rehab.

Typical stay 1 - 2 months

Private pay

29% of new residents, often for short stays.

Typical stay 3 - 4 months

Medicaid

63% of new residents, often for long-term daily care.

Typical stay 9 - 10 months

Facility Characteristics

Source: CMS Long-Term Care Facility Characteristics (Data as of Jan 2026)

Total residents 87
Medicare
2
2.3% of residents
Medicaid
61
70.1% of residents
Private pay or other
24
27.6% of residents

Finances and operations

Privately-owned community
Operated by a business corporation.
Home revenue
$10.5M
Operating loss
-$330.8K
Privately-owned community Operated by a business corporation.
Home revenue
$10.5M Rank #77 / 97Revenue — State benchmarkedThis home is ranked 77th out of 97 homes in North Carolina. Shows this facility's annual revenue compared to the North Carolina SNF average. Higher revenue generally means more resources for staffing and capital — read alongside Payroll %.Click the rank badge to see the full State ranking.Click here to see the full State ranking.
Operating loss
-$330.8K
Payroll costs Info The portion of the home's budget spent on staff, including nurses, caregivers, and other employees who support care and operations. Rank #76 / 97Payroll — State benchmarkedThis home is ranked 76th out of 97 homes in North Carolina. Shows total annual staff payroll benchmarked to the North Carolina average. Higher payroll investment relative to peers often signals better staffing and less reliance on cheaper contract labor.Click the rank badge to see the full State ranking.Click here to see the full State ranking.
$5.1M
48.9% of revenue Rank #31 / 97Payroll % — State benchmarkedThis home is ranked 31st out of 97 homes in North Carolina. Shows payroll as a percentage of revenue versus the North Carolina average. Well-run North Carolina SNFs typically land around 49–62% — the top third Statewide. Below 25% may signal understaffing or heavy agency use — read with Staffing ratings.Click the rank badge to see the full State ranking.Click here to see the full State ranking.
Other operating costs Info All remaining costs needed to run the home, such as food, utilities, building maintenance, supplies and administrative expenses.
$5.7M
Total costs $10.9M

What does this home offer?

Pets allowed icon
Pets allowed icon

Pets Allowed

Housing options icon

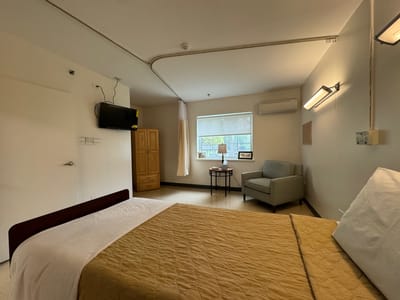
Housing Options: Private Suite

Building type icon
Building type icon

Building Type: 3-story

Dining services icon

Dining Services

Recreational activities icon

Recreational Activities
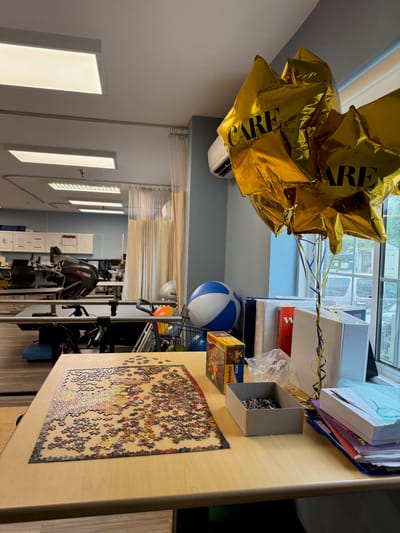
Exercise program icon

Exercise Programs

Who this home usually serves

TYPE OF STAY

Mostly long-term care residents

Most residents stay for extended periods and receive ongoing daily care.

Managed by April Watson

Administrator

April Watson is the Administrator at Myers Park Nursing Center, bringing extensive experience in healthcare management. She is committed to providing person-centered, compassionate care and ensuring compliance with regulatory standards. April fosters a positive environment for residents and staff, continuously working to enhance the well-being and experience of the community.

Places of interest near Myers Park Nursing Center

Address 2.2 miles from city center Info Estimated distance in miles from Charlotte's city center to Myers Park Nursing Center's address, calculated via Google Maps.

Calculate Travel Distance to Myers Park Nursing Center

Add your location

Address

Financial Assistance for
Nursing Home in North Carolina

Myers Park Nursing Center is located in Charlotte, North Carolina.
Here are the financial assistance programs available to residents in North Carolina.

Get Financial aid guidance

Community Alternatives Program for Disabled Adults

NC Medicaid CAP/DA

Age 65+ or disabled
General North Carolina resident, Medicaid- eligible, nursing home-level care need.
Income Limits (2025) ~$2,829/month 300% FBR, individual
Asset Limits $2,000 (individual), $3,000 (couple).
NC

High demand; waitlists common in urban areas.

Benefits
Personal care (5-7 hours/day) Respite (240 hours/year) Adult day care ($60/day) Home modifications ($1,500 avg.)

North Carolina Senior Care Options

NC SCO (via NFCSP)

Age Caregiver of someone 60+ (or with dementia)
General North Carolina resident.
Income Limits No strict limit; prioritizes low-income.
Asset Limits Not applicable.
NC

Limited slots; rural/urban balance.

Benefits
In-home respite (4-6 hours/day) Adult day care (~$60/day) Short-term facility care (up to 5 days)

Program of All-Inclusive Care for the Elderly (PACE)

North Carolina PACE (e.g., PACE of the Triad)

Age 55+
General NC resident (specific counties), NFLOC, safe with PACE support.
Income Limits (2025) ~$2,829/month (Medicaid-eligible); private pay option available.
Asset Limits $2,000 (individual), $3,000 (couple) for Medicaid enrollees.
NC

Available in 10+ counties (e.g., Guilford, Wake); multiple providers (e.g., PACE of the Southern Piedmont).

Benefits
Personal care (5-7 hours/day) Medical care Meals Transportation Respite Therapies

In-Home Aide Services

North Carolina In-Home Aide Services

Age 60+
General NC resident, unable to perform 1+ ADL, at risk of nursing home placement.
Income Limits (2025) No strict cap; prioritizes low-income ~$24,980/year
Asset Limits Not assessed; need-based.
NC

Family can be aides; varies by county funding.

Benefits
Personal care (5-20 hours/week) Meal prep Respite (~5 days/year) Errands

Medicare Savings Program (MSP)

North Carolina Medicare Savings Program

Age 65+ or disabled
General NC resident, Medicare Part A/B.
Income Limits (2025) ~$2,510/month (QMB), ~$3,380/month (SLMB), ~$3,598/month (QI)—individual.
Asset Limits $9,430 (individual), $14,130 (couple).
NC

Three tiers; no waitlist; includes Extra Help for Part D.

Benefits
Covers Part B premiums ($174.70/month) Deductibles ($240/year) Copays (~20%)

VA Aid and Attendance (A&A) and Housebound Benefits

North Carolina VA Aid and Attendance/Housebound

Age 65+ or disabled veteran/spouse
General NC resident, wartime service, need for ADL help (A&A) or homebound.
Income Limits (2025) Net income < ~$1,984/month (veteran with dependent, A&A); pension offsets income.
Asset Limits ~$155,356 net worth limit
NC

High veteran demand in rural/urban areas.

Benefits
Cash (~$1,433-$2,642/month veteran, ~$951-$1,318 spouse) for care costs (e.g., in-home, assisted living)

Urgent Repair Program (URP)

North Carolina Urgent Repair Program

Age 60+ prioritized
General NC resident, homeowner, low-income.
Income Limits (2025) ~$30,258/year 50% AMI, varies by county
Asset Limits Not strictly assessed; home value considered.
NC

Forgivable at $2,000/year; statewide via local partners.

Benefits
Repairs (~$8,000-$12,000 avg.) for safety (e.g., roofs, heating, accessibility)

State/County Special Assistance (SA)

North Carolina Special Assistance

Age 65+ (or disabled)
General NC resident, in licensed adult care home, low-income.
Income Limits (2025) ~$1,255/month (individual, 100% FPL); varies by facility rate.
Asset Limits $2,000 individual
NC

Covers assisted living; counties supplement state funds.

Benefits
Cash (~$1,200-$1,500/month) for room/board; Medicaid covers care services

Compare Nursing Home around Charlotte

The information below is reported by the North Carolina Department of Health and Human Services, Division of Health Service Regulation.

3 facilities compared · CMS & NC Dept. of Health data

Filter by care type
Brookdale Carriage Club Providence
NH

Nursing Home Licensed facility providing 24/7 skilled nursing care for residents with complex, ongoing medical needs. Staffed by RNs, LPNs, and CNAs. Inspected and star-rated annually by CMS. Accepts Medicare (short-term rehab) and Medicaid (long-term care).

AL

Assisted Living A licensed, long-term care setting for seniors or individuals with disabilities who need help with daily activities — like bathing, dressing, and medication management — but not 24-hour skilled nursing. Offers housing, meals, and around-the-clock support while aiming to maximize resident independence.

IL

Independent Living Lifestyle-focused communities for older adults offering dining, activities, and transportation with minimal personal care. Best for active, independent seniors who want community without medical support.

MC

Memory Care Secured, specialized care for people living with Alzheimer's or dementia. Staff trained in cognitive impairment, with higher staff-to-resident ratios and an environment designed to reduce confusion and wandering risk.

Charlotte (Olde Providence North)77 71.5% -6%8.12 +81%+104%$0113.7-8A+ 12 Bkd Fm Holding Company LLC$7.1M$8.1M114.8%345482
Accordius Health at Charlotte
NH

Nursing Home Licensed facility providing 24/7 skilled nursing care for residents with complex, ongoing medical needs. Staffed by RNs, LPNs, and CNAs. Inspected and star-rated annually by CMS. Accepts Medicare (short-term rehab) and Medicaid (long-term care).

AL

Assisted Living A licensed, long-term care setting for seniors or individuals with disabilities who need help with daily activities — like bathing, dressing, and medication management — but not 24-hour skilled nursing. Offers housing, meals, and around-the-clock support while aiming to maximize resident independence.

Charlotte (Yorkmount)120 73.3% -4%3.42 +32%-14%$7.7k134.3-96A+ 13 Fred Collins$11.8M$5.3M45.1%345243
Myers Park Nursing Center
NH

Nursing Home Licensed facility providing 24/7 skilled nursing care for residents with complex, ongoing medical needs. Staffed by RNs, LPNs, and CNAs. Inspected and star-rated annually by CMS. Accepts Medicare (short-term rehab) and Medicaid (long-term care).

Charlotte (Myers Park)133 65.1% -15%11.47 -67%+188%$432.6k555.0145A+ 83 Mc M53 Spe Opco Holdco$10.5M$5.1M48.9%345008

Frequently Asked Questions about Myers Park Nursing Center

What neighborhood is Myers Park Nursing Center in?

Myers Park Nursing Center is in the Myers Park neighborhood of Charlotte.

Is Myers Park Nursing Center in a walkable area?

Myers Park Nursing Center has a walk score of 83. Very walkable. Most errands can be accomplished on foot, and many essentials are within a short walk.

Are there photos of Myers Park Nursing Center?

Yes — there are 5 photos of Myers Park Nursing Center in the photo gallery on this page.

What is the address of Myers Park Nursing Center?

Myers Park Nursing Center is located at 300 Providence Rd, Charlotte, NC 28207.

What is the phone number of Myers Park Nursing Center?

(704) 334-1671 will put you in contact with the team at Myers Park Nursing Center.

Is Myers Park Nursing Center Medicare or Medicaid certified?

Yes — Myers Park Nursing Center is a CMS-certified provider of Medicare and Medicaid.

Guides for Better Senior Living

Care Cost Calculator: See Prices in Your Area

Nursing Home Data Explorer

Don’t Wait Too Long: 7 Red Flag Signs Your Parent Needs Assisted Living Now

The True Cost of Assisted Living in 2025 – And How Families Are Paying For It

Understanding Senior Living Costs: Pricing Models, Discounts & Financial Assistance

Explore Open Rooms
1 Contact details
2 What type of senior care service are you looking for?
3 What budget do you have in mind for senior care?
4 How soon do you need to find care?
5 Additional details

Thank you for your interest!

Our team will be in touch shortly to help with next steps.