Pineville Rehabilitation & Living Center
Nursing Home, Assisted Living, Hospice Care & Respite Care · Pineville, NC
CMS overall rating Info CMS (the Centers for Medicare & Medicaid Services) is the federal agency that rates nursing home quality. Its Overall Rating runs from 1 to 5 stars, combining health inspections, staffing, and quality measures, with inspections weighted most heavily.

Pineville Rehabilitation & Living Center

Nursing Home, Assisted Living, Hospice Care & Respite Care · Pineville, NC
CMS overall rating Info CMS (the Centers for Medicare & Medicaid Services) is the federal agency that rates nursing home quality. Its Overall Rating runs from 1 to 5 stars, combining health inspections, staffing, and quality measures, with inspections weighted most heavily.
Calculator: See prices in your area
Pineville Rehabilitation & Living Center accepts Medicare, Medicaid, and private pay.

Overview of Pineville Rehabilitation & Living Center

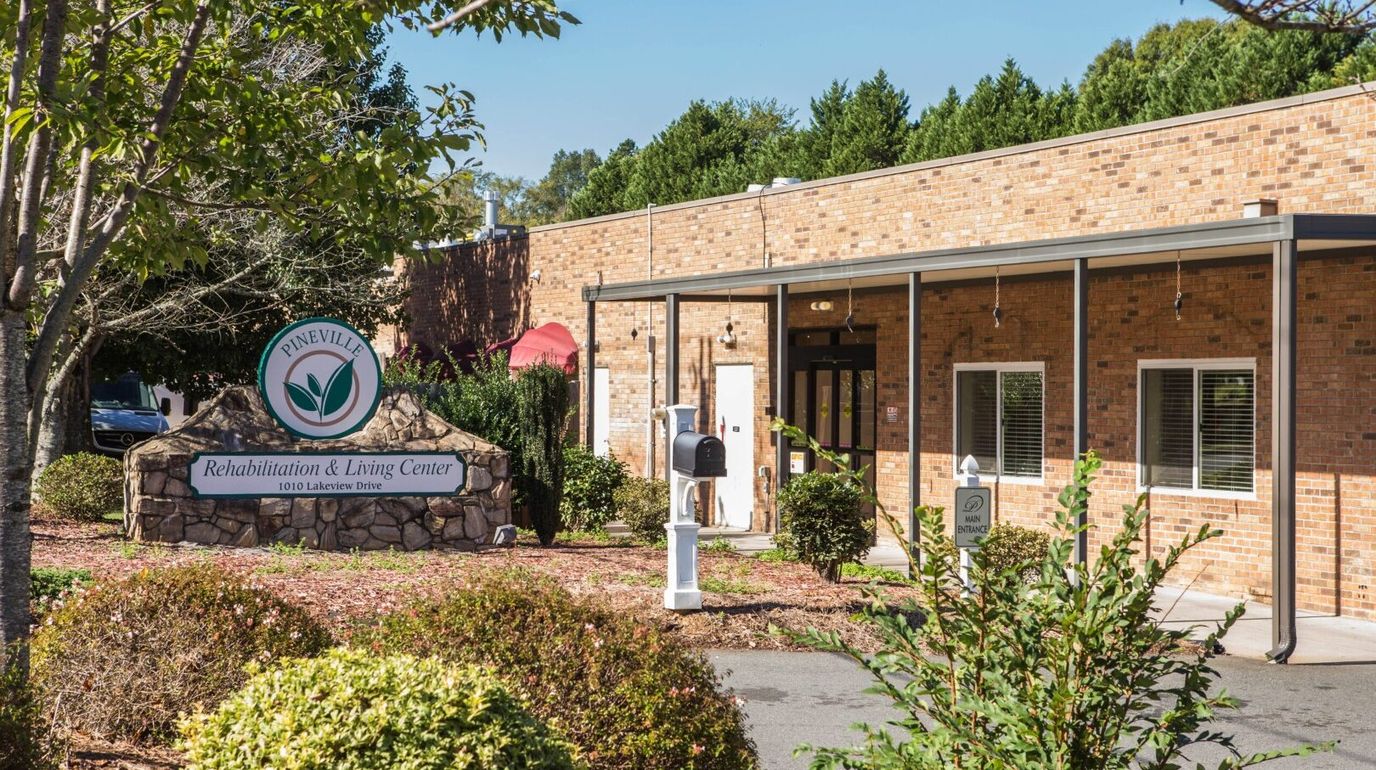
Make the most of your golden years with Pineville Rehabilitation & Living Center, an excellent community in Pineville, NC, offering skilled nursing care, short-term rehabilitation, and long-term care. They also help caregivers get their much-deserved break by offering respite stays. Their team of compassionate caregivers and nurses is available 24/7 to oversee residents’ personalized care plans, provide them with comprehensive care, and assist them with their daily living activities.

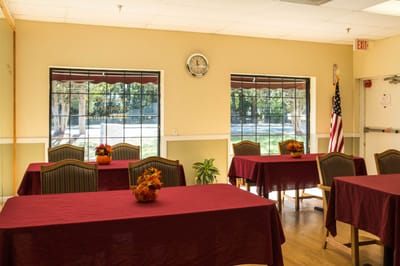
Access to physical, occupational, and speech therapies is offered 7 days a week to make sure residents can quickly gain back their strength and mobility to continue doing the things they enjoy. Daily activities, weekly outings, and social activities are available to ensure residents never feel bored and always have something fun and purposeful to do. Gourmet meals are also served daily to energize residents and help them maintain proper nutrition. From comprehensive care services to enriching activities and thoughtful amenities, Pineville Rehabilitation & Living Center provides it all for a convenient and enriching experience.

Quality ratings

Measured by Centers for Medicare & Medicaid Services (CMS)

Overall rating Info The Overall CMS Rating combines results from health inspections, staffing levels and quality measures. Health inspections carry the most weight. Staffing and quality scores can increase or decrease the final rating based on performance compared to state and national standards.
▲ 7.3% Above NC avg. ▲ 7.3% Above NC avg.NC average: 2.8Click the badge to see the full State ranking.Click here to see the full State ranking.
Health Inspection Info Based on the results of the facility's three most recent standard inspections and any complaint investigations. CMS reviews the number, scope, and severity of deficiencies, with more recent findings weighted more heavily.
▲ 6.2% Above NC avg. ▲ 6.2% Above NC avg.NC average: 2.8Click the badge to see the full State ranking.Click here to see the full State ranking.
Staffing Info Measures average nursing staff hours per resident per day, including Registered Nurses (RNs) and total nursing staff. Ratings are adjusted based on the level of care residents require and are compared to state and national benchmarks.
▼ 24.8% Below NC avg. ▼ 24.8% Below NC avg.NC average: 2.7Click the badge to see the full State ranking.Click here to see the full State ranking.
Quality Measures Info Based on clinical and physical health indicators reported to CMS, such as hospital readmissions, falls, pressure ulcers, and improvements in mobility. These measures reflect how well residents' health needs are being managed.
▲ 26.0% Above NC avg. ▲ 26.0% Above NC avg.NC average: 3.2Click the badge to see the full State ranking.Click here to see the full State ranking.

Staffing hours breakdown

Info Daily nursing hours per resident by staff type, reported to CMS. Higher is generally better — compare this facility to state and national averages to see where staffing stands.

Hours per resident per day — compared to North Carolina state averages

Total nursing care / resident Info This home is ranked 43rd out of 97 homes in North Carolina for nurse hours. Total adjusted nursing hours per resident per day, combining RN, LPN, and aide time. CMS adjusts this for case-mix so facilities can be fairly compared.
3h 58m per day
Rank #43 / 97Nurse hours — State benchmarkedThis home is ranked 43rd out of 97 homes in North Carolina. Shows adjusted nurse hours per resident per day benchmarked to the North Carolina average, with a ranking across 97 North Carolina facilities. More hours mean more direct care. The national average is about 3.5 hrs; below 3.0 is a red flag.Rankings are based only on facilities in North Carolina that report data for that category. Facilities without available data are excluded from the ranking.Click the rank badge to see the full State ranking.Click here to see the full State ranking.
This facility North Carolina avg (3h 59m per day)
vs North Carolina avg
+0%

6 of 6 metrics below state avg

Staff typeHours / Day / Residentvs state avg
Registered Nurse (RN) Info RNs hold the highest nursing license and can assess residents, interpret test results, and direct care plans. More RN hours per day often signals stronger clinical oversight and faster response to health changes. 26m per day ▼ 26% State avg: 35m per day · National avg: 41m per day
LPN / LVN Info Licensed Practical Nurses (LPNs) or Licensed Vocational Nurses (LVNs) deliver routine hands-on care — medication administration, wound dressing, and monitoring vital signs. They work under RN supervision and make up a large share of daily bedside care. 50m per day ▼ 3% State avg: 52m per day · National avg: 52m per day
Nurse Aide Info Certified Nurse Aides (CNAs) provide the most direct day-to-day assistance: bathing, dressing, feeding, and mobility. Nurse aide hours are typically the largest staffing category and directly affect residents' quality of life. 2h 8m per day ▼ 8% State avg: 2h 19m per day · National avg: 2h 21m per day
Weekend Total Nursing Info Combined nursing hours (RN + LPN + Nurse Aide) per resident per day on weekends. Staffing often drops on weekends — this figure reveals whether the facility maintains adequate coverage outside of weekday hours. 2h 51m per day ▼ 15% State avg: 3h 20m per day · National avg: 3h 26m per day
Physical Therapist Info Hours per resident per day provided by licensed Physical Therapists (PTs) or PT Assistants. PT services help residents recover mobility after injury or illness and are especially important for post-acute (short-stay) rehabilitation. 4m per day ▼ 27% State avg: 5m per day · National avg: 4m per day
Weekend RN Info Registered nurse hours specifically on weekends. Facilities sometimes reduce RN presence on Saturdays and Sundays — a low weekend RN figure compared to weekday hours can indicate reduced clinical oversight when most administrative staff are absent. 16m per day ▼ 31% State avg: 23m per day · National avg: 29m per day

Capacity and availability

This home usually has availability

Lower occupancy than the North Carolina average: 76.4%
Occupancy rate
68.3% Rank #154 / 271Occupancy rate — State benchmarkedThis home is ranked 154th out of 271 homes in North Carolina. Shows this facility's occupancy rate versus the North Carolina average, with its Statewide rank out of 271. Higher occupancy signals strong local demand and financial stability.Rankings are based only on facilities in North Carolina that report data for that category. Facilities without available data are excluded from the ranking.Click the rank badge to see the full State ranking.Click here to see the full State ranking.
Avg. Length of Stay
51 days
Bed community size
106-bed community Rank #68 / 390Bed count — State benchmarkedThis home is ranked 68th out of 390 homes in North Carolina. Shows this facility's certified or reported bed count compared to other North Carolina facilities. Larger communities may offer more amenities, programs, and on-site services for residents and families.Rankings are based only on facilities in North Carolina that report data for that category. Facilities without available data are excluded from the ranking.Click the rank badge to see the full State ranking.Click here to see the full State ranking.
A larger shared setting that may offer more common spaces and organized community services.
Years in operation
33 years in operation
A longer operating history, which may indicate experience navigating regulations and delivering ongoing care.
Walk Score
Walk Score: 25 / 100 Rank #346 / 572Walk Score — State benchmarkedThis home is ranked 346th out of 572 homes in North Carolina. Shows how walkable this facility's neighborhood is compared to the average Walk Score across North Carolina facilities. Higher scores benefit residents, families, and staff.Rankings are based only on facilities in North Carolina that report data for that category. Facilities without available data are excluded from the ranking.Click the rank badge to see the full State ranking.Click here to see the full State ranking.
Somewhat walkable. A few nearby services may be reachable on foot, but most trips require transportation.
BBB Rating
BBB Rating: A+ (Not Accredited)
An independent rating from the Better Business Bureau based on factors such as complaint history, transparency, and business practices.
How BBB ratings work

Staffing

Key information about the people who lead and staff this community.

Leadership

ContactMs. Anita Gray, Administrator

Therapy & Rehabilitation

3 services
Rehabilitation Services
Respite Care
Short-Term Rehab

Staffing & Medical

1 service
24-Hour Staffing

Amenities & Lifestyle

Gourmet Meals
On-Site Beauty Salon
Updated Suites And Lounges
Outdoor Seating Areas
Weekly Outings
Religious Services
Socials And Meet Ups
ActivitiesComprehensive activity schedule available
Specific ProgramsPT, OT, ST, 24/7 nursing care, Stroke and neurological care, Comprehensive resident-centered care plan, Comprehensive wound care, Orthopedic rehabilitation, Labs and x-rays on-site, Local physician rounding on staff, Staff psychologist, Pain management
Religious Services

Contact Pineville Rehabilitation & Living Center

Inspection History

In North Carolina, the Department of Health and Human Services, Division of Health Service Regulation conducts unannounced surveys to ensure nursing and adult care homes meet safety standards.

Since 2022 · 4 years of data 43 deficiencies 0 penalties

Inspection Scorecard Info This scorecard compares key inspection, deficiency, and complaint metrics at this facility against the North Carolina state average. Metrics rated ≥15% worse than average are highlighted in red; those ≥15% better are highlighted in green.

Since 2022 vs. North Carolina state average
Overall vs. NC average 0 Worse No metrics in this bucket. 2 Better Metrics better than North Carolina average:
• Total deficiencies (7% below)
• Deficiencies per year (6% below)
Latest Inspection June 6, 2025 Annual Inspection

Deficiencies Info Deficiencies are formal regulatory issues recorded during state inspections.

This FacilityNC Averagevs. NC Avg
Total deficiencies Info Formal regulatory issues recorded by inspectors across all inspection types. 4346 This facility has 7% fewer total deficiencies than a typical North Carolina nursing home (43 vs. NC avg 46).↓ 7% better
Deficiencies per year Info Average deficiencies per year since 2022. 10.811.5 This facility has 6% fewer deficiencies per year than a typical North Carolina nursing home (10.8 vs. NC avg 11.5).↓ 6% better

Inspection Reports Summary Info An editor-reviewed summary of the themes and findings across this facility's recent inspection reports.

  • June 6, 2025 annual inspection found six deficiencies including medication supervision, smoking supply storage, hand hygiene lapses, MDS inaccuracies, and care plan conference failures.
  • November 26, 2024 complaint investigation substantiated physical restraint misuse causing a wrist fracture, resulting in staff suspensions and terminations.
  • July 6, 2023 survey found no health deficiencies, showing a temporary period of compliance before recent citations.

Health Inspection History

Inspections since 2022
Total health inspections 5

North Carolina average 4


Last Health inspection on Jun 2025

Total health citations
45 Rank #95 / 101Health citations — State benchmarkedThis home is ranked 95th out of 101 homes in North Carolina. Shows this facility's total health deficiency citations benchmarked to the North Carolina State average, with a ranking across all 101 NC facilities. Lower citation counts earn a better rank.Rankings are based only on facilities in North Carolina that report data for that category. Facilities without available data are excluded from the ranking.Click the rank badge to see the full State ranking.Click here to see the full State ranking.

North Carolina average 20.9

Citations per inspection
9 Rank #97 / 101Citations per inspection — State benchmarkedThis home is ranked 97th out of 101 homes in North Carolina. Shows average deficiency citations per CMS inspection for this facility versus the North Carolina mean across 101 facilities with citation data. Lower is better.Rankings are based only on facilities in North Carolina that report data for that category. Facilities without available data are excluded from the ranking.Click the rank badge to see the full State ranking.Click here to see the full State ranking.

North Carolina average 4.99


Health citations are formal notices following inspections when they fail to comply with safety and care standards.

24 of 45 citations resulted from standard inspections; 10 of 45 resulted from complaint investigations; and 11 of 45 came from combined inspections (standard and complaint).

Breakdown of citation severity (last 4 years)
Critical health citations
2
54% worse than North Carolina average

North Carolina average: 1.3


Serious health citations
1
11% worse than North Carolina average

North Carolina average: 0.9

2 critical citations North Carolina average: 1.3

1 serious citation North Carolina average: 0.9

39 moderate citations North Carolina average: 17.1

3 minor citations North Carolina average: 1.6
Citations history (last 4 years)
Infection Control moderate citation Jun 06, 2025
Corrected

Pharmacy moderate citation Jun 06, 2025
Corrected

Quality of Care moderate citation Jun 06, 2025
Corrected

Care Planning moderate citation Jun 06, 2025
Corrected

Staffing Data

Reporting period: October 1 – December 31, 2025 (Q4 2025). Source: CMS Payroll-Based Journal report.

Total staff 354
Employees 100
Contractors 254
Staff to resident ratio 4.21 : 1
134% more staff per resident than North Carolina average
North Carolina average ratio: 1.80 : 1 North Carolina average ratio: 1.80 : 1See full North Carolina ranking
Avg staff/day 51
Average shift 7.6 hours
5% worse than North Carolina average
North Carolina average: 8 hours North Carolina average shift: 8 hoursSee full North Carolina ranking
Total staff hours (quarter) 35,807

Nursing staff breakdown

Q4 2025 · Oct 1 – Dec 31 More info This data comes from the CMS Payroll-Based Journal report covering October 1 – December 31, 2025.
Registered Nurse

Manages medical care and health needs.

RN Staff Info 45 total: 7 full-time employees and 38 contractors. 45
Average shift length Info Average shift length. Calculated as total hours divided by days worked and average staff per day. 7.2 hours
Licensed Practical Nurse

Assists with medical care and medications.

LPN Staff Info 92 total: 19 full-time employees and 73 contractors. 92
Average shift length Info Average shift length. Calculated as total hours divided by days worked and average staff per day. 8 hours
Certified Nursing Assistant

Helps with daily care and mobility.

CNA Staff Info 170 total: 57 full-time employees and 113 contractors. 170
Average shift length Info Average shift length. Calculated as total hours divided by days worked and average staff per day. 7.6 hours

Contractor staffing

Q4 2025 · Oct 1 – Dec 31 More info This data comes from the CMS Payroll-Based Journal report covering October 1 – December 31, 2025.

Total hours from contractors

24.2%

8,666 contractor hours this quarter

Certified Nursing Assistant: 113 Licensed Practical Nurse: 73 Registered Nurse: 38 Respiratory Therapy Technician: 7 Physical Therapy Assistant: 7 Speech Language Pathologist: 5 Physical Therapy Aide: 5 Qualified Social Worker: 5 Occupational Therapy Assistant: 1

Staff by category

Q4 2025 · Oct 1 – Dec 31 More info This data comes from the CMS Payroll-Based Journal report covering October 1 – December 31, 2025.
Certified Nursing Assistant5711317016,83892100%7.6
Licensed Practical Nurse1973926,50392100%8
Registered Nurse738452,07792100%7.2
Medication Aide/Technician6062,06292100%8.4
Clinical Nurse Specialist3031,3376874%7.7
Other Dietary Services Staff2029637582%8.4
RN Director of Nursing2029086672%7.9
Speech Language Pathologist0558897885%7
Qualified Social Worker0557207076%6.4
Physical Therapy Assistant0776157683%6.4
Respiratory Therapy Technician0775407379%6.1
Dietitian1015196672%7.9
Physical Therapy Aide0555087379%6.4
Mental Health Service Worker1014465863%7.7
Administrator1014435964%7.5
Nurse Practitioner1014085459%7.6
Occupational Therapy Assistant0113444%8.4
170 Certified Nursing Assistant
% of Days 100%
92 Licensed Practical Nurse
% of Days 100%
45 Registered Nurse
% of Days 100%
6 Medication Aide/Technician
% of Days 100%
3 Clinical Nurse Specialist
% of Days 74%
2 Other Dietary Services Staff
% of Days 82%
2 RN Director of Nursing
% of Days 72%
5 Speech Language Pathologist
% of Days 85%
5 Qualified Social Worker
% of Days 76%
7 Physical Therapy Assistant
% of Days 83%
7 Respiratory Therapy Technician
% of Days 79%
1 Dietitian
% of Days 72%
5 Physical Therapy Aide
% of Days 79%
1 Mental Health Service Worker
% of Days 63%
1 Administrator
% of Days 64%
1 Nurse Practitioner
% of Days 59%
1 Occupational Therapy Assistant
% of Days 4%

Penalties and fines

Includes penalties issued in 2024

Federal penalties imposed by CMS for regulatory violations, including civil money penalties (fines) and denials of payment for new Medicare/Medicaid admissions.

Source: CMS Penalties Database (Data as of Jan 2026)

Total fines amount $116K Rank #62 / 105Federal fines — State benchmarkedThis home is ranked 62nd out of 105 homes in North Carolina. Shows this facility's cumulative CMS federal fine dollars versus the North Carolina average among facilities with fines, and where it ranks among 105 facilities in the pool. Lower total dollars mean a better rank.Rankings are based only on facilities in North Carolina that report data for that category. Facilities without available data are excluded from the ranking.Click the rank badge to see the full State ranking.Click here to see the full State ranking.
53% higher than North Carolina average

North Carolina average: $76K

Number of fines 3
28% more fines than North Carolina average

North Carolina average: 2.3

Payment Denials Info Serious action where Medicare and/or Medicaid temporarily stops payments for new residents until issues are fixed. 0
100% fewer payment denials than North Carolina average

North Carolina average: 0.4

Fines amount comparison
This facility $116K
North Carolina average $76K
Penalty History

Penalties are imposed by CMS for violations of federal nursing home regulations.

2 penalties in the past 3 years

Multiple penalties were reported in the last 3 years.

Civil Money Penalty Info Fines imposed for noncompliance, which can be assessed per day or per instance of violation. Nov 26, 2024
$9K
Civil Money Penalty Info Fines imposed for noncompliance, which can be assessed per day or per instance of violation. Jan 25, 2024
$6K

Last updated: Jan 2026

Quality of care over time

These measures show how residents usually do over time at this home, based on health outcomes and preventive care.

High-risk clinical events score Info A composite score based on pressure ulcers, falls with injury, weight loss, walking ability decline, and activities of daily living decline. 8.8
23% better than North Carolina average

North Carolina average: 11.5

Functional decline score Info A composite score based on activities of daily living decline, walking ability decline, and incontinence. 19.4
6% better than North Carolina average

North Carolina average: 20.6

Long-stay resident measures
Significantly above average North Carolina avg: 2.9 Info CMS star rating based on long-stay quality measure performance. 5 stars = significantly above average, 1 star = significantly below average.
Need for Help with Daily Activities Increased Info Percent of long-stay residents whose need for help with daily activities has increased 12.4%
29% better than North Carolina average

North Carolina average: 17.5%

Walking Ability Worsened Info Percent of long-stay residents whose ability to move independently worsened 17.8%
24% better than North Carolina average

North Carolina average: 23.3%

Low Risk Residents with Bowel/Bladder Incontinence Info Percent of low risk long-stay residents who lose control of their bowels or bladder 27.9%
30% worse than North Carolina average

North Carolina average: 21.4%

Falls with Major Injury Info Percent of long-stay residents experiencing one or more falls with major injury 0.7%
80% better than North Carolina average

North Carolina average: 3.6%

High Risk Residents with Pressure Ulcers Info Percent of long-stay high risk residents with pressure ulcers 6.1%
In line with North Carolina average

North Carolina average: 6.3%

Urinary Tract Infection Info Percent of long-stay residents with a urinary tract infection 0.7%
72% better than North Carolina average

North Carolina average: 2.6%

Lost Too Much Weight Info Percent of long-stay residents who lose too much weight 7.2%
In line with North Carolina average

North Carolina average: 7.4%

Depressive Symptoms Info Percent of long-stay residents who have depressive symptoms 0.0%
100% better than North Carolina average

North Carolina average: 4.4%

Antipsychotic Use Info Percent of long-stay residents who received an antipsychotic medication 10.2%
24% better than North Carolina average

North Carolina average: 13.4%

Pneumococcal Vaccine Info Percent of long-stay residents assessed and appropriately given the pneumococcal vaccine 76.6%
16% worse than North Carolina average

North Carolina average: 91.6%

Influenza Vaccine Info Percent of long-stay residents assessed and appropriately given the seasonal influenza vaccine 94.7%
In line with North Carolina average

North Carolina average: 94.1%

Hospitalizations per 1,000 days Info Number of hospitalizations per 1,000 long-stay resident days. 1.25
29% better than North Carolina average

North Carolina average: 1.77

ED visits per 1,000 days Info Number of outpatient emergency department visits per 1,000 long-stay resident days. 1.91
5% worse than North Carolina average

North Carolina average: 1.82

Short-stay resident measures
Average North Carolina avg: 2.9 Info CMS star rating based on short-stay quality measure performance. 5 stars = much above average, 1 star = much below average.
Pneumococcal Vaccine Info Percent of short-stay residents assessed and appropriately given the pneumococcal vaccine 40.2%
50% worse than North Carolina average

North Carolina average: 79.9%

Antipsychotic medication increase Info Percent of short-stay residents who newly received an antipsychotic medication 2.8%
85% worse than North Carolina average

North Carolina average: 1.5%

Influenza Vaccine Info Percent of short-stay residents assessed and appropriately given the seasonal influenza vaccine 45.7%
41% worse than North Carolina average

North Carolina average: 78.1%

Re-hospitalized after SNF stay Info Percentage of short-stay residents who were re-hospitalized after their nursing home admission. 25.5%
11% worse than North Carolina average

North Carolina average: 22.9%

Emergency department visits Info Percentage of short-stay residents who had an outpatient emergency department visit. 8.4%
36% better than North Carolina average

North Carolina average: 13.2%

Falls with major injury Info Percentage of SNF residents who experience falls with major injury during their stay. 0.0%
100% better than North Carolina average

North Carolina average: 0.8%

Ability to care for self at discharge Info Percentage of residents at or above expected ability to care for themselves at discharge. 53.7%
In line with North Carolina average

North Carolina average: 53.7%

Successful return to home or community Info Rate of successful return to home or community from a skilled nursing facility. 51.1%
In line with North Carolina average

North Carolina average: 50.6%

Breakdown by payment type

Medicare

26% of new residents, usually for short-term rehab.

Typical stay 21 days

Private pay

61% of new residents, often for short stays.

Typical stay 29 days

Medicaid

13% of new residents, often for long-term daily care.

Typical stay 6 - 7 months

Facility Characteristics

Source: CMS Long-Term Care Facility Characteristics (Data as of Jan 2026)

Total residents 84
Medicare
6
7.1% of residents
Medicaid
51
60.7% of residents
Private pay or other
27
32.1% of residents
Programs & Services
Residents Group

Residents meet regularly to discuss policies, care quality, and activities

Active Resident Council

Organized group of residents that meets regularly to discuss facility policies, quality of life, and activities.

Finances and operations

Based on CMS SNF Cost Report for fiscal year ending in 12/2023.

For-profit
Operated by a single business entity.
Net patient revenue Info Net patient revenue — what the home actually collects for resident care, after contractual allowances, bad debt and discounts are subtracted from its gross charges (CMS cost report, Worksheet G-3). It covers resident care only; money the home earns from other sources is shown separately as "Other income."
$10.7M
Net patient income Info Net patient income: net patient revenue minus the home's total operating expenses. A positive figure means it earns more from resident care than it spends to deliver it; a negative figure means the opposite. It excludes non-operating "other income."
-$228.9K
For-profit Operated by a single business entity.
Net patient revenue Info Net patient revenue — what the home actually collects for resident care, after contractual allowances, bad debt and discounts are subtracted from its gross charges (CMS cost report, Worksheet G-3). It covers resident care only; money the home earns from other sources is shown separately as "Other income."
$10.7M Rank #73 / 104Revenue — State benchmarkedThis home is ranked 73rd out of 104 homes in North Carolina. Shows this facility's annual revenue compared to the North Carolina average. Higher revenue generally means more resources for staffing and capital — read alongside Payroll %.Rankings are based only on facilities in North Carolina that report data for that category. Facilities without available data are excluded from the ranking.Click the rank badge to see the full State ranking.Click here to see the full State ranking.
Net patient income Info Net patient income: net patient revenue minus the home's total operating expenses. A positive figure means it earns more from resident care than it spends to deliver it; a negative figure means the opposite. It excludes non-operating "other income."
-$228.9K
Other income Info Money the home earns outside of resident care — such as investments, grants, rentals and other non-operating sources (CMS cost report, Worksheet G-3). It is tracked separately from net patient revenue: it is not part of that figure, and it is not included in net patient income.
$193.5K
Payroll costs Info Staff salaries plus wage-related costs — benefits such as payroll taxes, health insurance and retirement — from the home's own accounting records (CMS cost report, Worksheet A). Contract or agency labor is counted separately, under other operating costs. Rank #75 / 104Payroll — State benchmarkedThis home is ranked 75th out of 104 homes in North Carolina. Shows total annual staff payroll benchmarked to the North Carolina average. Higher payroll investment relative to peers often signals better staffing and less reliance on cheaper contract labor.Rankings are based only on facilities in North Carolina that report data for that category. Facilities without available data are excluded from the ranking.Click the rank badge to see the full State ranking.Click here to see the full State ranking.
$3.7M 34.5% of net patient revenue Info Payroll as a share of revenue: staff salaries and wage-related benefits divided by net patient revenue. A higher figure means more of each revenue dollar goes to staff pay. Rank #40 / 104Payroll % — State benchmarkedThis home is ranked 40th out of 104 homes in North Carolina. Shows payroll as a percentage of revenue versus the North Carolina average. Well-run North Carolina facilities typically land around 49–62% — the top third Statewide. Below 25% may signal understaffing or heavy agency use — read with Staffing ratings.Rankings are based only on facilities in North Carolina that report data for that category. Facilities without available data are excluded from the ranking.Click the rank badge to see the full State ranking.Click here to see the full State ranking.
Other operating costs Info Everything it costs to run the home apart from payroll — food, utilities, supplies, maintenance, contract labor and administration. Calculated as total operating expense minus payroll (staff salaries and wage-related benefits).
$7.2M
Total costs Info The home's total operating expense for the year — all the costs of running it, salaries included (CMS cost report, Worksheet G-3).
$10.9M

What does this home offer?

Housing options icon

Housing Options: Private / Semi-Private Rooms

Building type icon
Building type icon

Building Type: Single-story

Beauty services icon

Beauty Services

Recreational activities icon

Recreational Activities

Exercise program icon

Exercise Programs

Health Programs icon

Health Programs

Who this home usually serves

TYPE OF STAY

Primarily short stays

Residents typically stay for brief periods, with frequent admissions and discharges throughout the year.

Most new residents arrive under private pay (61% of admissions), and a typical private pay stay runs around 29 days.

Admissions
560 total

Coverage residents most often arrive under.

Medicare 26%
Private pay 61%
Medicaid 13%
Discharges
515 total

Coverage residents most often leave under.

Medicare 20%
Private pay 66%
Medicaid 14%

Places of interest near Pineville Rehabilitation & Living Center

Address 0.6 miles from city center Info Estimated distance in miles from Pineville's city center to Pineville Rehabilitation & Living Center's address, calculated via Google Maps.

Calculate Travel Distance to Pineville Rehabilitation & Living Center

Add your location

Address

Compare Nursing Homes around Mecklenburg County

The information below is reported by the North Carolina Department of Health and Human Services, Division of Health Service Regulation.

5 facilities compared · CMS & NC Dept. of Health data

Pineville Rehabilitation & Living Center
NH
AL
HC
RC
Pineville (Lakeview Drive)
106
Facility 106
NC AVG 72
Rank #68 / 390
68.3%
Facility 68.3%
NC AVG 76.4%
Rank #154 / 271
-11%
3.96
Facility 3.96
NC AVG 3.98
Rank #43 / 97
+39%0%
$15.5k
Facility $15.5k
NC AVG $74.6k
Rank #62 / 105
45
Facility 45
NC AVG 20.9
Rank #95 / 101
9.0
Facility 9.0
NC AVG 5.0
Rank #97 / 101
396A+
25
Facility 25
NC AVG 33
Rank #346 / 572
Ncnh Holdings LLC
$10.7M
Facility $10.7M
NC AVG $13.2M
Rank #73 / 104
$3.7M
Facility $3.7M
NC AVG $4.9M
Rank #75 / 104
34.5%
Facility 34.5%
NC AVG 39.8%
Rank #40 / 104
345415
Wilora Lake Healthcare Center – NC West
NH
MC
Charlotte (Eastland - Wilora Lake)
70
Facility 70
NC AVG 72
Rank #186 / 390
89.1%
Facility 89.1%
NC AVG 76.4%
Rank #57 / 271
+17%
3.34
Facility 3.34
NC AVG 3.98
Rank #84 / 97
-42%-16%
$0
Facility $0
NC AVG $74.6k
Rank #1 / 105
12
Facility 12
NC AVG 20.9
Rank #45 / 101
6.0
Facility 6.0
NC AVG 5.0
Rank #80 / 101
-60-
14
Facility 14
NC AVG 33
Rank #424 / 572
Maher Chaik-Oughli
$7.7M
Facility $7.7M
NC AVG $13.2M
Rank #89 / 104
$3.2M
Facility $3.2M
NC AVG $4.9M
Rank #98 / 104
41.4%
Facility 41.4%
NC AVG 39.8%
Rank #97 / 104
345473
Clear Creek Nursing and Rehabilitation Center
NH
Mint Hill (Clear Creek Commerce Drive)
120
Facility 120
NC AVG 72
Rank #36 / 390
69.6%
Facility 69.6%
NC AVG 76.4%
Rank #151 / 271
-9%
4.71
Facility 4.71
NC AVG 3.98
Rank #24 / 97
+14%+18%
$284.0k
Facility $284.0k
NC AVG $74.6k
Rank #104 / 105
40
Facility 40
NC AVG 20.9
Rank #93 / 101
8.0
Facility 8.0
NC AVG 5.0
Rank #93 / 101
5114-
5
Facility 5
NC AVG 33
Rank #496 / 572
Coleen Anderson
$11.4M
Facility $11.4M
NC AVG $13.2M
Rank #80 / 104
$3.4M
Facility $3.4M
NC AVG $4.9M
Rank #53 / 104
29.9%
Facility 29.9%
NC AVG 39.8%
Rank #9 / 104
345562
Aldersgate
NH
AL
Charlotte (Windsor Park)
120
Facility 120
NC AVG 72
Rank #36 / 390
88.8%
Facility 88.8%
NC AVG 76.4%
Rank #58 / 271
+16%
0.05
Facility 0.05
NC AVG 3.98
Rank #97 / 97
-14%-99%
$48.0k
Facility $48.0k
NC AVG $74.6k
Rank #78 / 105
19
Facility 19
NC AVG 20.9
Rank #65 / 101
6.3
Facility 6.3
NC AVG 5.0
Rank #85 / 101
3113A+
40
Facility 40
NC AVG 33
Rank #225 / 572
Aldersgate United Methodist Retirement Community, Inc
$24.0M
Facility $24.0M
NC AVG $13.2M
Rank #4 / 104
$19.3M
Facility $19.3M
NC AVG $4.9M
Rank #4 / 104
80.4%
Facility 80.4%
NC AVG 39.8%
Rank #84 / 104
345544
Myers Park Nursing Center
NH
Charlotte (Myers Park)
133
Facility 133
NC AVG 72
Rank #22 / 390
66.9%
Facility 66.9%
NC AVG 76.4%
Rank #165 / 271
-12%
11.47
Facility 11.47
NC AVG 3.98
Rank #1 / 97
-67%+188%
$432.6k
Facility $432.6k
NC AVG $74.6k
Rank #105 / 105
55
Facility 55
NC AVG 20.9
Rank #101 / 101
5.0
Facility 5.0
NC AVG 5.0
Rank #67 / 101
1489A+
83
Facility 83
NC AVG 33
Rank #2 / 572
Mc M53 Spe Opco Holdco
$10.4M
Facility $10.4M
NC AVG $13.2M
Rank #84 / 104
$3.1M
Facility $3.1M
NC AVG $4.9M
Rank #83 / 104
29.8%
Facility 29.8%
NC AVG 39.8%
Rank #32 / 104
345008

Financial Assistance for
Nursing Home in North Carolina

Pineville Rehabilitation & Living Center is located in Pineville, North Carolina.
Here are the financial assistance programs available to residents in North Carolina.

Get Financial aid guidance

Community Alternatives Program for Disabled Adults

NC Medicaid CAP/DA

Age 65+ or disabled
General North Carolina resident, Medicaid- eligible, nursing home-level care need.
Income Limits (2025) ~$2,829/month 300% FBR, individual
Asset Limits $2,000 (individual), $3,000 (couple).
NC

High demand; waitlists common in urban areas.

Benefits
Personal care (5-7 hours/day) Respite (240 hours/year) Adult day care ($60/day) Home modifications ($1,500 avg.)

North Carolina Senior Care Options

NC SCO (via NFCSP)

Age Caregiver of someone 60+ (or with dementia)
General North Carolina resident.
Income Limits No strict limit; prioritizes low-income.
Asset Limits Not applicable.
NC

Limited slots; rural/urban balance.

Benefits
In-home respite (4-6 hours/day) Adult day care (~$60/day) Short-term facility care (up to 5 days)

Program of All-Inclusive Care for the Elderly (PACE)

North Carolina PACE (e.g., PACE of the Triad)

Age 55+
General NC resident (specific counties), NFLOC, safe with PACE support.
Income Limits (2025) ~$2,829/month (Medicaid-eligible); private pay option available.
Asset Limits $2,000 (individual), $3,000 (couple) for Medicaid enrollees.
NC

Available in 10+ counties (e.g., Guilford, Wake); multiple providers (e.g., PACE of the Southern Piedmont).

Benefits
Personal care (5-7 hours/day) Medical care Meals Transportation Respite Therapies

In-Home Aide Services

North Carolina In-Home Aide Services

Age 60+
General NC resident, unable to perform 1+ ADL, at risk of nursing home placement.
Income Limits (2025) No strict cap; prioritizes low-income ~$24,980/year
Asset Limits Not assessed; need-based.
NC

Family can be aides; varies by county funding.

Benefits
Personal care (5-20 hours/week) Meal prep Respite (~5 days/year) Errands

Medicare Savings Program (MSP)

North Carolina Medicare Savings Program

Age 65+ or disabled
General NC resident, Medicare Part A/B.
Income Limits (2025) ~$2,510/month (QMB), ~$3,380/month (SLMB), ~$3,598/month (QI)—individual.
Asset Limits $9,430 (individual), $14,130 (couple).
NC

Three tiers; no waitlist; includes Extra Help for Part D.

Benefits
Covers Part B premiums ($174.70/month) Deductibles ($240/year) Copays (~20%)

VA Aid and Attendance (A&A) and Housebound Benefits

North Carolina VA Aid and Attendance/Housebound

Age 65+ or disabled veteran/spouse
General NC resident, wartime service, need for ADL help (A&A) or homebound.
Income Limits (2025) Net income < ~$1,984/month (veteran with dependent, A&A); pension offsets income.
Asset Limits ~$155,356 net worth limit
NC

High veteran demand in rural/urban areas.

Benefits
Cash (~$1,433-$2,642/month veteran, ~$951-$1,318 spouse) for care costs (e.g., in-home, assisted living)

Urgent Repair Program (URP)

North Carolina Urgent Repair Program

Age 60+ prioritized
General NC resident, homeowner, low-income.
Income Limits (2025) ~$30,258/year 50% AMI, varies by county
Asset Limits Not strictly assessed; home value considered.
NC

Forgivable at $2,000/year; statewide via local partners.

Benefits
Repairs (~$8,000-$12,000 avg.) for safety (e.g., roofs, heating, accessibility)

State/County Special Assistance (SA)

North Carolina Special Assistance

Age 65+ (or disabled)
General NC resident, in licensed adult care home, low-income.
Income Limits (2025) ~$1,255/month (individual, 100% FPL); varies by facility rate.
Asset Limits $2,000 individual
NC

Covers assisted living; counties supplement state funds.

Benefits
Cash (~$1,200-$1,500/month) for room/board; Medicaid covers care services

Frequently Asked Questions about Pineville Rehabilitation & Living Center

What neighborhood is Pineville Rehabilitation & Living Center in?

Pineville Rehabilitation & Living Center is in the Lakeview Drive neighborhood of Pineville.

Is Pineville Rehabilitation & Living Center in a walkable area?

Pineville Rehabilitation & Living Center has a walk score of 25. Somewhat walkable. A few nearby services may be reachable on foot, but most trips require transportation.

What is the occupancy rate at Pineville Rehabilitation & Living Center?

Pineville Rehabilitation & Living Center's occupancy is 68.3%.

Does Pineville Rehabilitation & Living Center operate as a for-profit or non-profit?

Pineville Rehabilitation & Living Center is registered as a for-profit in NC.

Are there photos of Pineville Rehabilitation & Living Center?

Yes — there are 3 photos of Pineville Rehabilitation & Living Center in the photo gallery on this page.

What is the address of Pineville Rehabilitation & Living Center?

Pineville Rehabilitation & Living Center is located at 1010 Lakeview Dr, Pineville, NC 28134.

What is the phone number of Pineville Rehabilitation & Living Center?

(704) 889-2273 will put you in contact with the team at Pineville Rehabilitation & Living Center.

Guides for Better Senior Living

Care Cost Calculator: See Prices in Your Area

Nursing Home Data Explorer

Don’t Wait Too Long: 7 Red Flag Signs Your Parent Needs Assisted Living Now

The True Cost of Assisted Living in 2025 – And How Families Are Paying For It

Understanding Senior Living Costs: Pricing Models, Discounts & Financial Assistance