


Total health inspections
3
State average N/A
Last Health inspection on Aug 2025

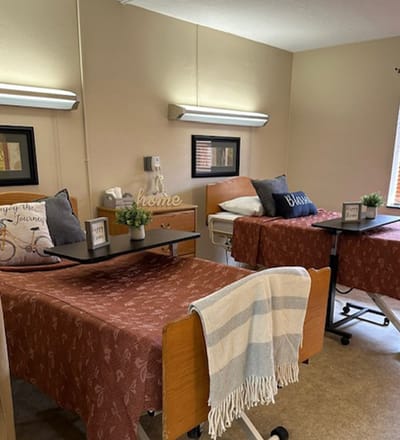


Owned by Trella Wilson, Clinton Place is a 101-bed nursing home offering skilled nursing and rehabilitation services in Clinton, Kentucky. Medicare, Medicaid, and private pay provide flexible payment options for families. The community maintains an 80 percent occupancy rate, with residents averaging a 187-day stay length, signaling a mix of short-term rehabilitation and longer-term care.
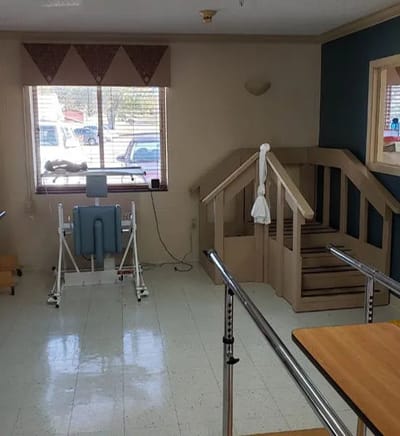
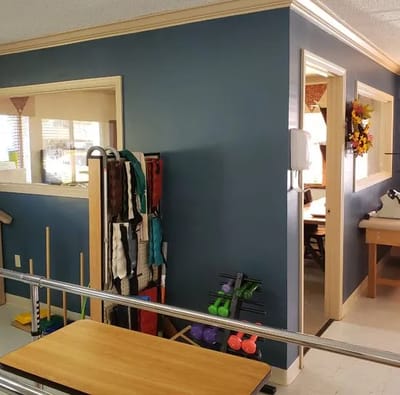
The facility delivers substantial hands-on nursing care, with total nursing support averaging 3 hours 14 minutes per resident daily. This staffing level is anchored by registered nurses, nurse aides, and licensed practical nurses working together to provide daily care. The emphasis on rehabilitation services makes Clinton Place a grounded choice for occupants recuperating from hospital stays, surgery, or other acute events requiring skilled nursing support. While the area has a Walk Score of 27, indicating that some services are walkable but most trips require transportation, the location offers easy access for visiting family members seeking to regularly contact loved ones.
Over the past seven years, state inspections have shown Clinton Place has maintained compliance with regulatory requirements.
| Staff type | Hours / Day / Resident | vs state avg |
|---|---|---|
|
Registered Nurse (RN)
| 36m per day | ▼ 21% State avg: 46m per day · National avg: 41m per day |
|
LPN / LVN
| 33m per day | ▼ 32% State avg: 49m per day · National avg: 52m per day |
|
Nurse Aide
| 1h 57m per day | ▼ 20% State avg: 2h 26m per day · National avg: 2h 20m per day |
|
Weekend Total Nursing
| 2h 39m per day | ▼ 24% State avg: 3h 30m per day · National avg: 3h 26m per day |
|
Physical Therapist
| 1m per day | ▼ 71% State avg: 4m per day · National avg: 4m per day |
|
Weekend RN
| 21m per day | ▼ 31% State avg: 31m per day · National avg: 28m per day |
Clinton Place is administered by Trella Wilson.
In Kentucky, the Cabinet for Health and Family Services, Office of Inspector General is the regulatory authority that conducts inspections and investigates complaints in all long-term care homes.
Deficiencies
| This Facility | KY Average | vs. KY Avg |
|---|---|---|---|
|
Total deficiencies
| 15 | 6 | This facility has 150% more total deficiencies than a typical Kentucky assisted living residence (15 vs. KY avg 6).↑ 150% worse |
|
Deficiencies per year
| 2.1 | 0.9 | This facility has 133% more deficiencies per year than a typical Kentucky assisted living residence (2.1 vs. KY avg 0.9).↑ 133% worse |
|
Deficiencies per inspection
| 5 | 1.5 | This facility has 233% more deficiencies per inspection than a typical Kentucky assisted living residence (5 vs. KY avg 1.5).↑ 233% worse |
Inspections
| This Facility | KY Average | vs. KY Avg |
|---|---|---|---|
|
Total inspections
| 3 | 4 | This facility has had 25% fewer total inspections than the Kentucky average (3 vs. KY avg 4). More inspections can mean more regulatory scrutiny rather than worse care.↓ 25% fewer |
State average N/A
Last Health inspection on Aug 2025
State average N/A
State average N/A
Health citations are formal notices following inspections when they fail to comply with safety and care standards.
12 of 14 citations resulted from standard inspections; and 2 of 14 came from combined inspections (standard and complaint).
State average: N/A
State average: N/A
Reporting period: October 1 – December 31, 2025 (Q4 2025). Source: CMS Payroll-Based Journal report.
State average ratio: 0 : 0
State average: 0 hours
Manages medical care and health needs.
Assists with medical care and medications.
Helps with daily care and mobility.
Total hours from contractors
2,381 contractor hours this quarter
| Certified Nursing Assistant | 51 | 0 | 51 | 14,601 | 92 | 100% | 8.9 |
| Licensed Practical Nurse | 14 | 0 | 14 | 4,299 | 92 | 100% | 9.1 |
| Registered Nurse | 7 | 0 | 7 | 2,812 | 90 | 98% | 10.8 |
| Clinical Nurse Specialist | 5 | 0 | 5 | 1,362 | 69 | 75% | 6.7 |
| Dietitian | 3 | 0 | 3 | 1,187 | 79 | 86% | 7.5 |
| Speech Language Pathologist | 0 | 4 | 4 | 985 | 67 | 73% | 7.5 |
| Medication Aide/Technician | 1 | 0 | 1 | 547 | 49 | 53% | 11.2 |
| Administrator | 1 | 0 | 1 | 528 | 66 | 72% | 8 |
| Nurse Practitioner | 1 | 0 | 1 | 528 | 66 | 72% | 8 |
| Physical Therapy Aide | 0 | 3 | 3 | 497 | 68 | 74% | 6.5 |
| Mental Health Service Worker | 1 | 0 | 1 | 485 | 64 | 70% | 7.6 |
| Physical Therapy Assistant | 0 | 2 | 2 | 450 | 56 | 61% | 8 |
| Qualified Social Worker | 0 | 3 | 3 | 299 | 66 | 72% | 4.5 |
| Respiratory Therapy Technician | 0 | 4 | 4 | 150 | 34 | 37% | 4.3 |
Includes penalties issued in 2024
Federal penalties imposed by CMS for regulatory violations, including civil money penalties (fines) and denials of payment for new Medicare/Medicaid admissions.
Source: CMS Penalties Database (Data as of Jan 2026)
State average: $63K
State average: 2.3
State average: 0.3
Penalties are imposed by CMS for violations of federal nursing home regulations.
1 penalty in the past 3 years
Jun 28, 2024 · $9K
Last updated: Jan 2026
These measures show how residents usually do over time at this home, based on health outcomes and preventive care.
State average: 10.5
State average: 18.9
State average: 16.8%
State average: 19.6%
State average: 20.5%
State average: 3.8%
State average: 5.8%
State average: 1.9%
State average: 6.8%
State average: 14.3%
State average: 15.6%
State average: 93.9%
State average: 96.2%
State average: 1.87
State average: 2.19
State average: 83.7%
State average: 1.9%
State average: 83.6%
State average: 24.5%
State average: 13.9%
State average: 0.8%
State average: 53.7%
State average: 50.6%
Quality measures are calculated from Minimum Data Set (MDS) assessments. For most measures, lower percentages indicate better care quality.
34% of new residents, usually for short-term rehab.
15% of new residents, often for short stays.
51% of new residents, often for long-term daily care.
Source: CMS Long-Term Care Facility Characteristics (Data as of Jan 2026)
Residents meet regularly to discuss policies, care quality, and activities
Family members meet regularly to discuss policies, care quality, and activities
State-approved Nurse Aide Training and Competency Evaluation Program on-site
Organized group of family members that meets regularly to discuss facility policies, resident care, and activities.
Organized group of residents that meets regularly to discuss facility policies, quality of life, and activities.
Data sourced from CMS Long-Term Care Facility Characteristics quarterly report. Payer mix reflects the current resident census by primary payment source.
Historical financial and operational data for Clinton Place from 2013–2023, based on CMS SNF Cost Reports.
Key figures below are for fiscal year ending in 12/2023.
Based on CMS SNF Cost Report for fiscal year ending in 12/2023.
Most residents stay for extended periods and receive ongoing daily care.
Most new residents arrive under Medicaid (51% of admissions), and a typical Medicaid stay runs around 8 months.
Coverage residents most often arrive under.
Coverage residents most often leave under.
![]() 0.0 miles from city center
0.0 miles from city center
![]() Estimated distance in miles from Clinton's city center to Clinton Place's address, calculated via Google Maps.
Estimated distance in miles from Clinton's city center to Clinton Place's address, calculated via Google Maps.
Add your location
The information below is reported by the Kentucky Cabinet for Health and Family Services, Office of Inspector General.
| Thomson-Hood Veterans Center | NH | Wilmore | - | 285 | - | 61 | - |
| Redbanks Colonial Terrace | NH IL MC SNF | Sebree | - | 87 | A+ | 41 | - |
| Middlesboro Nursing and Rehabilitation Facility | NH SNF | Middlesboro | - | 95 | - | 62 | - |
| Signature Healthcare of Monroe County Rehab and Well | NH HOS PC RC SNF | Tompkinsville | - | 104 | - | 53 | - |
| Clinton Place | NH MC SNF | Clinton | - | 101 | - | 27 | - |
Clinton Place is legally operated by Birchwood Nursing and Rehabilitation, LLC, and administered by Trella Wilson.
Clinton Place has a walk score of 27. Somewhat walkable. A few nearby services may be reachable on foot, but most trips require transportation.
According to KY state health department records, Clinton Place's license number is 100181.
Clinton Place's occupancy is 80.0%.
No, Clinton Place has a no-pet policy.
Clinton Place is registered as a for-profit in KY.
Trella Wilson is the administrator of Clinton Place.
Care Cost Calculator: See Prices in Your Area
Nursing Home Data Explorer
Don’t Wait Too Long: 7 Red Flag Signs Your Parent Needs Assisted Living Now
The True Cost of Assisted Living in 2025 – And How Families Are Paying For It
Understanding Senior Living Costs: Pricing Models, Discounts & Financial Assistance


