Clovernook Health Care LLC
Nursing Home & Respite Care · Cincinnati, OH
CMS overall rating Info CMS (the Centers for Medicare & Medicaid Services) is the federal agency that rates nursing home quality. Its Overall Rating runs from 1 to 5 stars, combining health inspections, staffing, and quality measures, with inspections weighted most heavily.

Clovernook Health Care LLC

Nursing Home & Respite Care · Cincinnati, OH
CMS overall rating Info CMS (the Centers for Medicare & Medicaid Services) is the federal agency that rates nursing home quality. Its Overall Rating runs from 1 to 5 stars, combining health inspections, staffing, and quality measures, with inspections weighted most heavily.
Calculator: See prices in your area
Clovernook Health Care LLC accepts Medicare, Medicaid, and private pay.

Overview of Clovernook Health Care LLC

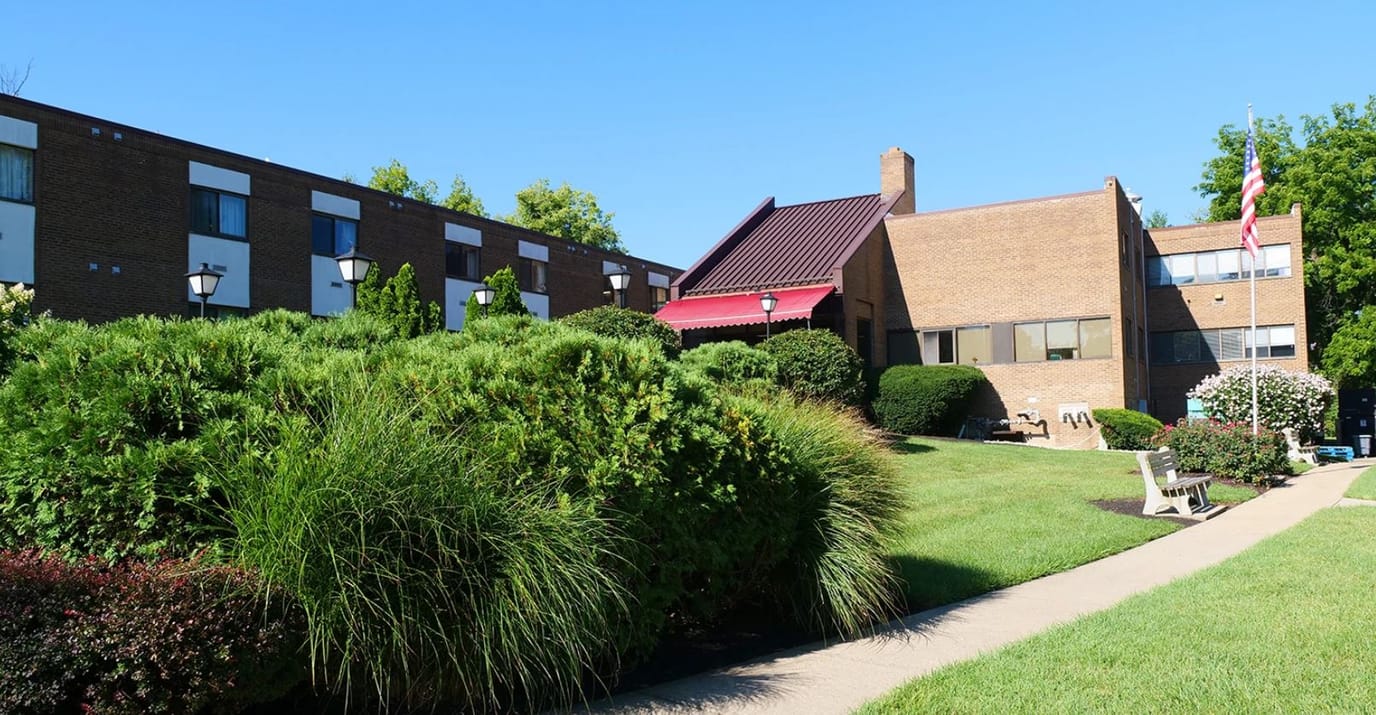
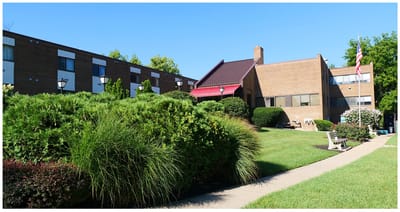
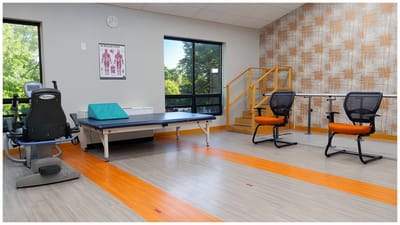
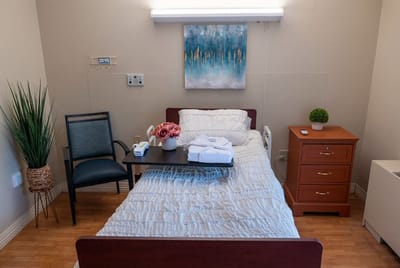
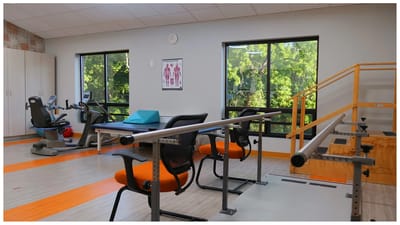
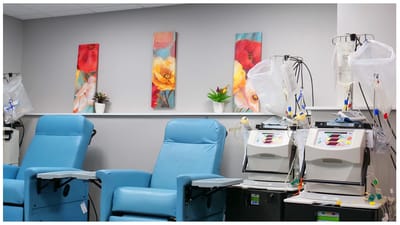
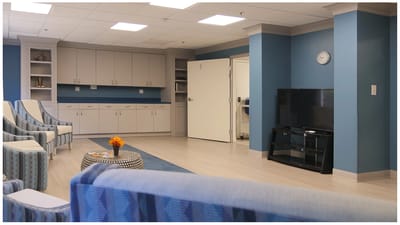
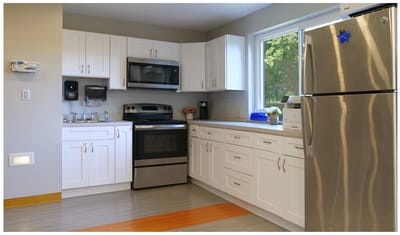
Situated in Cincinnati, OH, Clovernook Healthcare is a well-established senior care provider, offering short-term rehabilitation, long-term care and respite stays. The community provides a comfortable recovery environment with their thoughtfully designed suites with access to WiFi, in-room phone service and cabled TV. Guaranteeing unmatched hospitality and care services, the community features a tenured team of care professionals with licensed nurses available to provide support 24/7.

With a personalized approach to care that is backed by years of experience and knowledge, the community ensures residents a fast and comfortable healing journey. In addition to comprehensive care services, the community ensures residents’ need for leisure and enjoyment are met with their variety of activities and amenities. Residents enjoy weekly outings, chef-prepared meals, and refreshing outdoor seating areas. With a perfect blend of care, dedicated team, and interesting amenities, residents are sure to get back on living their best lives.

Quality ratings

Measured by Centers for Medicare & Medicaid Services (CMS)

Overall rating Info The Overall CMS Rating combines results from health inspections, staffing levels and quality measures. Health inspections carry the most weight. Staffing and quality scores can increase or decrease the final rating based on performance compared to state and national standards.
▼ 37.1% Below OH avg. ▼ 37.1% Below OH avg.OH average: 3.2Click the badge to see the full State ranking.Click here to see the full State ranking.
Health Inspection Info Based on the results of the facility's three most recent standard inspections and any complaint investigations. CMS reviews the number, scope, and severity of deficiencies, with more recent findings weighted more heavily.
▼ 28.6% Below OH avg. ▼ 28.6% Below OH avg.OH average: 2.8Click the badge to see the full State ranking.Click here to see the full State ranking.
Staffing Info Measures average nursing staff hours per resident per day, including Registered Nurses (RNs) and total nursing staff. Ratings are adjusted based on the level of care residents require and are compared to state and national benchmarks.
▼ 18.1% Below OH avg. ▼ 18.1% Below OH avg.OH average: 2.4Click the badge to see the full State ranking.Click here to see the full State ranking.
Quality Measures Info Based on clinical and physical health indicators reported to CMS, such as hospital readmissions, falls, pressure ulcers, and improvements in mobility. These measures reflect how well residents' health needs are being managed.
▼ 8.2% Below OH avg. ▼ 8.2% Below OH avg.OH average: 4.4Click the badge to see the full State ranking.Click here to see the full State ranking.

Staffing hours breakdown

Info Daily nursing hours per resident by staff type, reported to CMS. Higher is generally better — compare this facility to state and national averages to see where staffing stands.

Hours per resident per day — compared to Ohio state averages

Total nursing care / resident Info This home is ranked 99th out of 210 homes in Ohio for nurse hours. Total adjusted nursing hours per resident per day, combining RN, LPN, and aide time. CMS adjusts this for case-mix so facilities can be fairly compared.
3h 33m per day
Rank #99 / 210Nurse hours — State benchmarkedThis home is ranked 99th out of 210 homes in Ohio. Shows adjusted nurse hours per resident per day benchmarked to the Ohio average, with a ranking across 210 Ohio facilities. More hours mean more direct care. The national average is about 3.5 hrs; below 3.0 is a red flag.Rankings are based only on facilities in Ohio that report data for that category. Facilities without available data are excluded from the ranking.Click the rank badge to see the full State ranking.Click here to see the full State ranking.
This facility Ohio avg (3h 32m per day)
vs Ohio avg
+0%

3 of 6 metrics below state avg

Standout metric LPN / LVN is +9% above state avg
Staff typeHours / Day / Residentvs state avg
Registered Nurse (RN) Info RNs hold the highest nursing license and can assess residents, interpret test results, and direct care plans. More RN hours per day often signals stronger clinical oversight and faster response to health changes. 28m per day ▼ 25% State avg: 38m per day · National avg: 41m per day
LPN / LVN Info Licensed Practical Nurses (LPNs) or Licensed Vocational Nurses (LVNs) deliver routine hands-on care — medication administration, wound dressing, and monitoring vital signs. They work under RN supervision and make up a large share of daily bedside care. 1h 3m per day ▲ 9% State avg: 58m per day · National avg: 52m per day
Nurse Aide Info Certified Nurse Aides (CNAs) provide the most direct day-to-day assistance: bathing, dressing, feeding, and mobility. Nurse aide hours are typically the largest staffing category and directly affect residents' quality of life. 2h 18m per day ▲ 8% State avg: 2h 7m per day · National avg: 2h 20m per day
Weekend Total Nursing Info Combined nursing hours (RN + LPN + Nurse Aide) per resident per day on weekends. Staffing often drops on weekends — this figure reveals whether the facility maintains adequate coverage outside of weekday hours. 3h 21m per day ■ Avg State avg: 3h 20m per day · National avg: 3h 27m per day
Physical Therapist Info Hours per resident per day provided by licensed Physical Therapists (PTs) or PT Assistants. PT services help residents recover mobility after injury or illness and are especially important for post-acute (short-stay) rehabilitation. 2m per day ▼ 44% State avg: 3m per day · National avg: 4m per day
Weekend RN Info Registered nurse hours specifically on weekends. Facilities sometimes reduce RN presence on Saturdays and Sundays — a low weekend RN figure compared to weekday hours can indicate reduced clinical oversight when most administrative staff are absent. 10m per day ▼ 59% State avg: 25m per day · National avg: 29m per day

Capacity and availability

This home usually has limited availability

Higher occupancy than the Ohio average: 78.7%
Occupancy rate
86.1% Rank #98 / 211Occupancy rate — State benchmarkedThis home is ranked 98th out of 211 homes in Ohio. Shows this facility's occupancy rate versus the Ohio average, with its Statewide rank out of 211. Higher occupancy signals strong local demand and financial stability.Rankings are based only on facilities in Ohio that report data for that category. Facilities without available data are excluded from the ranking.Click the rank badge to see the full State ranking.Click here to see the full State ranking.
Avg. Length of Stay
121 days
Bed community size
126-bed community Rank #39 / 323Bed count — State benchmarkedThis home is ranked 39th out of 323 homes in Ohio. Shows this facility's certified or reported bed count compared to other Ohio facilities. Larger communities may offer more amenities, programs, and on-site services for residents and families.Rankings are based only on facilities in Ohio that report data for that category. Facilities without available data are excluded from the ranking.Click the rank badge to see the full State ranking.Click here to see the full State ranking.
A larger shared setting that may offer more common spaces and organized community services.
Years in operation
19 years in operation
A longer operating history, which may indicate experience navigating regulations and delivering ongoing care.
Walk Score
Walk Score: 18 / 100 Rank #561 / 705Walk Score — State benchmarkedThis home is ranked 561st out of 705 homes in Ohio. Shows how walkable this facility's neighborhood is compared to the average Walk Score across Ohio facilities. Higher scores benefit residents, families, and staff.Rankings are based only on facilities in Ohio that report data for that category. Facilities without available data are excluded from the ranking.Click the rank badge to see the full State ranking.Click here to see the full State ranking.
Car-dependent. Most errands require a car, with limited nearby walkable options.
BBB Rating
BBB Rating: A+ (Accredited)
An independent rating from the Better Business Bureau based on factors such as complaint history, transparency, and business practices.
How BBB ratings work

About this community

License Details

CMS Certification Number365551

Staffing

Key information about the people who lead and staff this community.

Leadership

ContactMs. Mercedes Perez, Owner

Therapy & Rehabilitation

3 services
Rehabilitation Services
Respite Care
Short-Term Rehab

Staffing & Medical

1 service
24-Hour Staffing

Amenities & Lifestyle

Gourmet Meals
On-Site Beauty Salon
Updated Suites And Lounges
Outdoor Seating Areas
Weekly Outings
Religious Services
Socials And Meet Ups
ActivitiesComprehensive activity schedule available
Specific ProgramsIn-House Dialysis, Pain management, Stroke and neurological care, Cardiac conditioning programs, Comprehensive resident-centered care plan
Religious Services

Contact Clovernook Health Care LLC

Health Inspection History

Inspections since 2019
Total health inspections 15

Ohio average 6.7


Last Health inspection on Sep 2025

Total health citations
38 Rank #150 / 210Health citations — State benchmarkedThis home is ranked 150th out of 210 homes in Ohio. Shows this facility's total health deficiency citations benchmarked to the Ohio State average, with a ranking across all 210 OH facilities. Lower citation counts earn a better rank.Rankings are based only on facilities in Ohio that report data for that category. Facilities without available data are excluded from the ranking.Click the rank badge to see the full State ranking.Click here to see the full State ranking.

Ohio average 30.9

Citations per inspection
2.53 Rank #27 / 210Citations per inspection — State benchmarkedThis home is ranked 27th out of 210 homes in Ohio. Shows average deficiency citations per CMS inspection for this facility versus the Ohio mean across 210 facilities with citation data. Lower is better.Rankings are based only on facilities in Ohio that report data for that category. Facilities without available data are excluded from the ranking.Click the rank badge to see the full State ranking.Click here to see the full State ranking.

Ohio average 4.59


Health citations are formal notices following inspections when they fail to comply with safety and care standards.

18 of 38 citations resulted from standard inspections; 19 of 38 resulted from complaint investigations; and 1 of 38 came from combined inspections (standard and complaint).

Breakdown of citation severity (last 7 years)
Critical health citations
0
100% better than Ohio average

Ohio average: 0.3


Serious health citations
1
11% worse than Ohio average

Ohio average: 0.9

0 critical citations Ohio average: 0.3

1 serious citation Ohio average: 0.9

37 moderate citations Ohio average: 29

0 minor citations Ohio average: 0.7
Citations history (last 7 years)
Quality of Care moderate citation Sep 22, 2025
Corrected

Administration moderate citation Feb 04, 2025
Corrected

Quality of Care moderate citation Feb 04, 2025
Corrected

Quality of Care moderate citation Feb 04, 2025
Corrected

Staffing Data

Reporting period: October 1 – December 31, 2025 (Q4 2025). Source: CMS Payroll-Based Journal report.

Total staff 262
Employees 142
Contractors 120
Staff to resident ratio 2.32 : 1
14% more staff per resident than Ohio average
Ohio average ratio: 2.04 : 1 Ohio average ratio: 2.04 : 1See full Ohio ranking
Avg staff/day 54
Average shift 8.6 hours
6% better than Ohio average
Ohio average: 8.1 hours Ohio average shift: 8.1 hoursSee full Ohio ranking
Total staff hours (quarter) 42,735

Nursing staff breakdown

Q4 2025 · Oct 1 – Dec 31 More info This data comes from the CMS Payroll-Based Journal report covering October 1 – December 31, 2025.
Registered Nurse

Manages medical care and health needs.

RN Staff Info 16 total: 8 full-time employees and 8 contractors. 16
Average shift length Info Average shift length. Calculated as total hours divided by days worked and average staff per day. 9.8 hours
Licensed Practical Nurse

Assists with medical care and medications.

LPN Staff Info 56 total: 29 full-time employees and 27 contractors. 56
Average shift length Info Average shift length. Calculated as total hours divided by days worked and average staff per day. 9.4 hours
Certified Nursing Assistant

Helps with daily care and mobility.

CNA Staff Info 134 total: 82 full-time employees and 52 contractors. 134
Average shift length Info Average shift length. Calculated as total hours divided by days worked and average staff per day. 8.8 hours

Contractor staffing

Q4 2025 · Oct 1 – Dec 31 More info This data comes from the CMS Payroll-Based Journal report covering October 1 – December 31, 2025.

Total hours from contractors

11.6%

4,962 contractor hours this quarter

Certified Nursing Assistant: 52 Licensed Practical Nurse: 27 Registered Nurse: 8 Physical Therapy Assistant: 7 Qualified Social Worker: 7 Respiratory Therapy Technician: 7 Physical Therapy Aide: 3 Speech Language Pathologist: 3 RN Director of Nursing: 2 Clinical Nurse Specialist: 1 Feeding Assistant: 1 Medical Director: 1 Occupational Therapy Assistant: 1

Staff by category

Q4 2025 · Oct 1 – Dec 31 More info This data comes from the CMS Payroll-Based Journal report covering October 1 – December 31, 2025.
Certified Nursing Assistant825213420,57492100%8.8
Licensed Practical Nurse2927568,58492100%9.4
Registered Nurse88162,4298997%9.8
Medication Aide/Technician6061,8309199%8.9
Clinical Nurse Specialist4151,7447278%7.5
RN Director of Nursing3251,6799199%9.7
Other Dietary Services Staff4041,2318087%7.3
Physical Therapy Aide0339556975%7.2
Qualified Social Worker0777547177%7
Physical Therapy Assistant0774546368%6.9
Nurse Practitioner1014505964%7.6
Administrator1014435964%7.5
Speech Language Pathologist0334236368%6.3
Dietitian1014075560%7.4
Respiratory Therapy Technician0772914953%5.6
Mental Health Service Worker1012793740%7.5
Qualified Activities Professional2026789%7.5
Feeding Assistant011582830%2.1
Medical Director011521415%3.7
Occupational Therapy Assistant0113355%6.6
134 Certified Nursing Assistant
% of Days 100%
56 Licensed Practical Nurse
% of Days 100%
16 Registered Nurse
% of Days 97%
6 Medication Aide/Technician
% of Days 99%
5 Clinical Nurse Specialist
% of Days 78%
5 RN Director of Nursing
% of Days 99%
4 Other Dietary Services Staff
% of Days 87%
3 Physical Therapy Aide
% of Days 75%
7 Qualified Social Worker
% of Days 77%
7 Physical Therapy Assistant
% of Days 68%
1 Nurse Practitioner
% of Days 64%
1 Administrator
% of Days 64%
3 Speech Language Pathologist
% of Days 68%
1 Dietitian
% of Days 60%
7 Respiratory Therapy Technician
% of Days 53%
1 Mental Health Service Worker
% of Days 40%
2 Qualified Activities Professional
% of Days 9%
1 Feeding Assistant
% of Days 30%
1 Medical Director
% of Days 15%
1 Occupational Therapy Assistant
% of Days 5%

Penalties and fines

Federal penalties imposed by CMS for regulatory violations, including civil money penalties (fines) and denials of payment for new Medicare/Medicaid admissions.

Source: CMS Penalties Database

No penalties in the past 3 years

No civil money penalties or payment denials were reported in the last 3 years.

Quality of care over time

These measures show how residents usually do over time at this home, based on health outcomes and preventive care.

High-risk clinical events score Info A composite score based on pressure ulcers, falls with injury, weight loss, walking ability decline, and activities of daily living decline. 5.1
12% better than Ohio average

Ohio average: 5.8

Functional decline score Info A composite score based on activities of daily living decline, walking ability decline, and incontinence. 10.2
19% better than Ohio average

Ohio average: 12.7

Long-stay resident measures
Need for Help with Daily Activities Increased Info Percent of long-stay residents whose need for help with daily activities has increased 5.0%
27% better than Ohio average

Ohio average: 6.8%

Walking Ability Worsened Info Percent of long-stay residents whose ability to move independently worsened 9.1%
In line with Ohio average

Ohio average: 8.9%

Low Risk Residents with Bowel/Bladder Incontinence Info Percent of low risk long-stay residents who lose control of their bowels or bladder 16.6%
25% better than Ohio average

Ohio average: 22.0%

Falls with Major Injury Info Percent of long-stay residents experiencing one or more falls with major injury 1.0%
70% better than Ohio average

Ohio average: 3.4%

High Risk Residents with Pressure Ulcers Info Percent of long-stay high risk residents with pressure ulcers 3.9%
In line with Ohio average

Ohio average: 3.9%

Urinary Tract Infection Info Percent of long-stay residents with a urinary tract infection 0.3%
52% better than Ohio average

Ohio average: 0.5%

Lost Too Much Weight Info Percent of long-stay residents who lose too much weight 6.6%
6% worse than Ohio average

Ohio average: 6.2%

Depressive Symptoms Info Percent of long-stay residents who have depressive symptoms 2.5%
90% better than Ohio average

Ohio average: 24.0%

Antipsychotic Use Info Percent of long-stay residents who received an antipsychotic medication 1.6%
82% better than Ohio average

Ohio average: 8.4%

Pneumococcal Vaccine Info Percent of long-stay residents assessed and appropriately given the pneumococcal vaccine 50.3%
46% worse than Ohio average

Ohio average: 92.4%

Influenza Vaccine Info Percent of long-stay residents assessed and appropriately given the seasonal influenza vaccine 91.5%
In line with Ohio average

Ohio average: 94.5%

Short-stay resident measures
Pneumococcal Vaccine Info Percent of short-stay residents assessed and appropriately given the pneumococcal vaccine 24.2%
69% worse than Ohio average

Ohio average: 78.0%

Antipsychotic medication increase Info Percent of short-stay residents who newly received an antipsychotic medication 1.9%
50% worse than Ohio average

Ohio average: 1.3%

Influenza Vaccine Info Percent of short-stay residents assessed and appropriately given the seasonal influenza vaccine 15.9%
79% worse than Ohio average

Ohio average: 75.6%

Breakdown by payment type

Medicare

20% of new residents, usually for short-term rehab.

Typical stay 1 - 2 months

Private pay

62% of new residents, often for short stays.

Typical stay 14 days

Medicaid

18% of new residents, often for long-term daily care.

Typical stay 1 - 2 years

Facility Characteristics

Source: CMS Long-Term Care Facility Characteristics (Data as of Jan 2026)

Total residents 113
Medicare
8
7.1% of residents
Medicaid
100
88.5% of residents
Private pay or other
5
4.4% of residents
Programs & Services
Residents Group

Residents meet regularly to discuss policies, care quality, and activities

CCRC

Part of a Continuing Care Retirement Community offering multiple care levels

Active Resident Council

Organized group of residents that meets regularly to discuss facility policies, quality of life, and activities.

Finances and operations

Based on CMS SNF Cost Report for fiscal year ending in 12/2023.

For-profit
Corporation
Net patient revenue Info Net patient revenue — what the home actually collects for resident care, after contractual allowances, bad debt and discounts are subtracted from its gross charges (CMS cost report, Worksheet G-3). It covers resident care only; money the home earns from other sources is shown separately as "Other income."
$12.9M
Net patient income Info Net patient income: net patient revenue minus the home's total operating expenses. A positive figure means it earns more from resident care than it spends to deliver it; a negative figure means the opposite. It excludes non-operating "other income."
-$889.7K
For-profit Corporation
Net patient revenue Info Net patient revenue — what the home actually collects for resident care, after contractual allowances, bad debt and discounts are subtracted from its gross charges (CMS cost report, Worksheet G-3). It covers resident care only; money the home earns from other sources is shown separately as "Other income."
$12.9M Rank #53 / 210Revenue — State benchmarkedThis home is ranked 53rd out of 210 homes in Ohio. Shows this facility's annual revenue compared to the Ohio average. Higher revenue generally means more resources for staffing and capital — read alongside Payroll %.Rankings are based only on facilities in Ohio that report data for that category. Facilities without available data are excluded from the ranking.Click the rank badge to see the full State ranking.Click here to see the full State ranking.
Net patient income Info Net patient income: net patient revenue minus the home's total operating expenses. A positive figure means it earns more from resident care than it spends to deliver it; a negative figure means the opposite. It excludes non-operating "other income."
-$889.7K
Other income Info Money the home earns outside of resident care — such as investments, grants, rentals and other non-operating sources (CMS cost report, Worksheet G-3). It is tracked separately from net patient revenue: it is not part of that figure, and it is not included in net patient income.
$1.2M
Payroll costs Info Staff salaries plus wage-related costs — benefits such as payroll taxes, health insurance and retirement — from the home's own accounting records (CMS cost report, Worksheet A). Contract or agency labor is counted separately, under other operating costs. Rank #48 / 210Payroll — State benchmarkedThis home is ranked 48th out of 210 homes in Ohio. Shows total annual staff payroll benchmarked to the Ohio average. Higher payroll investment relative to peers often signals better staffing and less reliance on cheaper contract labor.Rankings are based only on facilities in Ohio that report data for that category. Facilities without available data are excluded from the ranking.Click the rank badge to see the full State ranking.Click here to see the full State ranking.
$5.9M 45.8% of net patient revenue Info Payroll as a share of revenue: staff salaries and wage-related benefits divided by net patient revenue. A higher figure means more of each revenue dollar goes to staff pay. Rank #105 / 210Payroll % — State benchmarkedThis home is ranked 105th out of 210 homes in Ohio. Shows payroll as a percentage of revenue versus the Ohio average. Well-run Ohio facilities typically land around 54–64% — the top third Statewide. Below 25% may signal understaffing or heavy agency use — read with Staffing ratings.Rankings are based only on facilities in Ohio that report data for that category. Facilities without available data are excluded from the ranking.Click the rank badge to see the full State ranking.Click here to see the full State ranking.
Other operating costs Info Everything it costs to run the home apart from payroll — food, utilities, supplies, maintenance, contract labor and administration. Calculated as total operating expense minus payroll (staff salaries and wage-related benefits).
$7.9M
Total costs Info The home's total operating expense for the year — all the costs of running it, salaries included (CMS cost report, Worksheet G-3).
$13.8M

What does this home offer?

Housing options icon

Housing Options: 1 Bed

Building type icon
Building type icon

Building Type: 3-story

Transportation services icon

Transportation Services

Fitness and recreation icon

Fitness and Recreation

Who this home usually serves

TYPE OF STAY

Primarily short stays

Residents typically stay for brief periods, with frequent admissions and discharges throughout the year.

Most new residents arrive under private pay (62% of admissions), and a typical private pay stay runs around 14 days.

Admissions
345 total

Coverage residents most often arrive under.

Medicare 20%
Private pay 62%
Medicaid 18%
Discharges
308 total

Coverage residents most often leave under.

Medicare 19%
Private pay 64%
Medicaid 18%

Clovernook Health Care LLC Reviews

Natasha Williams
My uncle has been in this facility for almost 3 weeks now I went to visit him for the first time and I was broken hearted and disgusted your staff was standing all around gossiping about other employees which are other patients which is a violation of HIPAA they were rude and when I asked for help they were even more rude his room was disgusting his sheets had piss and crumbs hadn't been changed in 10 days the guy that came in to actually help admitted he was out on vacation and that you guys just hire anyone from agencies and they don't do anything but sit there your staff is rude there was other patients that you guys take advantage of that don't have family and just let them sit there and piss and Drool on themselves and take their money that is disgusting and now they're lying to my aunt and telling her that they can't discharge my uncle and have to return him at 8:00 because a doctor has to clear him I know the laws and I took pictures and videos that day and I'm going to submit them to my attorneys O'Connor and Tony and Levy so if anyone's thinking of sending your family member there don't they'll die and end up worse than they were when they went inWhat do you like most about living here? Answer: I don't live there but my uncle is worse off I am disgusted I can't believe you guys call yourself a caring facility leave patience with no family members people who pay with good insurance and let them lay and piss and don't do their job and you just hire anyone and let them be rude to family and family members and the patients that are there letting them lay in their own urine and crumbs and don't do physical rehabilitation you just take advantage of them Are there enough caregivers to handle the residents' needs, especially during emergencies? Answer: No Are the common areas pleasant and comfortable for socializing or relaxing? Answer: No How would you rate the quality and variety of the meals? (1-5) Answer: 1 Are special diets handled well? Answer: No Is the dining schedule flexible enough to meet your preferences? Answer: No How do you feel about the level of social interaction available with other residents? Answer: What I witnessed is there is no social interaction because they're so busy standing around doing nothing on their phones being rude to everyone not doing their job at all no cleaning no physical therapy it's all lies and disgusting especially with the people who pay with insurance I feel so sorry for the families or patients that don't have good insurance or family I'm going to make sure everybody knows about your facility it's so disgusting you should be ashamed of yourself How was the units offered in this community? Answer: Disgusting and your staff was rude Do you feel safe living in this community? Answer: No How well do you think the community handles emergencies or unexpected events? Answer: You only have one elevator and that whole facility unit three floors and your stats know where to be around to help I feel so scared for my own family member until he gets out of there along with patients that don't have family there is no way they would be able to handle an emergency on expected Are there any hidden fees or unexpected charges? Answer: Yes they charge people with insurance and still treat them like crap and then lie and tell them that they have to have a doctor's clearance when my family member was admitted by choice from my aunt and is being told that he can't leave and he has to be returned by 8:00 and that's a lie and he she's being charged for physical rehabilitation which my uncle says they barely even do an hour 15 to 20 minutes how is he supposed to get better like that they don't clean the rude they don't do nothing but take advantage Would you recommend this community to others looking for senior living options? Answer: Oh definitely not I would definitely not recommend this community for any other seniors unless they want to die by themselves God forgive me for saying that Is there anything you wish you knew before moving in? Answer: Yes I wish my aunt would have listened when I looked up the reviews and told her but when I seen it for myself I wish I would have stood up to the nurse that was rude to me but I was worried that she would take it out on my uncle I wish I would have took him that day

Places of interest near Clovernook Health Care LLC

Address 8.3 miles from city center Info Estimated distance in miles from Cincinnati's city center to Clovernook Health Care LLC's address, calculated via Google Maps.

Calculate Travel Distance to Clovernook Health Care LLC

Add your location

Address

Compare Nursing Homes around Cincinnati

The information below is reported by the Ohio Department of Health, Bureau of Survey and Certification.

5 facilities compared · CMS & OH Dept. of Health data

Mount Washington Care Center
NH
Cincinnati (Fruit Hill)
129
Facility 129
OH AVG 78
Rank #33 / 323
54.3%
Facility 54.3%
OH AVG 78.7%
Rank #197 / 211
-31%
3.25
Facility 3.25
OH AVG 3.54
Rank #150 / 210
+75%-8%
$0
Facility $0
OH AVG $74.0k
Rank #1 / 211
39
Facility 39
OH AVG 30.9
Rank #156 / 210
4.9
Facility 4.9
OH AVG 4.6
Rank #147 / 210
169A+
32
Facility 32
OH AVG 40
Rank #427 / 705
Edith Olanoff 2011 Trust Dated 10/21/2011
$8.9M
Facility $8.9M
OH AVG $10.1M
Rank #94 / 210
$5.8M
Facility $5.8M
OH AVG $3.9M
Rank #61 / 210
65.2%
Facility 65.2%
OH AVG 40.2%
Rank #35 / 210
365423
Cottingham Retirement Community
NH
AL
HC
IL
MC
PC
RC
Cincinnati (Sharonville)
128
Facility 128
OH AVG 78
Rank #36 / 323
45.3%
Facility 45.3%
OH AVG 78.7%
Rank #203 / 211
-42%
2.78
Facility 2.78
OH AVG 3.54
Rank #198 / 210
-48%-21%
$0
Facility $0
OH AVG $74.0k
Rank #1 / 211
22
Facility 22
OH AVG 30.9
Rank #80 / 210
3.7
Facility 3.7
OH AVG 4.6
Rank #82 / 210
258A+
53
Facility 53
OH AVG 40
Rank #223 / 705
-
$7.5M
Facility $7.5M
OH AVG $10.1M
Rank #140 / 210
$3.7M
Facility $3.7M
OH AVG $3.9M
Rank #157 / 210
49.3%
Facility 49.3%
OH AVG 40.2%
Rank #148 / 210
365652
Clovernook Health Care LLC
NH
RC
Cincinnati (College Hill)
126
Facility 126
OH AVG 78
Rank #39 / 323
86.1%
Facility 86.1%
OH AVG 78.7%
Rank #98 / 211
+9%
3.55
Facility 3.55
OH AVG 3.54
Rank #99 / 210
-34%0%
$0
Facility $0
OH AVG $74.0k
Rank #1 / 211
38
Facility 38
OH AVG 30.9
Rank #150 / 210
2.5
Facility 2.5
OH AVG 4.6
Rank #27 / 210
1106A+
18
Facility 18
OH AVG 40
Rank #561 / 705
Clovernook Healthcare Holdings LLC
$12.9M
Facility $12.9M
OH AVG $10.1M
Rank #53 / 210
$5.9M
Facility $5.9M
OH AVG $3.9M
Rank #48 / 210
45.8%
Facility 45.8%
OH AVG 40.2%
Rank #105 / 210
365551
Harmony Court Rehab and Nursing
NH
MC
NC
PC
RC
Cincinnati (Bond Hill)
120
Facility 120
OH AVG 78
Rank #49 / 323
89.2%
Facility 89.2%
OH AVG 78.7%
Rank #75 / 211
+13%
3.23
Facility 3.23
OH AVG 3.54
Rank #150 / 210
+50%-9%
$100.9k
Facility $100.9k
OH AVG $74.0k
Rank #190 / 211
86
Facility 86
OH AVG 30.9
Rank #207 / 210
8.6
Facility 8.6
OH AVG 4.6
Rank #204 / 210
1106A+
40
Facility 40
OH AVG 40
Rank #364 / 705
Linda Combs
$11.2M
Facility $11.2M
OH AVG $10.1M
Rank #84 / 210
$5.3M
Facility $5.3M
OH AVG $3.9M
Rank #75 / 210
47.3%
Facility 47.3%
OH AVG 40.2%
Rank #110 / 210
366220
Woods Edge Rehab and Nursing
NH
NC
PC
RC
Cincinnati (Bond Hill)
93
Facility 93
OH AVG 78
Rank #100 / 323
80.6%
Facility 80.6%
OH AVG 78.7%
Rank #130 / 211
+2%
3.26
Facility 3.26
OH AVG 3.54
Rank #131 / 210
-45%-8%
$0
Facility $0
OH AVG $74.0k
Rank #1 / 211
50
Facility 50
OH AVG 30.9
Rank #175 / 210
4.2
Facility 4.2
OH AVG 4.6
Rank #111 / 210
179A+
53
Facility 53
OH AVG 40
Rank #223 / 705
Howe Holdings LLC
$8.3M
Facility $8.3M
OH AVG $10.1M
Rank #136 / 210
$4.4M
Facility $4.4M
OH AVG $3.9M
Rank #146 / 210
53.7%
Facility 53.7%
OH AVG 40.2%
Rank #127 / 210
366209

Financial Assistance for
Nursing Home in Ohio

Clovernook Health Care LLC is located in Cincinnati, Ohio.
Here are the financial assistance programs available to residents in Ohio.

Get Financial aid guidance

PASSPORT Waiver

Ohio Medicaid PASSPORT

Age 60+
General Ohio resident, Medicaid-eligible, nursing home-level care need.
Income Limits (2025) ~$2,829/month 300% FBR, individual
Asset Limits $2,000 (individual), $3,000 (couple).
OH

Administered through regional agencies; waitlists possible.

Benefits
Personal care (5-7 hours/day) Respite (240 hours/year) Adult day care ($65/day) Home modifications ($1,500 avg.)

Ohio Home Care Program (non-Medicaid)

OH HCP

Age 60+
General Ohio resident, at risk of decline.
Income Limits ~$2,000/month individual, varies
Asset Limits $5,000 individual
OH

Limited funding; regional variation.

Benefits
In-home care (3-5 hours/week) Respite (up to 10 days/year) Transportation (~5 trips/month)

Assisted Living Waiver (ALW)

Ohio Assisted Living Waiver

Age 21+ (65+ prioritized)
General OH resident, Medicaid-eligible, NFLOC.
Income Limits (2025) ~$2,829/month (individual); QIT required.
Asset Limits $2,000 (individual), $3,000 (couple).
OH

Covers ~300 facilities; room/board not included (separate cost).

Benefits
Personal care Meals Medication management Transportation (~$3,000-$4,000/month value)

Program of All-Inclusive Care for the Elderly (PACE)

Ohio PACE (e.g., McGregor PACE)

Age 55+
General OH resident (specific counties), NFLOC, safe with PACE support.
Income Limits (2025) ~$2,829/month (Medicaid-eligible); private pay option available.
Asset Limits $2,000 (individual), $3,000 (couple) for Medicaid enrollees.
OH

Available in 9 counties (e.g., Cuyahoga, Franklin); expanding via Healthy Aging Grants.

Benefits
Personal care (5-7 hours/day) Medical care Meals Transportation Respite Therapies

Medicare Savings Program (MSP)

Ohio Medicare Savings Program

Age 65+ or disabled
General OH resident, Medicare Part A/B.
Income Limits (2025) ~$2,510/month (QMB), ~$3,380/month (SLMB), ~$3,598/month (QI)—individual.
Asset Limits $9,430 (individual), $14,130 (couple).
OH

Three tiers; includes Extra Help for Part D; no waitlist.

Benefits
Covers Part B premiums ($174.70/month) Deductibles ($240/year) Copays (~20%)

Home Energy Assistance Program (HEAP)

Ohio HEAP

Age 60+ prioritized
General OH resident, low-income household.
Income Limits (2025) ~$3,970/month individual, 185% FPL
Asset Limits Not assessed; income-focused.
OH

Covers gas, electric, oil; emergency aid via Winter/Summer Crisis Programs.

Benefits
Heating/cooling aid ($300-$1,000/season) Emergency aid ($500 max)

Family Caregiver Support Program (FCSP)

Ohio Family Caregiver Support Program

Age
General Caregivers of 60+ needing care or 55+ caregivers of others; OH resident; functional needs (2+ ADLs).
Income Limits (2025) Prioritizes ~$24,980/year (individual); no strict cap.
Asset Limits Not assessed; need-based.
OH

12 AAAs; rural/low-income priority; volunteer respite option.

Benefits
Respite (4-6 hours/week or 5 days/year) Adult day care ($60/day) Training Supplies (~$500/year)

VA Aid and Attendance (A&A) and Housebound Benefits

Ohio VA Aid and Attendance/Housebound

Age 65+ or disabled veteran/spouse
General OH resident, wartime service, need for ADL help (A&A) or homebound.
Income Limits (2025) Net income < ~$1,984/month (veteran with dependent, A&A); pension offsets income.
Asset Limits ~$155,356 net worth limit
OH

High veteran demand; supports care in multiple settings.

Benefits
Cash (~$1,433-$2,642/month veteran, ~$951-$1,318 spouse) for care costs (e.g., in-home, assisted living)

Homestead Exemption

Ohio Homestead Exemption

Age 65+ (or disabled)
General OH resident, homeowner, low-income.
Income Limits (2025) ~$38,500/year individual, adjusted annually
Asset Limits Not assessed; home ownership required.
OH

Reduces taxable value by $25,000; applies to primary residence.

Benefits
Tax reduction (~$400-$800/year avg., varies by county)

Save the Dream Ohio (Homeowner Assistance Fund)

Ohio Save the Dream

Age 60+ prioritized
General OH resident, homeowner, hardship post-Jan 21, 2020.
Income Limits (2025) ~$147,600/year family of 4, 150% AMI; varies by county
Asset Limits Not assessed; hardship-focused.
OH

Covers delinquent mortgages, utilities, taxes; max $25,000 mortgage aid.

Benefits
Mortgage aid ($25,000 max) Utility/property tax aid ($5,000 avg.)

Frequently Asked Questions about Clovernook Health Care LLC

What neighborhood is Clovernook Health Care LLC in?

Clovernook Health Care LLC is in the College Hill neighborhood of Cincinnati.

Is Clovernook Health Care LLC in a walkable area?

Clovernook Health Care LLC has a walk score of 18. Car-dependent. Most errands require a car, with limited nearby walkable options.

What is the occupancy rate at Clovernook Health Care LLC?

Clovernook Health Care LLC's occupancy is 86.1%.

Does Clovernook Health Care LLC operate as a for-profit or non-profit?

Clovernook Health Care LLC is registered as a for-profit in OH.

Are there photos of Clovernook Health Care LLC?

Yes — there are 18 photos of Clovernook Health Care LLC in the photo gallery on this page.

What is the address of Clovernook Health Care LLC?

Clovernook Health Care LLC is located at 7025 Clovernook Ave, Cincinnati, OH 45231.

What is the phone number of Clovernook Health Care LLC?

(513) 605-4000 will put you in contact with the team at Clovernook Health Care LLC.

Guides for Better Senior Living

Care Cost Calculator: See Prices in Your Area

Nursing Home Data Explorer

Don’t Wait Too Long: 7 Red Flag Signs Your Parent Needs Assisted Living Now

The True Cost of Assisted Living in 2025 – And How Families Are Paying For It

Understanding Senior Living Costs: Pricing Models, Discounts & Financial Assistance