Explore Open Rooms

1 Contact details
2 What type of senior care service are you looking for?
3 What budget do you have in mind for senior care?
4 How soon do you need to find care?
5 Additional details

Thank you for your interest!

Our team will be in touch shortly to help with next steps.

Nursing Home

Complete Care at Springbrook

Nursing Home

Complete Care at Springbrook

12325 New Hampshire Ave, Silver Spring, MD 20904 View map
Overview of Complete Care at Springbrook

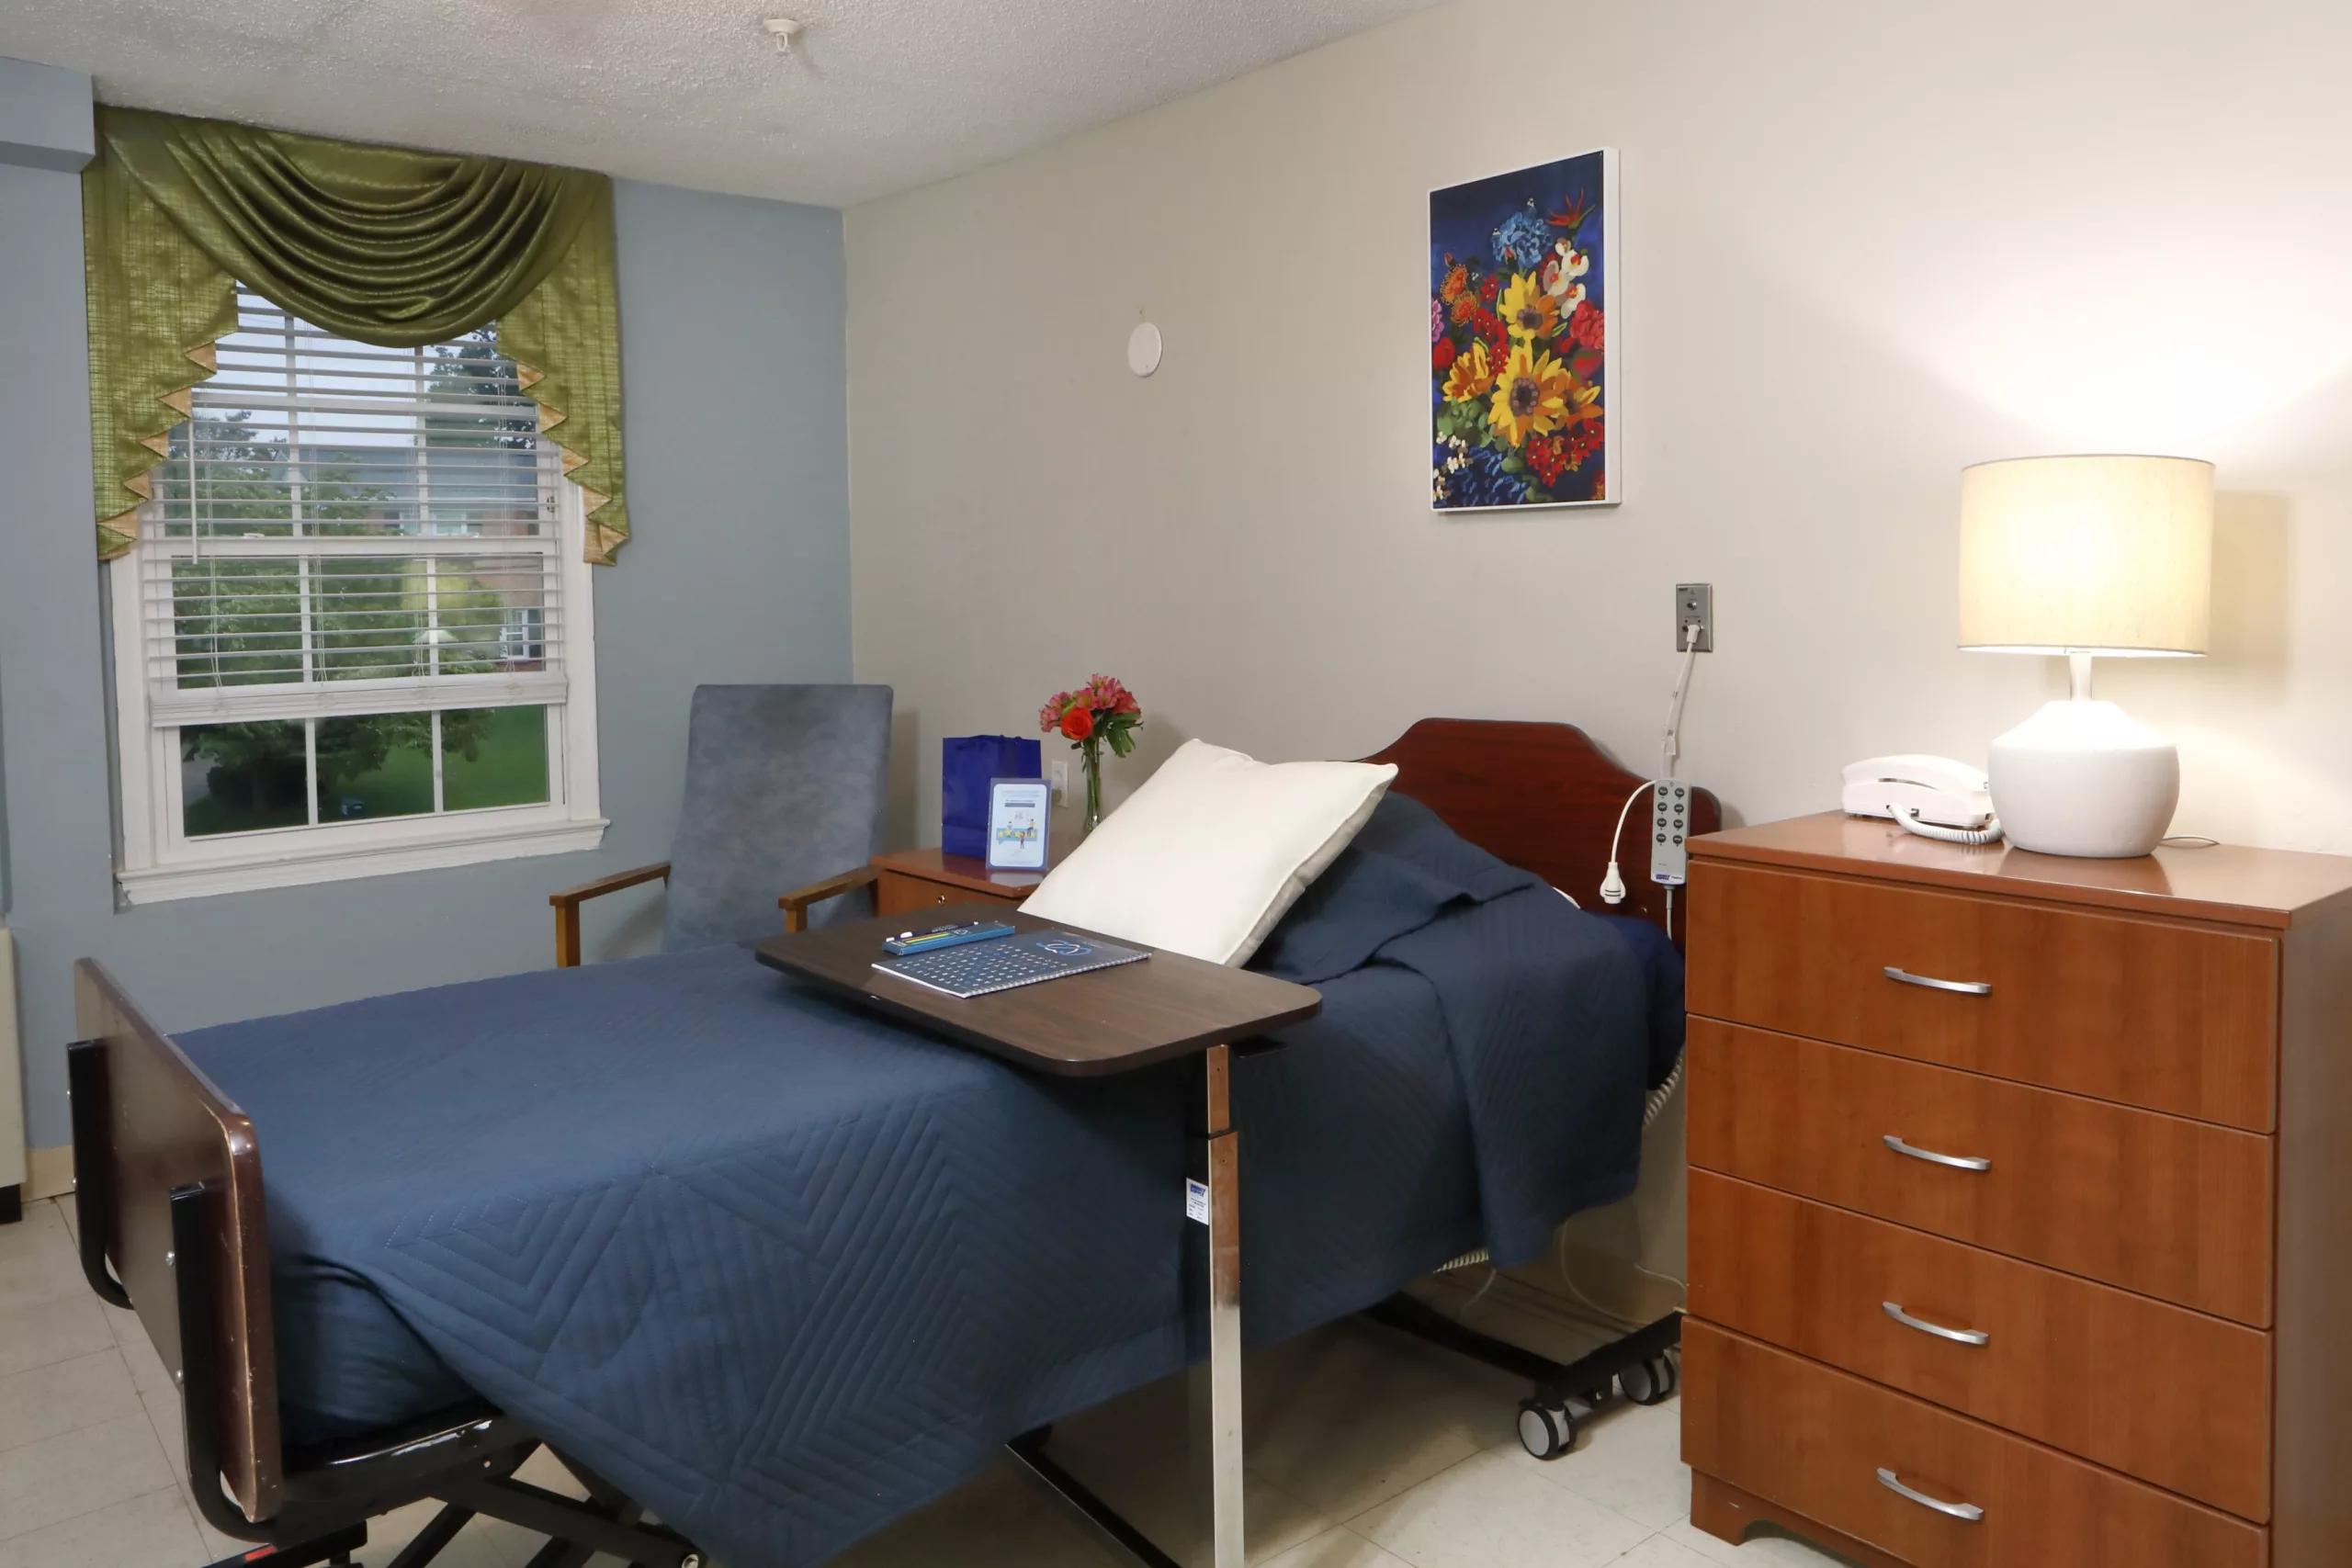
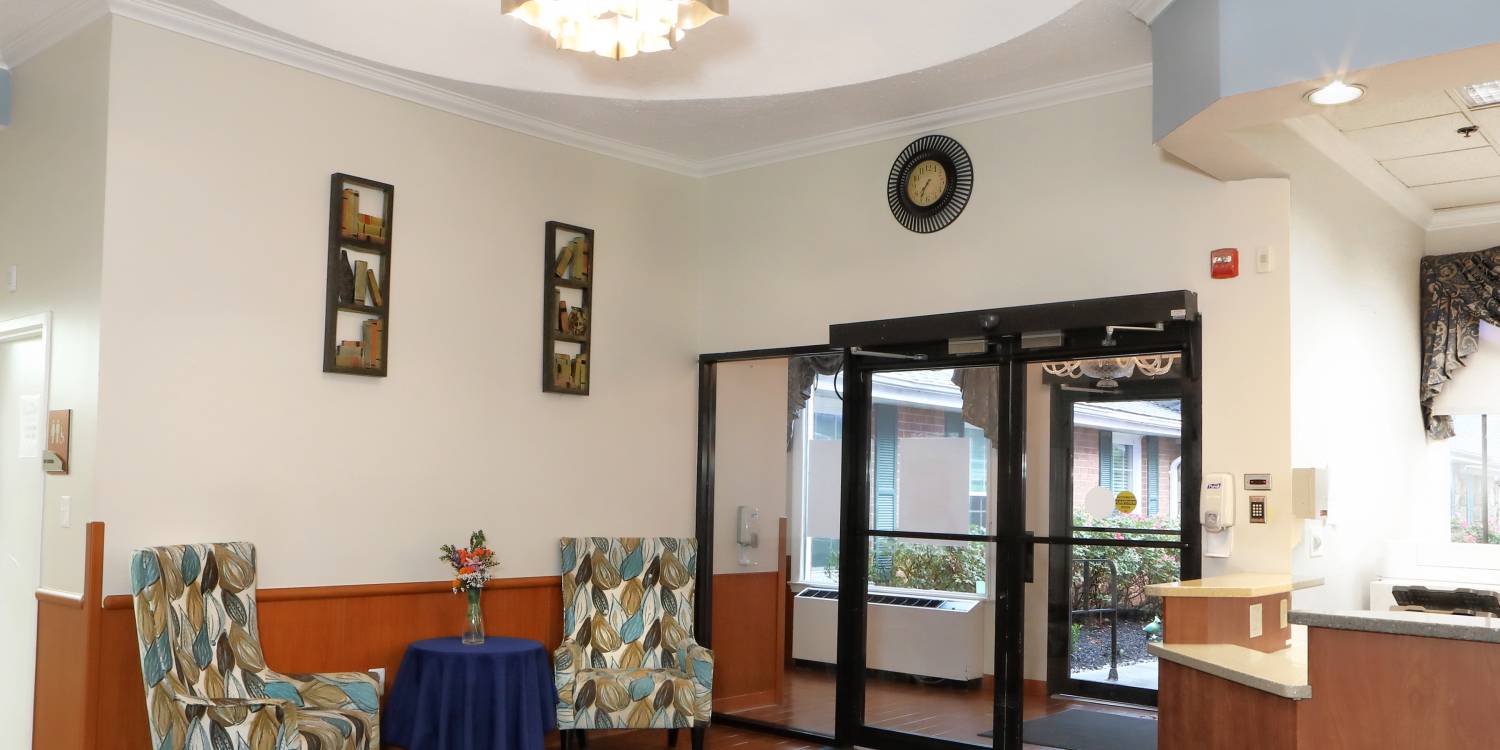
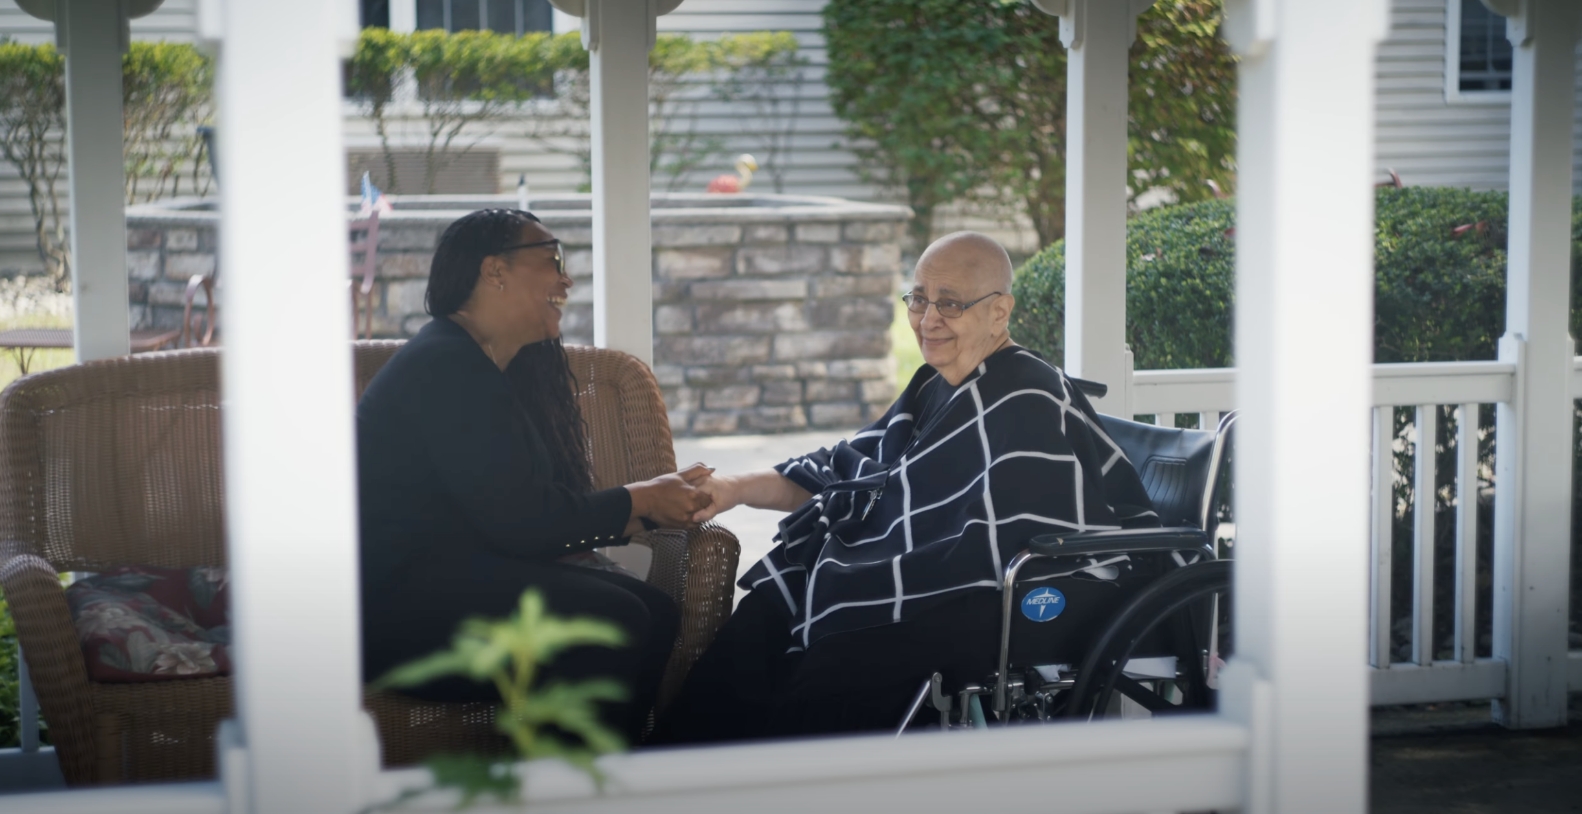
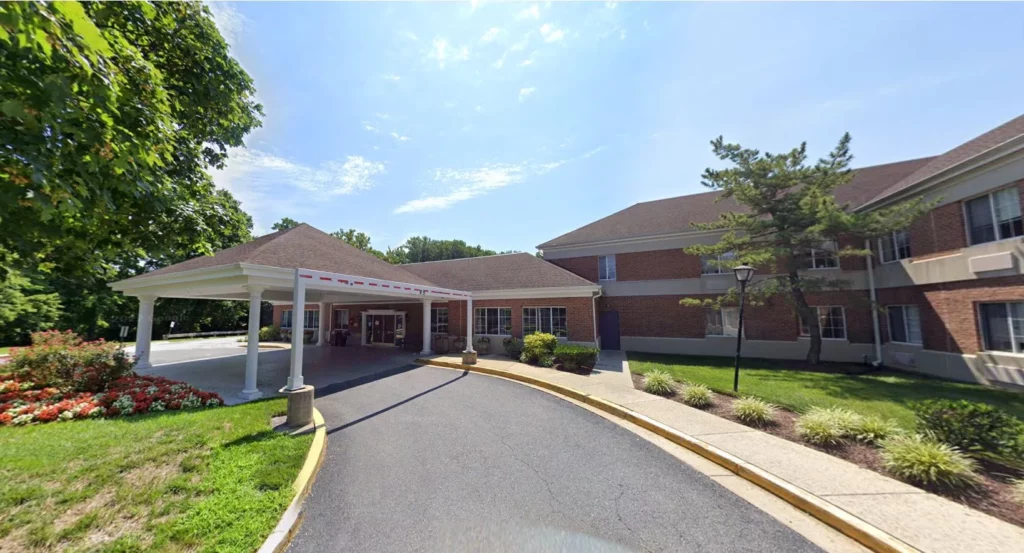
As its name suggests, Complete Care provides a complete list of comprehensive care that enhances the quality of life for its seniors. The nursing home practices the golden standard of exemplary living– a high-end level of medical attention. It’s been one of the most trusted skilled nursing communities in the city because it has the most comfortable and secure environment and lifestyle for the residents. Complete Care at Springbrook strives to improve the lives of its residents by touching their lives and leading them to an extraordinary experience of senior care. 

Complete Care specializes in orthopedic rehabilitation, sub-acute rehabilitation, in-house dialysis, long-term care, and in-house dialysis. 

(301) 622-4600

Managed by Oludapo Raphael Eludoyin, LNHA

Administrator

Oludapo Raphael Eludoyin, LNHA, serves as the Administrator at Complete Care at Springbrook. He leads the community with a focus on establishing strong relationships with residents and maintaining a dedicated, long-tenured staff committed to excellence in care.

Quality ratings

Measured by Centers for Medicare & Medicaid Services (CMS)

Overall rating Info The Overall CMS Rating combines results from health inspections, staffing levels and quality measures. Health inspections carry the most weight. Staffing and quality scores can increase or decrease the final rating based on performance compared to state and national standards.
5/5
Maryland average: 3.4/5
Health Inspection Info Based on the results of the facility's three most recent standard inspections and any complaint investigations. CMS reviews the number, scope, and severity of deficiencies, with more recent findings weighted more heavily.
4/5
Maryland average: 3.2/5
Staffing Info Measures average nursing staff hours per resident per day, including Registered Nurses (RNs) and total nursing staff. Ratings are adjusted based on the level of care residents require and are compared to state and national benchmarks.
2/5
Maryland average: 3.5/5
Quality Measures Info Based on clinical and physical health indicators reported to CMS, such as hospital readmissions, falls, pressure ulcers, and improvements in mobility. These measures reflect how well residents' health needs are being managed.
5/5
Maryland average: 3.7/5

Nursing care per resident

Info This shows how many total hours of nursing staff time are available per resident each day. Higher numbers usually mean more staff support.
2h 46m per day

This home provides 35% less nursing time per resident than the Maryland average.

Maryland average: 4h 17m per day

Staffing hours breakdown

Info Hours of care per resident per day, broken down by staff type. Data from CMS Medicare.
Staff type Facility State avg National avg
Registered Nurse (RN) Info Registered nurse hours per resident per day. 36m per day 50m per day 41m per day
Nurse Aide Info Nurse aide hours per resident per day. 1h 48m per day 2h 10m per day 2h 21m per day
Total Nursing (Weekend) Info Total number of nurse staff hours per resident per day on weekends. 2h 57m per day 3h 29m per day 3h 26m per day
Physical Therapist Info Physical therapist staff hours per resident per day. 4m per day 5m per day 4m per day
RN (Weekend) Info Registered nurse hours per resident per day on weekends. 20m per day 37m per day 29m per day

Capacity and availability

Smaller home

May offer a more intimate, personalized care environment.

Total beds 93

This home usually has availability

Lower occupancy suggests more openings may be available.

Lower demand than the Maryland average
Occupancy rate 83.9%
Residents per day (avg) 80
Occupancy rate
83.9%
Residents per day (avg)
80

Who this home usually serves

TYPE OF STAY

Mostly short-term rehab stays

Most residents typically stay for a few weeks or months before returning home or moving on.

Might be optimal for
Short stays Recovery Medicare-covered care

Breakdown by payment type

Medicare

51% of new residents, usually for short-term rehab.

Typical stay 1 - 2 months

Private pay

32% of new residents, often for short stays.

Typical stay 1 months

Medicaid

18% of new residents, often for long-term daily care.

Typical stay 1 years

Finances and operations

Privately-owned community
Operated by a business corporation.
Home revenue
$11.6M
Operating loss
-$1.7M
Privately-owned community Operated by a business corporation.
Home revenue
$11,622,305.00
Operating loss
$-1,718,769.00
Payroll costs Info The portion of the home's budget spent on staff, including nurses, caregivers, and other employees who support care and operations.
$4.3M
36.6% of revenue
Other operating costs Info All remaining costs needed to run the home, such as food, utilities, building maintenance, supplies and administrative expenses.
$9.1M
Total costs $13.3M
Years in operation
3 years in operation
An established community with some operational experience and growing routines.
Walk Score
Walk Score: 36 / 100
Somewhat walkable. A few nearby services may be reachable on foot, but most trips require transportation.
BBB Rating
BBB Rating: A+ (Not Accredited)
An independent rating from the Better Business Bureau based on factors such as complaint history, transparency, and business practices.
How BBB ratings work

About this community

Additional licensing details

CMS Certification Number: 215052
Awards: CMS Five Star Overall, CMS Five Star Quality, Great Place to Work 2025-2026, Striving for Ten, High 5

Safety & Compliance

Hoyer Lift

Care Services

Nursing Services
Rehabilitation Services
Respite Care
Skilled Nursing
Licensed Nurses/CNAs
24-Hour Staffing
Short-Term Rehab

All Levels of Care

Post-Acute Care
Skilled Nursing
Long-Term Care

Programs & Activities

Specific Programs
Post-Acute Care, Skilled Nursing, Long-Term Care, Rehabilitation Program, Primary Care, Orthopedic & Post-Surgical Care, Cardiac Care, Neuro & Stroke Care, Pulmonary Care, Wound Care, Renal Care, Palliative Care, Bariatric Care, Psychology/Psychiatric Care, Respite Care

Types of Care at Complete Care at Springbrook

Skilled Nursing
Contact Complete Care at Springbrook

Inspection History

In Maryland, the Department of Health, Office of Health Care Quality is the state agency that conducts unannounced inspections and issues reports for all assisted living and nursing facilities.

6 visits/inspections

3 visits/inspections triggered by complaints

1 routine inspections

Results

6 with issues

0 without issues

Maryland average: 5 visits/inspections

Maryland average: 2 inspections

Latest inspection

Date:December 19, 2025
Type:Complaint Investigation

39 deficiencies

Deficiencies indicate regulatory issues. A higher number implies the facility had several areas requiring improvement.

Health Inspection History

Inspections
Total health inspections 5

Maryland average 3.9


Last Health inspection on Mar 2025

Total health citations 33

Maryland average 49.9

Citations per inspection
6.6

Maryland average 12.81


Health citations are formal notices following inspections when they fail to comply with safety and care standards.

25 of 33 citations resulted from standard inspections; and 8 of 33 resulted from complaint investigations.

Breakdown of citation severity (last 3 years)
Critical Health citations More info 1
100% worse than Maryland average

Maryland average: 0.5


Serious Health citations More info 0
100% better than Maryland average

Maryland average: 0.6

1 critical citation More info Maryland average: 0.5

0 serious citations More info Maryland average: 0.6

30 moderate citations More info Maryland average: 47.2

2 minor citations More info Maryland average: 1.7
Citations history (last 3 years)
Nutrition moderate citation Info Issues related to food quality, meal service, and resident's nutritional needs. Mar 14, 2025
Corrected

Pharmacy moderate citation Info Issues related to medication management, including how drugs are stored, administered, and monitored. Mar 14, 2025
Corrected

Care Planning moderate citation Info Issues related to creating and updating personalized care plans for residents based on their needs and conditions. Mar 14, 2025
Corrected

Abuse/Neglect moderate citation Info Issues related to protecting resident's from harm, including abuse, neglect, or mistreatment. Dec 18, 2024
Corrected

Compare Nursing Homes around Silver Spring The information below is reported by the Maryland Department of Health, Office of Health Care Quality.

5 facilities compared · CMS & MD Dept. of Health data · Updated Apr 2026

Complete Care at Springbrook
AL

Assisted Living A licensed, long-term care setting for seniors or individuals with disabilities who need help with daily activities — like bathing, dressing, and medication management — but not 24-hour skilled nursing. Offers housing, meals, and around-the-clock support while aiming to maximize resident independence.

NH

Nursing Home Licensed facility providing 24/7 skilled nursing care for residents with complex, ongoing medical needs. Staffed by RNs, LPNs, and CNAs. Inspected and star-rated annually by CMS. Accepts Medicare (short-term rehab) and Medicaid (long-term care).

Silver Spring
93
87.6%
+6%
2.77
-56%
-27%
0
33
1
80
A+
36
-
$11,5M
$4,3M
37%
215052
Althea Woodland Nursing Home
AL

Assisted Living A licensed, long-term care setting for seniors or individuals with disabilities who need help with daily activities — like bathing, dressing, and medication management — but not 24-hour skilled nursing. Offers housing, meals, and around-the-clock support while aiming to maximize resident independence.

NH

Nursing Home Licensed facility providing 24/7 skilled nursing care for residents with complex, ongoing medical needs. Staffed by RNs, LPNs, and CNAs. Inspected and star-rated annually by CMS. Accepts Medicare (short-term rehab) and Medicaid (long-term care).

Silver Spring
50
91.7%
+11%
3.79
-29%
0%
0
29
0
43
-
12
Meyer, Toni
$7,6M
$2,3M
29.7%
215228
Autumn Lake Healthcare at Silver Spring
HC

Home Care Professional care delivered in the person's own home — from companionship and errands to skilled nursing and therapy. Allows seniors to age in place. Medicare covers skilled home health when medically necessary.

MC

Memory Care Secured, specialized care for people living with Alzheimer's or dementia. Staff trained in cognitive impairment, with higher staff-to-resident ratios and an environment designed to reduce confusion and wandering risk.

NH

Nursing Home Licensed facility providing 24/7 skilled nursing care for residents with complex, ongoing medical needs. Staffed by RNs, LPNs, and CNAs. Inspected and star-rated annually by CMS. Accepts Medicare (short-term rehab) and Medicaid (long-term care).

Silver Spring
148
93.4%
+13%
3.51
0%
-7%
0
35
0
135
-
16
2501 Musgrove Road Holdco Llc
$11,7M
$0,8M
6.8%
215224
Autumn Lake Healthcare at Arcola
AL

Assisted Living A licensed, long-term care setting for seniors or individuals with disabilities who need help with daily activities — like bathing, dressing, and medication management — but not 24-hour skilled nursing. Offers housing, meals, and around-the-clock support while aiming to maximize resident independence.

NH

Nursing Home Licensed facility providing 24/7 skilled nursing care for residents with complex, ongoing medical needs. Staffed by RNs, LPNs, and CNAs. Inspected and star-rated annually by CMS. Accepts Medicare (short-term rehab) and Medicaid (long-term care).

Silver Spring
151
87.9%
+7%
3.57
-15%
-5%
0
53
3
140
-
44
901 Arcola Avenue Opco Llc
$19,6M
$1,3M
6.8%
215014
Autumn Lake Healthcare at Oakview
AL

Assisted Living A licensed, long-term care setting for seniors or individuals with disabilities who need help with daily activities — like bathing, dressing, and medication management — but not 24-hour skilled nursing. Offers housing, meals, and around-the-clock support while aiming to maximize resident independence.

NH

Nursing Home Licensed facility providing 24/7 skilled nursing care for residents with complex, ongoing medical needs. Staffed by RNs, LPNs, and CNAs. Inspected and star-rated annually by CMS. Accepts Medicare (short-term rehab) and Medicaid (long-term care).

Silver Spring (Wheaton)
138
84.2%
+2%
3.74
-53%
-1%
0
60
0
123
-
29
Oakview Holdco Llc
$17,2M
$1,9M
11.3%
215338

Places of interest near Complete Care at Springbrook

Address 5.9 miles from city center — 6.22 miles to nearest hospital (UM Laurel Medical Center)

Address 12325 New Hampshire Ave, Silver Spring, MD 20904

Calculate Travel Distance to Complete Care at Springbrook

Add your location

Address

Staffing Data (Q2 2025)

This data corresponds to Q2 2025 and is based on CMS Payroll-Based Journal.

Total staff 104
Employees 88
Contractors 16
Staff to resident ratio 1.25:1
31% worse than Maryland average

Maryland average ratio: 1.81:1

Avg staff/day 43
Average shift 7.3 hours
9% worse than Maryland average

Maryland average: 8 hours

Total staff hours (quarter) 28,744
Nursing staff breakdown
Registered Nurse

Manages medical care and health needs.

Total count 6
Average shift length Info Average shift length. Calculated as total hours divided by days worked and average staff per day. 8.7 hours

No contractors work on this role.

Licensed Practical Nurse

Assists with medical care and medications.

Total count 23
Average shift length Info Average shift length. Calculated as total hours divided by days worked and average staff per day. 7.2 hours

No contractors work on this role.

Certified Nursing Assistant

Helps with daily care and mobility.

Total count 40
Average shift length Info Average shift length. Calculated as total hours divided by days worked and average staff per day. 7 hours

No contractors work on this role.

Contractor staffing

Total hours from contractors

11.4%

3,268 contractor hours this quarter

Physical Therapy Assistant: 6 Speech Language Pathologist: 4 Clinical Nurse Specialist: 2 Respiratory Therapy Technician: 2 Physical Therapy Aide: 1 Qualified Social Worker: 1
Staff by category
Certified Nursing Assistant4004013,09591100%7
Licensed Practical Nurse230235,22691100%7.2
Clinical Nurse Specialist102122,6878998%9.2
Registered Nurse6061,4288391%8.7
RN Director of Nursing3031,1708391%8.4
Speech Language Pathologist0447797279%7.6
Respiratory Therapy Technician0225887279%5.4
Physical Therapy Aide0115276571%8.1
Nurse Practitioner1015126470%8
Other Dietary Services Staff2025046875%7.4
Administrator1014966268%8
Mental Health Service Worker1014966268%8
Dietitian1014886167%8
Physical Therapy Assistant0664305358%7.3
Qualified Social Worker0113195156%6.3
40 Certified Nursing Assistant
% of Days 100%
23 Licensed Practical Nurse
% of Days 100%
12 Clinical Nurse Specialist
% of Days 98%
6 Registered Nurse
% of Days 91%
3 RN Director of Nursing
% of Days 91%
4 Speech Language Pathologist
% of Days 79%
2 Respiratory Therapy Technician
% of Days 79%
1 Physical Therapy Aide
% of Days 71%
1 Nurse Practitioner
% of Days 70%
2 Other Dietary Services Staff
% of Days 75%
1 Administrator
% of Days 68%
1 Mental Health Service Worker
% of Days 68%
1 Dietitian
% of Days 67%
6 Physical Therapy Assistant
% of Days 58%
1 Qualified Social Worker
% of Days 56%

Facility Characteristics

Source: CMS Long-Term Care Facility Characteristics (Data as of Jan 2026)

Total census
83 residents
Residents by payment source
Medicare
15 residents (18.1%)
Medicaid
53 residents (63.9%)
Private pay or other
15 residents (18.1%)
Programs & Services
Residents' Group

Residents meet regularly to discuss policies, care quality, and activities

Active Resident Council

Organized group of residents that meets regularly to discuss facility policies, quality of life, and activities.

Quality of care over time

These measures show how residents usually do over time at this home, based on health outcomes and preventive care.

High-risk clinical events score Info A composite score based on pressure ulcers, falls with injury, weight loss, walking ability decline, and activities of daily living decline. 8.4
35% better than Maryland average

Maryland average: 12.9

Functional decline score Info A composite score based on activities of daily living decline, walking ability decline, and incontinence. 19.8
23% better than Maryland average

Maryland average: 25.7

Long-stay resident measures
Significantly above average Maryland avg: 3.8 Info CMS star rating based on long-stay quality measure performance. 5 stars = significantly above average, 1 star = significantly below average.
Need for Help with Daily Activities Increased Info Percent of long-stay residents whose need for help with daily activities has increased 18.9%
20% better than Maryland average

Maryland average: 23.7%

Walking Ability Worsened Info Percent of long-stay residents whose ability to move independently worsened 14.9%
46% better than Maryland average

Maryland average: 27.7%

Low Risk Residents with Bowel/Bladder Incontinence Info Percent of low risk long-stay residents who lose control of their bowels or bladder 25.5%
In line with Maryland average

Maryland average: 25.9%

Falls with Major Injury Info Percent of long-stay residents experiencing one or more falls with major injury 1.5%
35% better than Maryland average

Maryland average: 2.3%

High Risk Residents with Pressure Ulcers Info Percent of long-stay high risk residents with pressure ulcers 3.2%
51% better than Maryland average

Maryland average: 6.5%

Urinary Tract Infection Info Percent of long-stay residents with a urinary tract infection 0.4%
77% better than Maryland average

Maryland average: 1.6%

Lost Too Much Weight Info Percent of long-stay residents who lose too much weight 3.5%
40% better than Maryland average

Maryland average: 5.8%

Depressive Symptoms Info Percent of long-stay residents who have depressive symptoms 70.2%
247% worse than Maryland average

Maryland average: 20.2%

Antipsychotic Use Info Percent of long-stay residents who received an antipsychotic medication 3.0%
77% better than Maryland average

Maryland average: 12.9%

Pneumococcal Vaccine Info Percent of long-stay residents assessed and appropriately given the pneumococcal vaccine 100.0%
9% better than Maryland average

Maryland average: 92.0%

Influenza Vaccine Info Percent of long-stay residents assessed and appropriately given the seasonal influenza vaccine 100.0%
In line with Maryland average

Maryland average: 96.6%

Hospitalizations per 1,000 days Info Number of hospitalizations per 1,000 long-stay resident days. 1.95
48% worse than Maryland average

Maryland average: 1.32

ED visits per 1,000 days Info Number of outpatient emergency department visits per 1,000 long-stay resident days. 0.94
22% better than Maryland average

Maryland average: 1.21

Short-stay resident measures
Above average Maryland avg: 3.7 Info CMS star rating based on short-stay quality measure performance. 5 stars = much above average, 1 star = much below average.
Pneumococcal Vaccine Info Percent of short-stay residents assessed and appropriately given the pneumococcal vaccine 98.0%
25% better than Maryland average

Maryland average: 78.4%

Antipsychotic medication increase Info Percent of short-stay residents who newly received an antipsychotic medication 0.7%
50% better than Maryland average

Maryland average: 1.4%

Influenza Vaccine Info Percent of short-stay residents assessed and appropriately given the seasonal influenza vaccine 100.0%
24% better than Maryland average

Maryland average: 80.6%

Re-hospitalized after SNF stay Info Percentage of short-stay residents who were re-hospitalized after their nursing home admission. 27.9%
32% worse than Maryland average

Maryland average: 21.2%

Emergency department visits Info Percentage of short-stay residents who had an outpatient emergency department visit. 8.3%
16% better than Maryland average

Maryland average: 9.9%

Falls with major injury Info Percentage of SNF residents who experience falls with major injury during their stay. 0.0%
100% better than Maryland average

Maryland average: 0.8%

Ability to care for self at discharge Info Percentage of residents at or above expected ability to care for themselves at discharge. 65.7%
22% better than Maryland average

Maryland average: 53.7%

Successful return to home or community Info Rate of successful return to home or community from a skilled nursing facility. 54.4%
7% better than Maryland average

Maryland average: 50.6%

Guides for Better Senior Living

Care Cost Calculator: See Prices in Your Area

Nursing Home Data Explorer

Don’t Wait Too Long: 7 Red Flag Signs Your Parent Needs Assisted Living Now

The True Cost of Assisted Living in 2025 – And How Families Are Paying For It

Understanding Senior Living Costs: Pricing Models, Discounts & Financial Assistance

Financial Aid for Maryland Seniors

Get financial aid guidance

Community Options Waiver

Maryland Medicaid Community Options Waiver

Age 65+ or disabled, Maryland resident, Medicaid- eligible, nursing home-level care need.

~$2,829/month (300% FBR, individual).

$2,000 (individual), $3,000 (couple) (excludes home, car).

High urban demand; rural outreach efforts.

Senior Care Program

Maryland Senior Care

Age 65+, Maryland resident, at risk of nursing home placement.

~$2,000/month (individual, varies by county).

$11,000 (individual).

Limited funding; waitlists common in high-demand areas.

Maryland Nursing Home Medicaid

Maryland Medical Assistance (Medicaid) Nursing Home Program

Age 65+, Maryland resident, Medicaid-eligible, requires nursing home-level care.

$943/month (individual); most income applied to care costs.

$2,500 (individual), $3,000 (couple); spousal protections up to $155,356.

Home equity limit $636,000; estate recovery applies post-55.

Senior Assisted Living Subsidy Program

Maryland Senior Assisted Living Group Home Subsidy

Age 62+, Maryland resident, in or moving to approved assisted living, low/moderate income.

~$34,000/year (individual, varies by county).

Not strict; prioritizes low-income.

Not available statewide; facility must be licensed by MDH.

Veterans Aid and Attendance (A&A) Benefit

Maryland VA Aid and Attendance

Wartime veteran/spouse, age 65+ or disabled, needs ADL help, Maryland resident.

Net income minus medical expenses < $1,984/month (individual with A&A).

$155,356 (net worth limit).

High veteran population in suburban/rural areas.

Senior Prescription Drug Assistance Program (SPDAP)

Maryland Senior Prescription Drug Assistance Program

Age 65+, Maryland resident (6+ months), Medicare Part D enrolled.

$48,560/year (individual, 300% FPL).

None specified.

Supplements Medicare Part D; annual enrollment required.

Medicare Savings Programs (MSP)

Maryland Medicare Savings Programs

Age 65+, Maryland resident, Medicare Part A/B enrollee.

$2,014/month (QMB), $2,706/month (SLMB/QI, individual).

$9,090 (individual), $13,630 (couple).

Includes QMB, SLMB, QI categories.

Community Personal Assistance Services (CPAS)

Maryland Medicaid Community Personal Assistance Services

Age 65+, Maryland resident, Medicaid-eligible, needs ADL assistance.

$943/month (individual); spend-down available.

$2,500 (individual), $3,000 (couple).

Consumer-directed option allows hiring family caregivers.

Tour Icon
Planning a tour? Check our touring checklist.
Chat Icon
Thinking of living here? We can help you speak to a current resident