


Total staff
357
Employees
335
Contractors
22
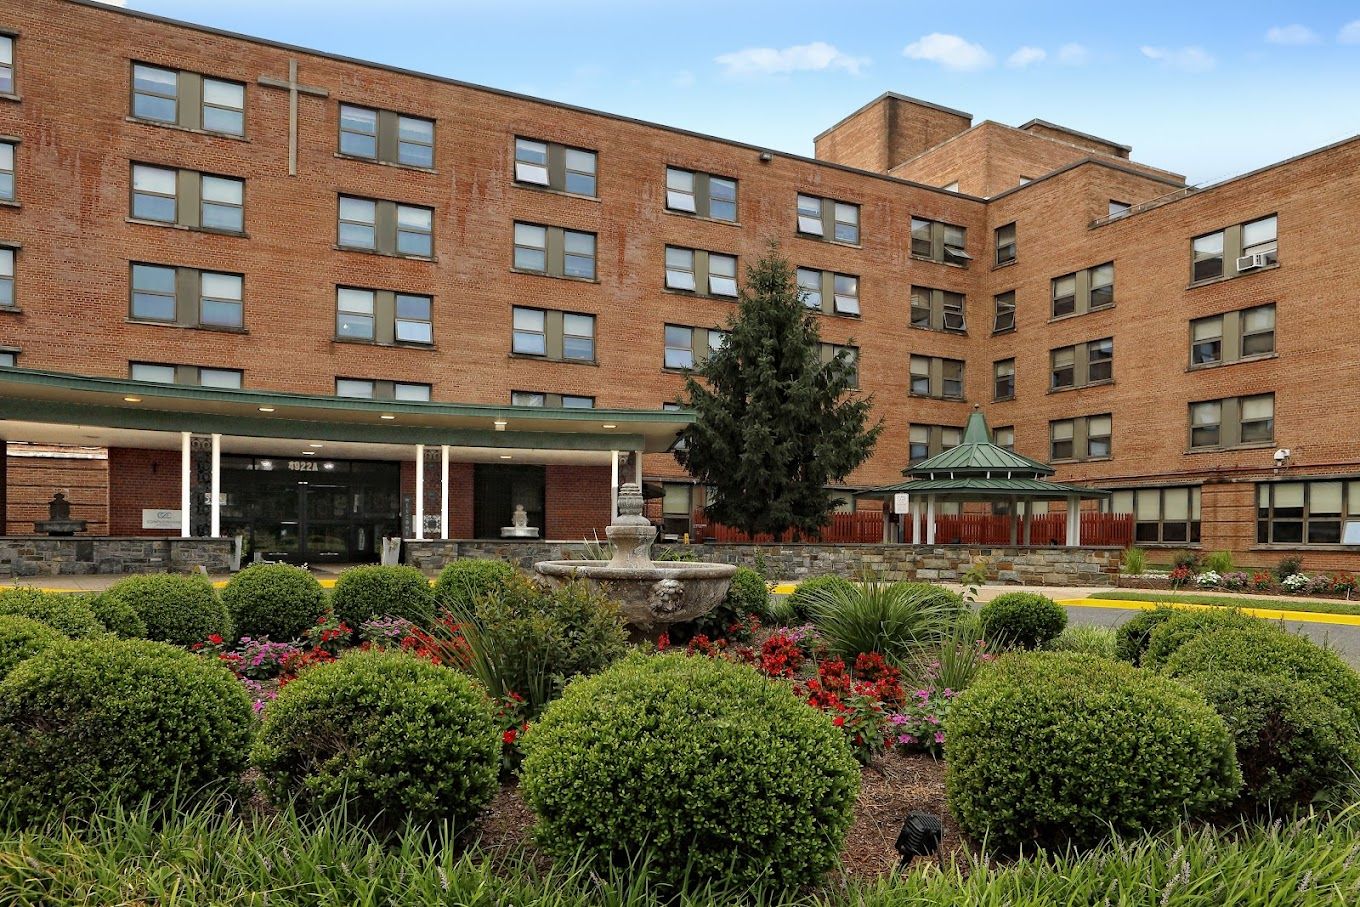
On Lasalle Road in Hyattsville’s Queens Chapel neighborhood, Complete Care in Hyattsville is one of the larger nursing campuses in Prince George’s County: 270 beds, five care types, and an occupancy rate of 92.5%. CMS data puts the current resident count at 280. The average stay is 140 days, a figure consistent with a population that spans short-term rehab and extended nursing care. Getting around the area requires a car for most errands; the Walk Score is 42.
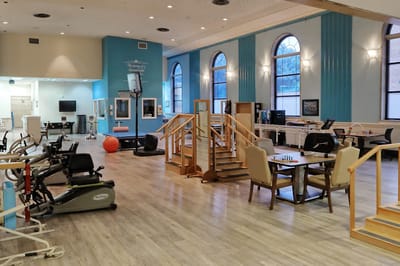
The care type list is broad: nursing home care, hospice, memory care, palliative care, and respite care are all offered on campus, administered by Antionette Doublin. Confirmed services include rehabilitation, short-term rehab, post-acute care, and respite care.
A Hoyer lift is available on-site. An Active Resident Council and a Residents Group, both confirmed through CMS Facility Characteristics, are among the organized programs. The facility accepts Medicare, Medicaid, and private pay.
Staffing figures from CMS put total nursing hours at 3 hours 17 minutes per resident per day, with RN coverage at 48 minutes and nurse aide hours at 2 hours 1 minute.
Complete Care in Hyattsville is a large, high-occupancy nursing campus with a wide care-type footprint. Families who need a facility that can accommodate shifting care needs, including hospice and memory care, within one location, and who require Medicare or Medicaid coverage, will find that this campus is structured for exactly that.
| Staff type | Hours / Day / Resident | vs state avg |
|---|---|---|
|
Registered Nurse (RN)
| 48m per day | ▼ 5% State avg: 50m per day · National avg: 41m per day |
|
LPN / LVN
| 1h 12m per day | ▲ 34% State avg: 54m per day · National avg: 52m per day |
|
Nurse Aide
| 2h 1m per day | ▼ 7% State avg: 2h 10m per day · National avg: 2h 21m per day |
|
Weekend Total Nursing
| 3h 33m per day | ■ Avg State avg: 3h 29m per day · National avg: 3h 26m per day |
|
Physical Therapist
| 4m per day | ▼ 25% State avg: 5m per day · National avg: 4m per day |
|
Weekend RN
| 36m per day | ▼ 3% State avg: 37m per day · National avg: 29m per day |
Reporting period: October 1 – December 31, 2025 (Q4 2025). Source: CMS Payroll-Based Journal report.
Manages medical care and health needs.
Assists with medical care and medications.
Helps with daily care and mobility.
Total hours from contractors
6,711 contractor hours this quarter
| Certified Nursing Assistant | 128 | 0 | 128 | 47,692 | 92 | 100% | 8.1 |
| Licensed Practical Nurse | 75 | 0 | 75 | 25,098 | 92 | 100% | 7.9 |
| Registered Nurse | 34 | 0 | 34 | 11,554 | 92 | 100% | 7.9 |
| Clinical Nurse Specialist | 27 | 0 | 27 | 6,855 | 92 | 100% | 8 |
| Qualified Activities Professional | 20 | 0 | 20 | 6,329 | 92 | 100% | 9.3 |
| RN Director of Nursing | 11 | 0 | 11 | 4,161 | 91 | 99% | 8.3 |
| Physical Therapy Assistant | 0 | 10 | 10 | 1,737 | 86 | 93% | 8.1 |
| Other Dietary Services Staff | 5 | 0 | 5 | 1,572 | 83 | 90% | 7.3 |
| Respiratory Therapy Technician | 0 | 3 | 3 | 1,513 | 70 | 76% | 8.1 |
| Dental Services Staff | 4 | 0 | 4 | 1,412 | 65 | 71% | 8 |
| Physical Therapy Aide | 0 | 3 | 3 | 1,280 | 69 | 75% | 8.1 |
| Speech Language Pathologist | 0 | 3 | 3 | 1,251 | 84 | 91% | 7.4 |
| Medication Aide/Technician | 3 | 0 | 3 | 1,101 | 77 | 84% | 9.6 |
| Nurse Practitioner | 2 | 0 | 2 | 944 | 62 | 67% | 8 |
| Qualified Social Worker | 0 | 3 | 3 | 931 | 72 | 78% | 8 |
| Mental Health Service Worker | 3 | 0 | 3 | 654 | 59 | 64% | 8 |
| Dietitian | 4 | 0 | 4 | 545 | 62 | 67% | 7.8 |
| Administrator | 2 | 0 | 2 | 456 | 57 | 62% | 8 |
| Occupational Therapy Aide | 12 | 0 | 12 | 255 | 5 | 5% | 7.7 |
| Nurse Aide in Training | 4 | 0 | 4 | 178 | 15 | 16% | 8 |
| Other Social Services Staff | 1 | 0 | 1 | 24 | 3 | 3% | 8 |
Federal penalties imposed by CMS for regulatory violations, including civil money penalties (fines) and denials of payment for new Medicare/Medicaid admissions.
Source: CMS Penalties Database (Data as of Jan 2026)
Maryland average: $61K
Maryland average: 1.5
Maryland average: 0.1
No penalties in the past 3 years
No civil money penalties or payment denials were reported in the last 3 years.
These measures show how residents usually do over time at this home, based on health outcomes and preventive care.
Maryland average: 12.9
Maryland average: 25.7
Maryland average: 23.7%
Maryland average: 27.7%
Maryland average: 25.9%
Maryland average: 2.3%
Maryland average: 6.5%
Maryland average: 1.6%
Maryland average: 5.8%
Maryland average: 20.2%
Maryland average: 12.9%
Maryland average: 92.0%
Maryland average: 96.6%
Maryland average: 1.32
Maryland average: 1.21
Maryland average: 78.4%
Maryland average: 1.4%
Maryland average: 80.6%
Maryland average: 21.2%
Maryland average: 9.9%
Maryland average: 0.8%
Maryland average: 53.7%
Maryland average: 50.6%
Quality measures are calculated from Minimum Data Set (MDS) assessments. For most measures, lower percentages indicate better care quality.
40% of new residents, usually for short-term rehab.
28% of new residents, often for short stays.
31% of new residents, often for long-term daily care.
Source: CMS Long-Term Care Facility Characteristics (Data as of Jan 2026)
Residents meet regularly to discuss policies, care quality, and activities
Organized group of residents that meets regularly to discuss facility policies, quality of life, and activities.
Data sourced from CMS Long-Term Care Facility Characteristics quarterly report. Payer mix reflects the current resident census by primary payment source.
Historical financial and operational data for Complete Care in Hyattsville from 2011–2021, based on CMS SNF Cost Reports.
Key figures below are for fiscal year ending in 12/2021 — the home's most recent complete cost report, an older period than most facilities report.
Based on the home's most recent complete CMS SNF Cost Report — fiscal year ending in 12/2021. This is an older period than most facilities report, so compare with that in mind.
Most residents typically stay for a few weeks or months before returning home or moving on.
New residents most often arrive under Medicare (40% of admissions), and a typical Medicare stay runs around 1 - 2 months.
Coverage residents most often arrive under.
Coverage residents most often leave under.
![]() 2.3 miles from city center
2.3 miles from city center
![]() Estimated distance in miles from Hyattsville's city center to Complete Care in Hyattsville's address, calculated via Google Maps.
Estimated distance in miles from Hyattsville's city center to Complete Care in Hyattsville's address, calculated via Google Maps.
Add your location
Info below is compiled from CMS reports & the MD Dept. of Health (OHCQ), senior community websites & trusted data sources such as Walk Score & BBB.
Communities are listed from highest to lowest based on our ranking methodology.
| Crescent Cities Center | NH HOS PC SNF | Riverdale | 158
Facility
158
MD AVG
42
Rank
#34 / 685 |
95.3%
Facility
95.3%
MD AVG
80.3
Rank
#12 / 97 | +19% | 3.23
Facility
3.23
MD AVG
3.77
Rank
#93 / 125 | -20% | -14% | $16.8k
Facility
$16.8k
MD AVG
$65.0k
Rank
#100 / 127 | 48
Facility
48
MD AVG
49.9
Rank
#77 / 127 | 12.0
Facility
12.0
MD AVG
12.8
Rank
#66 / 127 | 1 | 151 | - |
82
Facility
82
MD AVG
43
Rank
#78 / 985 | Crescent Cities Health Holdco LLC | $25.5MFiscal year ending 12/2023
Facility
$25.5MFiscal year ending 12/2023
MD AVG
$18.7M
Rank
#22 / 126 | $11.2MFiscal year ending 12/2023
Facility
$11.2MFiscal year ending 12/2023
MD AVG
$6.5M
Rank
#31 / 126 | 44.1%Fiscal year ending 12/2023
Facility
44.1%Fiscal year ending 12/2023
MD AVG
38.5%
Rank
#109 / 126 | 215323 | ||||
| Complete Care in Hyattsville | NH HOS MC PC RC SNF | Hyattsville (Queens Chapel) | 270
Facility
270
MD AVG
42
Rank
#4 / 685 |
98.0%
Facility
98.0%
MD AVG
80.3
Rank
#2 / 97 | +22% | 3.28
Facility
3.28
MD AVG
3.77
Rank
#82 / 125 | -31% | -13% | $0
Facility
$0
MD AVG
$65.0k
Rank
#1 / 127 | 63
Facility
63
MD AVG
49.9
Rank
#94 / 127 | 31.5
Facility
31.5
MD AVG
12.8
Rank
#126 / 127 | 2 | 265 | - |
42
Facility
42
MD AVG
43
Rank
#504 / 985 | - | $39.8M*Fiscal year ending 12/2021These figures are from this home's most recent complete cost report — an older period than most facilities report. Compare with that in mind.
Facility
$39.8M*Fiscal year ending 12/2021These figures are from this home's most recent complete cost report — an older period than most facilities report. Compare with that in mind.
MD AVG
$18.7M
Rank
#6 / 126 | $19.4M*Fiscal year ending 12/2021These figures are from this home's most recent complete cost report — an older period than most facilities report. Compare with that in mind.
Facility
$19.4M*Fiscal year ending 12/2021These figures are from this home's most recent complete cost report — an older period than most facilities report. Compare with that in mind.
MD AVG
$6.5M
Rank
#7 / 126 | 48.8%*Fiscal year ending 12/2021These figures are from this home's most recent complete cost report — an older period than most facilities report. Compare with that in mind.
Facility
48.8%*Fiscal year ending 12/2021These figures are from this home's most recent complete cost report — an older period than most facilities report. Compare with that in mind.
MD AVG
38.5%
Rank
#106 / 126 | 215145 | ||||
| Hyattsville Nursing and Rehabilitation Center | NH HOS PC SNF | Hyattsville | 160
Facility
160
MD AVG
42
Rank
#27 / 685 |
98.0%
Facility
98.0%
MD AVG
80.3
Rank
#2 / 97 | +22% | 3.12
Facility
3.12
MD AVG
3.77
Rank
#104 / 125 | +4% | -17% | $76.5k
Facility
$76.5k
MD AVG
$65.0k
Rank
#120 / 127 | 79
Facility
79
MD AVG
49.9
Rank
#112 / 127 | 13.2
Facility
13.2
MD AVG
12.8
Rank
#75 / 127 | 3 | 157 | - |
62
Facility
62
MD AVG
43
Rank
#286 / 985 | Tortuga Health Holdco LLC | $22.5MFiscal year ending 12/2023
Facility
$22.5MFiscal year ending 12/2023
MD AVG
$18.7M
Rank
#37 / 126 | $10.1MFiscal year ending 12/2023
Facility
$10.1MFiscal year ending 12/2023
MD AVG
$6.5M
Rank
#41 / 126 | 44.8%Fiscal year ending 12/2023
Facility
44.8%Fiscal year ending 12/2023
MD AVG
38.5%
Rank
#101 / 126 | 215024 |
Complete Care in Hyattsville is located in Hyattsville, Maryland.
Here are the financial assistance programs available to residents in Maryland.
Complete Care in Hyattsville is in the Queens Chapel neighborhood.
Complete Care in Hyattsville has a walk score of 42. Somewhat walkable. A few nearby services may be reachable on foot, but most trips require transportation.
Complete Care in Hyattsville's occupancy is 92.5%.
No, Complete Care in Hyattsville has a no-pet policy.
Complete Care in Hyattsville is registered as a for-profit.
Yes — there are 4 photos of Complete Care in Hyattsville in the photo gallery on this page.
Complete Care in Hyattsville is located at 4922 Lasalle Rd, Hyattsville, MD 20782.
Care Cost Calculator: See Prices in Your Area
Nursing Home Data Explorer
Don’t Wait Too Long: 7 Red Flag Signs Your Parent Needs Assisted Living Now
The True Cost of Assisted Living in 2025 – And How Families Are Paying For It
Understanding Senior Living Costs: Pricing Models, Discounts & Financial Assistance


