

Occupancy rate
92%
Indiana average: 69%

We arrange tours, appointments, and even moving support so you don’t have to
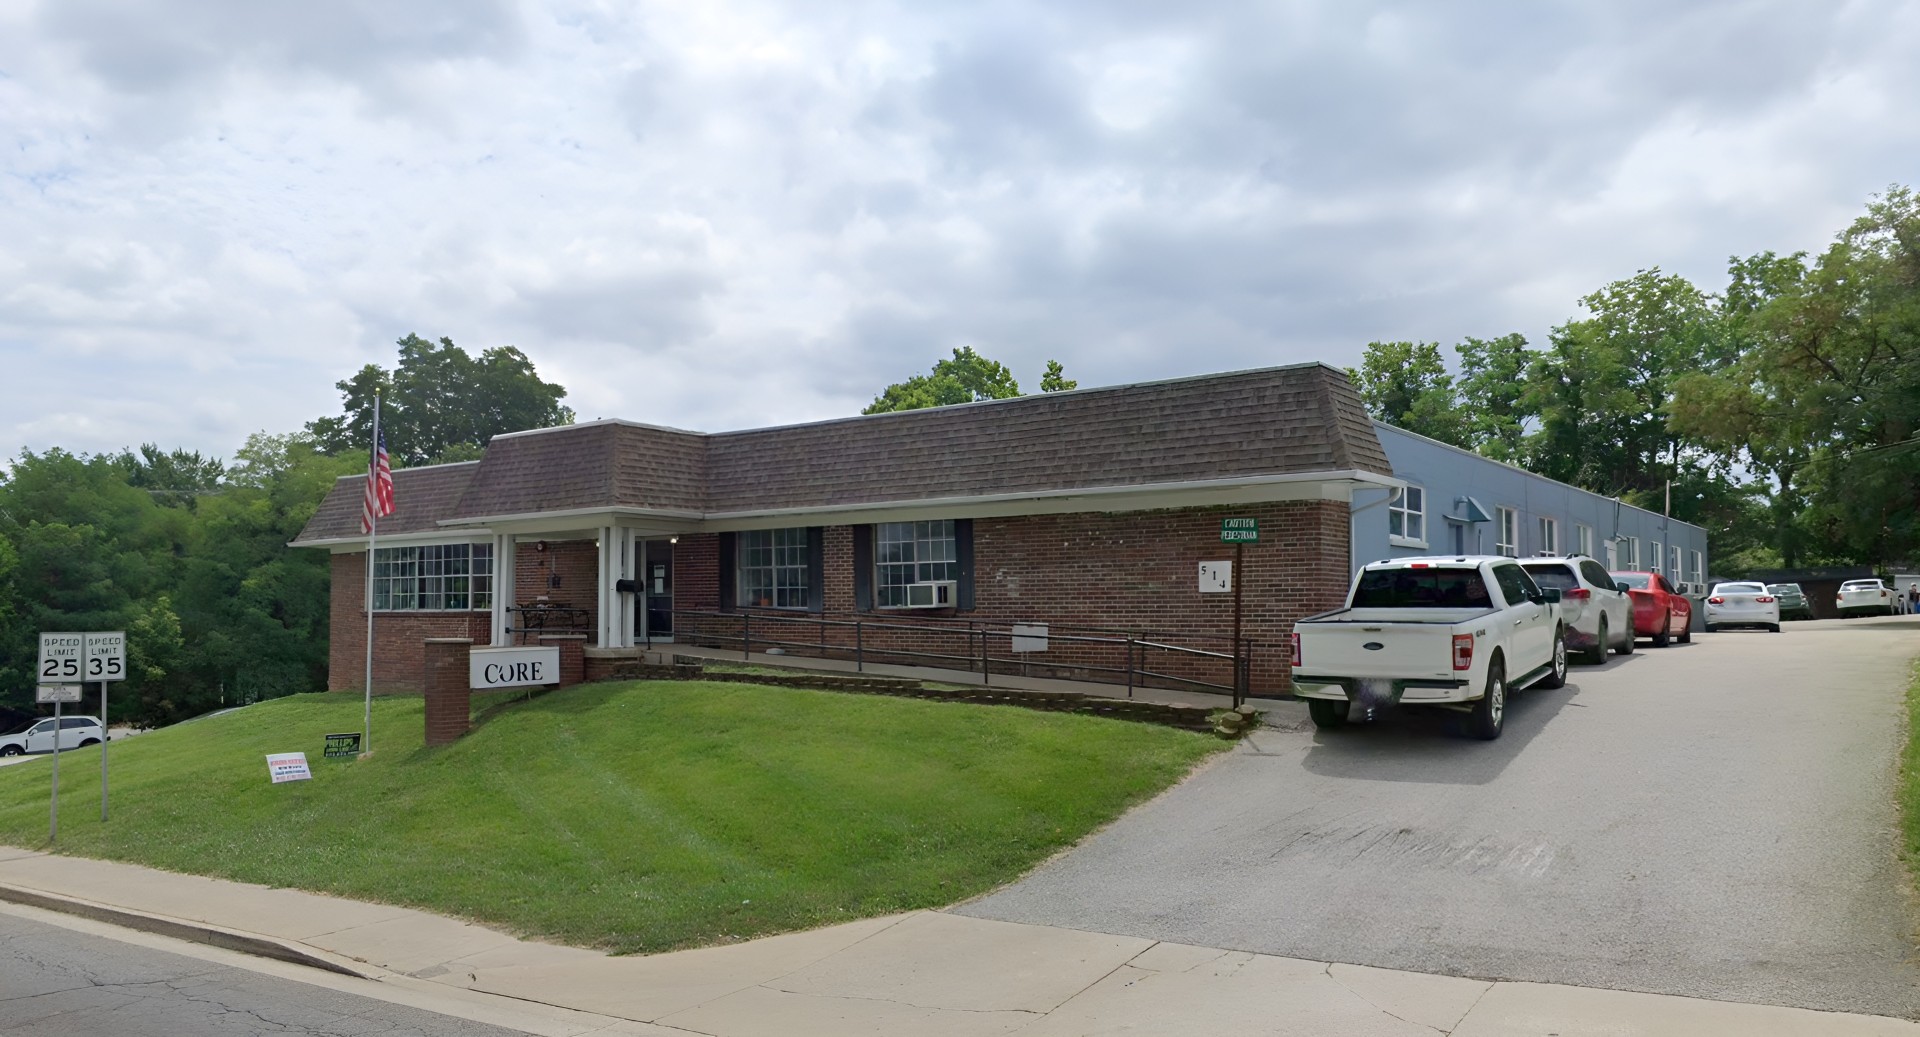
Enjoy a worry-free retirement at Core of Bedford, an esteemed community in Bedford, IN, offering long-term care and memory care. Featuring 37 purposely built and secure accommodations, the community ensures residents are comfortable and safe. A compassionate and well-trained team also provides top-notch care tailored to residents’ unique needs around the clock.
With stimulating programs and enriching activities, residents are encouraged to interact with their surroundings and live actively. Medicare and Medicaid are also accepted to ease financial challenges. The community’s comprehensive care options and well-maintained amenities create the ideal setting for residents to thrive in their golden years.
 Official CMS rating based on health inspections, staffing and quality measures.
Official CMS rating based on deficiencies found during state health inspections.
Official CMS rating based on nurse staffing hours per resident per day.
Official CMS rating based on clinical outcomes for residents.
Average daily nursing hours per resident (adjusted for acuity). Higher values indicate more nursing time per resident.
Hours of care per resident per day, broken down by staff type. Data from CMS Medicare.
Registered nurse hours per resident per day.
Nurse aide hours per resident per day.
Total number of nurse staff hours per resident per day on weekends.
Registered nurse hours per resident per day on weekends.
Official CMS rating based on health inspections, staffing and quality measures.
Official CMS rating based on deficiencies found during state health inspections.
Official CMS rating based on nurse staffing hours per resident per day.
Official CMS rating based on clinical outcomes for residents.
Average daily nursing hours per resident (adjusted for acuity). Higher values indicate more nursing time per resident.
Hours of care per resident per day, broken down by staff type. Data from CMS Medicare.
Registered nurse hours per resident per day.
Nurse aide hours per resident per day.
Total number of nurse staff hours per resident per day on weekends.
Registered nurse hours per resident per day on weekends.
May offer a more intimate, personalized care environment.
Occupancy is moderate, suggesting balanced demand.
Most residents stay for extended periods and receive ongoing daily care.
9% of new residents, usually for short-term rehab.
9% of new residents, often for short stays.
82% of new residents, often for long-term daily care.
The portion of the home's budget spent on staff, including nurses, caregivers, and other employees who support care and operations.
All remaining costs needed to run the home, such as food, utilities, building maintenance, supplies and administrative expenses.
Indiana average: 69%
Core of Bedford is legally operated by MAJOR HOSPITAL, and administrated by SUSAN JORDAN.
Key information about the people who lead and staff this community.
In Indiana, the Department of Health, Division of Long Term Care is the primary regulatory body that performs onsite inspections and quality of care reviews for all licensed facilities.
16 visits/inspections triggered by complaints
5 with citations
6 without citations
Indiana average: 8 complaint visits
Indiana average: 3 inspections with citations
Formal expressions of dissatisfaction or concern made by residents, or their families regarding various aspects of the care, services, and environment provided.
Indiana average: 4 complaints
Citations indicate regulatory violations. A higher number implies the facility had several areas requiring improvement.
Indiana average: 26 citations
Deficiencies indicate regulatory issues. A higher number implies the facility had several areas requiring improvement.
The most recent inspection on June 23, 2025, found no deficiencies related to the complaint investigated. Earlier inspections showed a pattern of deficiencies primarily involving Life Safety Code compliance, emergency preparedness testing, documentation accuracy, and resident care issues such as notification and assessment. Several complaint investigations were substantiated, including failures in medication reconciliation and resident notification, while most complaints were found unsubstantiated or corrected upon revisit. Enforcement actions such as fines or license suspensions were not listed in the available reports. The facility’s recent inspections indicate improvement, with the latest surveys showing compliance following previous citations and corrective actions.
Indiana average 6
Last Health inspection on Oct 2025
Health citations are formal notices following inspections when they fail to comply with safety and care standards.
11 of 15 citations resulted from standard inspections; and 4 of 15 resulted from complaint investigations.
Indiana average: 0.2
Indiana average: 0.6
Data sourced from CMS Health Deficiencies reports. Citation severity codes range from A (least serious) to L (most serious). Immediate Jeopardy (J-L) citations indicate situations where the facility's noncompliance has placed residents at risk of death or serious harm.
Nursing Homes 24/7 care needed
Nursing Homes 24/7 care needed
Nursing Homes 24/7 care needed
Nursing Homes 24/7 care needed
Nursing Homes 24/7 care needed
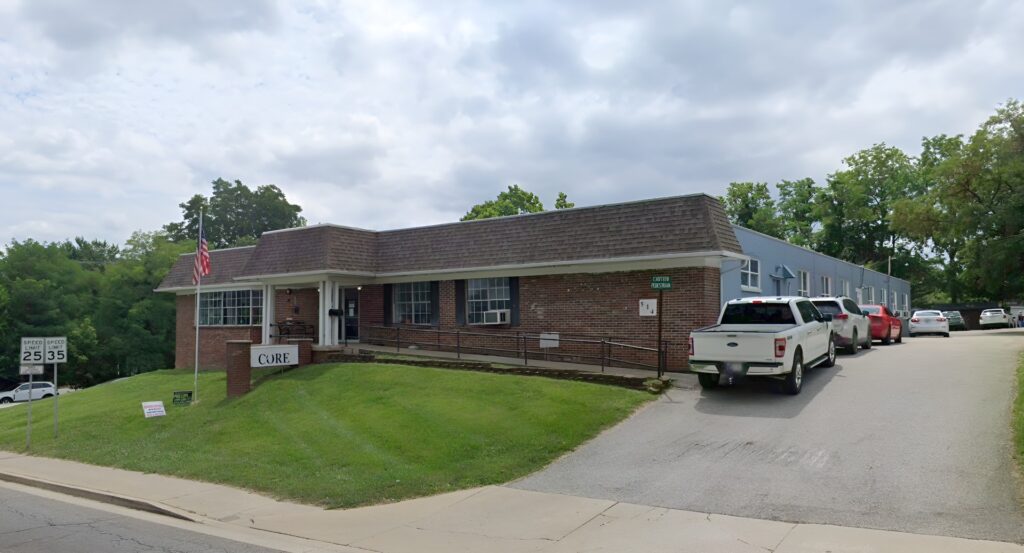 Core of Bedford
 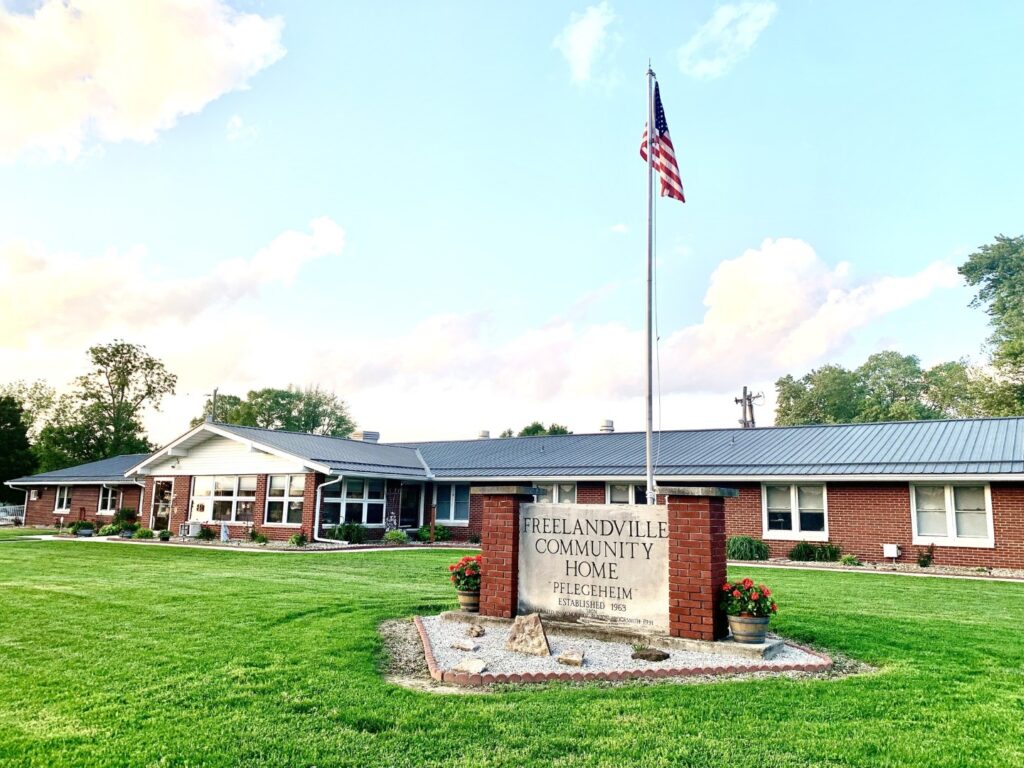 Freelandville Community Home
 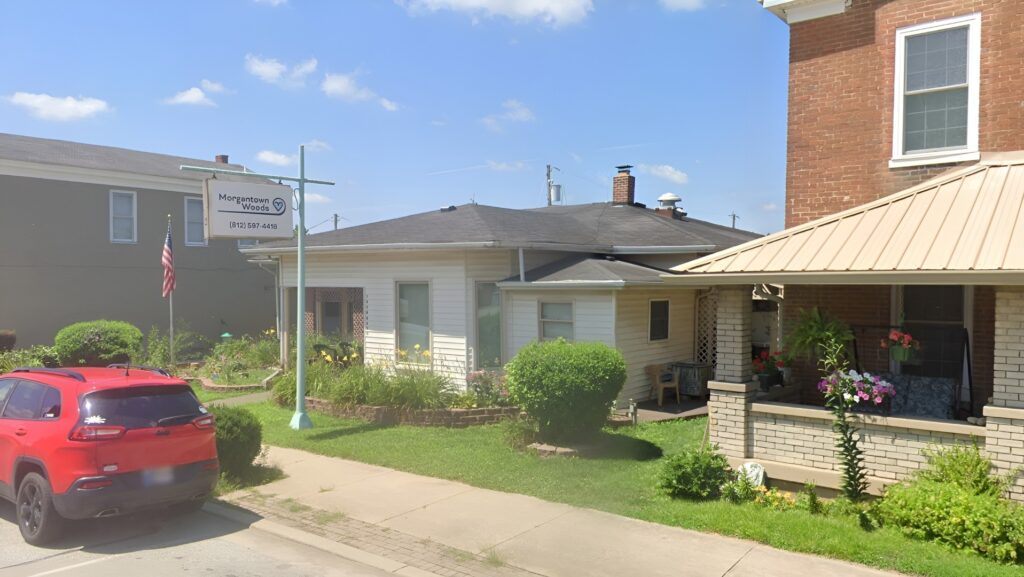 Morgantown Woods of Journey
  Serenity Springs Senior Living at Jasonville
![]() 0.5 miles from city center
0.5 miles from city center
![]() 514 16th St, Bedford, IN 47421
514 16th St, Bedford, IN 47421
Add your location
Source: CMS Payroll-Based Journal (Q2 2025)
| Role ⓘ | Count ⓘ | Avg Shift (hrs) ⓘ | Uses Contractors? ⓘ |
|---|---|---|---|
| Registered Nurse | 2 | 11.7 | No |
| Licensed Practical Nurse | 9 | 8.9 | Yes |
| Certified Nursing Assistant | 21 | 6.9 | No |
| Role ⓘ | Employees ⓘ | Contractors ⓘ | Total Staff ⓘ | Total Hours ⓘ | Days Worked ⓘ | % of Days ⓘ | Avg Shift (hrs) ⓘ |
|---|---|---|---|---|---|---|---|
| Certified Nursing Assistant | 21 | 0 | 21 | 5,807 | 91 | 100% | 6.9 |
| Licensed Practical Nurse | 6 | 3 | 9 | 1,737 | 91 | 100% | 8.9 |
| Dental Services Staff | 2 | 0 | 2 | 858 | 65 | 71% | 7.4 |
| Registered Nurse | 2 | 0 | 2 | 563 | 48 | 53% | 11.7 |
| Administrator | 1 | 0 | 1 | 520 | 65 | 71% | 8 |
| RN Director of Nursing | 1 | 0 | 1 | 520 | 65 | 71% | 8 |
| Nurse Practitioner | 2 | 0 | 2 | 503 | 62 | 68% | 8.1 |
| Dietitian | 1 | 0 | 1 | 463 | 67 | 74% | 6.9 |
| Other Dietary Services Staff | 2 | 0 | 2 | 382 | 51 | 56% | 7.5 |
| Physical Therapy Assistant | 1 | 0 | 1 | 273 | 91 | 100% | 3 |
| Respiratory Therapy Technician | 1 | 0 | 1 | 64 | 8 | 9% | 8 |
| Speech Language Pathologist | 1 | 0 | 1 | 32 | 16 | 18% | 2 |
| Occupational Therapy Aide | 0 | 1 | 1 | 25 | 7 | 8% | 3.5 |
| Medical Director | 0 | 1 | 1 | 24 | 12 | 13% | 2 |
| Feeding Assistant | 0 | 1 | 1 | 24 | 12 | 13% | 2 |
| Other Physician | 0 | 1 | 1 | 15 | 4 | 4% | 3.8 |
| Occupational Therapy Assistant | 0 | 1 | 1 | 11 | 3 | 3% | 3.5 |
Source: CMS Long-Term Care Facility Characteristics (Data as of Jan 2026)
Residents meet regularly to discuss policies, care quality, and activities
Organized group of residents that meets regularly to discuss facility policies, quality of life, and activities.
Data sourced from CMS Long-Term Care Facility Characteristics quarterly report. Payer mix reflects the current resident census by primary payment source.
These measures show how residents usually do over time at this home, based on health outcomes and preventive care.
Indiana average: 8.0
Indiana average: 17.1
Indiana average: 12.0%
Indiana average: 14.4%
Indiana average: 24.6%
Indiana average: 3.9%
Indiana average: 4.4%
Indiana average: 1.2%
Indiana average: 5.7%
Indiana average: 24.1%
Indiana average: 12.4%
Indiana average: 93.7%
Indiana average: 95.4%
Indiana average: 1.60
Indiana average: 1.48
Indiana average: 81.7%
Quality measures are calculated from Minimum Data Set (MDS) assessments. For most measures, lower percentages indicate better care quality.
Historical financial and operational data for Core of Bedford based on CMS SNF Cost Reports.
Loading trend charts...
Care Cost Calculator: See Prices in Your Area
Nursing Home Data Explorer
Don’t Wait Too Long: 7 Red Flag Signs Your Parent Needs Assisted Living Now
The True Cost of Assisted Living in 2025 – And How Families Are Paying For It
Understanding Senior Living Costs: Pricing Models, Discounts & Financial Assistance

Touring a community? Use this expert-backed checklist to stay organized, ask the right questions, and find the perfect fit.
We'll send you a PDF version of the touring checklist.


