


Country Meadows Village
Nursing Home, Assisted Living & Independent Living · Woodburn, OR


Country Meadows Village
Nursing Home, Assisted Living & Independent Living · Woodburn, OR
Country Meadows Village accepts Medicaid.
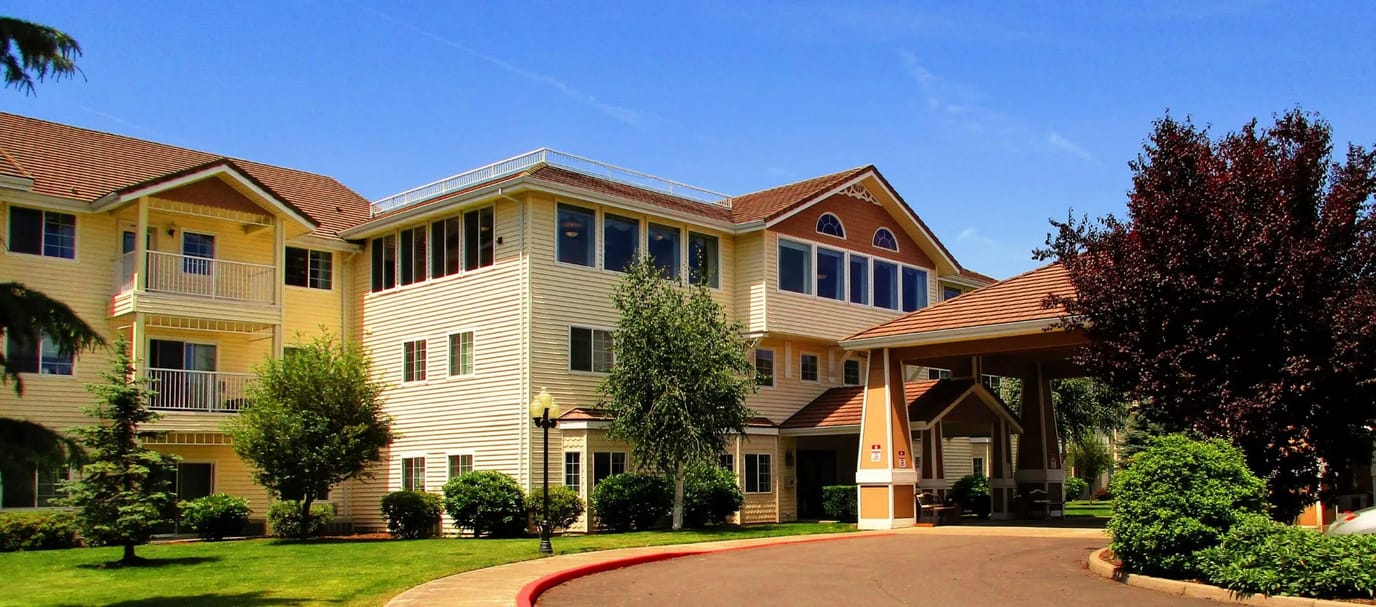
Overview of Country Meadows Village
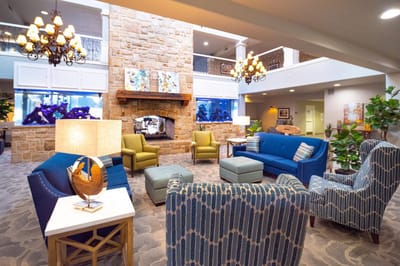
Considered the trusted independent living, assisted living, and memory care in Roseburg, Country Meadows Village stands as one of the best retirement communities in the area. The community prides itself on achieving a safe and secure community for residents to do as they please with assistance with daily living. Residents from different living options offer personalized care that allows them to receive the necessary care while promoting an active lifestyle.
Country Meadows Village’s residential living experience is built to be individual-focused; community features are expected to ensure a hassle-free lifestyle for every individual. They provide comprehensive and exclusive programs, such as wellness checks, personalized care plans, recreational activities, wellness programs, transportation services, and housekeeping services.
50-bed community Rank #227 / 351Bed count — State benchmarkedThis home is ranked 227th out of 351 homes in Oregon for bed count. Shows this facility's certified or reported bed count compared to other Oregon facilities. Larger communities may offer more amenities, programs, and on-site services for residents and families.Facilities with the same value for a metric share the same rank. Rankings are based only on facilities in Oregon that report data for that category. Facilities without available data are excluded from the ranking.Click the rank badge to see the full State ranking.Click here to see the full State ranking.
A moderately sized community that may balance personal attention with shared amenities and social activities.
23 years in operation Rank #195 / 375Years in operation — State benchmarkedThis home is ranked 195th out of 375 homes in Oregon for years in operation. Shows how long this facility has been in operation compared to other Oregon facilities. Longer operating histories may benefit residents, families, and staff.Facilities with the same value for a metric share the same rank. Rankings are based only on facilities in Oregon that report data for that category. Facilities without available data are excluded from the ranking.Click the rank badge to see the full State ranking.Click here to see the full State ranking.
A longer operating history, which may indicate experience navigating regulations and delivering ongoing care.
Walk Score: 55 / 100 Rank #255 / 475Walk Score — State benchmarkedThis home is ranked 255th out of 475 homes in Oregon for walk score. Shows how walkable this facility's neighborhood is compared to the average walk score across Oregon facilities. Higher scores benefit residents, families, and staff.Facilities with the same value for a metric share the same rank. Rankings are based only on facilities in Oregon that report data for that category. Facilities without available data are excluded from the ranking.Click the rank badge to see the full State ranking.Click here to see the full State ranking.
Moderately walkable. Some errands can be accomplished on foot, with a mix of nearby amenities.
About this community
Facility TypeAssisted Living Facility
StatusActive
IssuanceDecember 12, 2002
CountyMarion
Country Meadows Village is legally operated by Crown Two Development, LLC, and administered by Meggan Mendoza Ebata.
Nursing Services
24-Hour Staffing
Does not offer Alzheimer's Care
Smoking not allowed
Housekeeping
Transportation
Wellness Programs
Classes
ActivitiesLife Enrichment program features fitness classes, walking groups, social games, educational lectures, and outings
Specific ProgramsCottage Living, Culinary
Touring HoursMonday – Friday 8am – 5pm
Inspection History
In Oregon, the Department of Human Services, Aging and People with Disabilities performs unannounced surveys and regular inspections to ensure resident safety in all care settings.
Since 2022 · 4 years of data
86 deficiencies
5 inspections
Inspection Scorecard
 This scorecard compares key inspection, deficiency, and complaint metrics at this facility against the Oregon state average. Metrics rated ≥15% worse than average are highlighted in red; those ≥15% better are highlighted in green.
Since 2022 vs. Oregon state average
Overall vs. OR average
2 Worse
Metrics worse than Oregon average:
• Total deficiencies (177% above)
• Deficiencies per inspection (291% above) 0 Better No metrics in this bucket.
• Total deficiencies (177% above)
• Deficiencies per inspection (291% above) 0 Better No metrics in this bucket.
Deficiencies
| This Facility | OR Average | vs. OR Avg |
|---|---|---|---|
|
Total deficiencies
| 86 | 31 | This facility has 177% more total deficiencies than a typical Oregon nursing home (86 vs. OR avg 31).↑ 177% worse |
|
Deficiencies per inspection
| 17.2 | 4.4 | This facility has 291% more deficiencies per inspection than a typical Oregon nursing home (17.2 vs. OR avg 4.4).↑ 291% worse |
Inspections
| This Facility | OR Average | vs. OR Avg |
|---|---|---|---|
|
Total inspections
| 5 | 7 | This facility has had 29% fewer total inspections than the Oregon average (5 vs. OR avg 7). More inspections can mean more regulatory scrutiny rather than worse care.↓ 29% fewer |
Inspection Reports Summary
An editor-reviewed summary of the themes and findings across this facility's recent inspection reports.
- August 26, 2025 inspection found one food sanitation deficiency related to kitchen cleanliness and expired supplies.
- February 15, 2023 complaint investigation identified failure to fully implement and update the Acuity Based Staffing Tool.
- January 17, 2023 re-licensure visit corrected prior building maintenance and call system alarm deficiencies, achieving substantial compliance.
What does this home offer?
Pets Allowed
Room Sizes: 438 - 485 / 670 - 770 / 972 - 1,263 sq. ft
Housing Options: Studio / 1 Bed / 2 Bed
Living Spaces & Floor Plans for Country Meadows Village
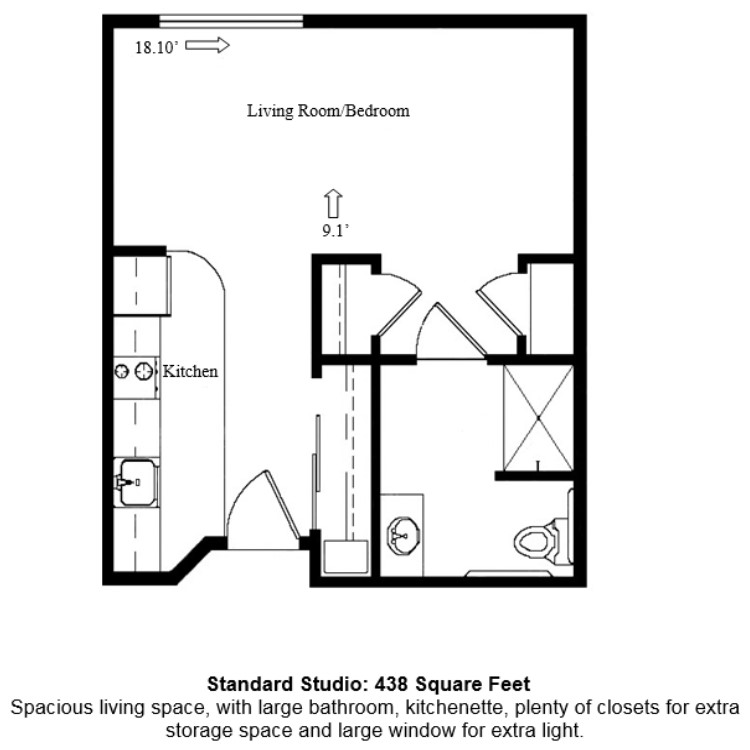
Studio
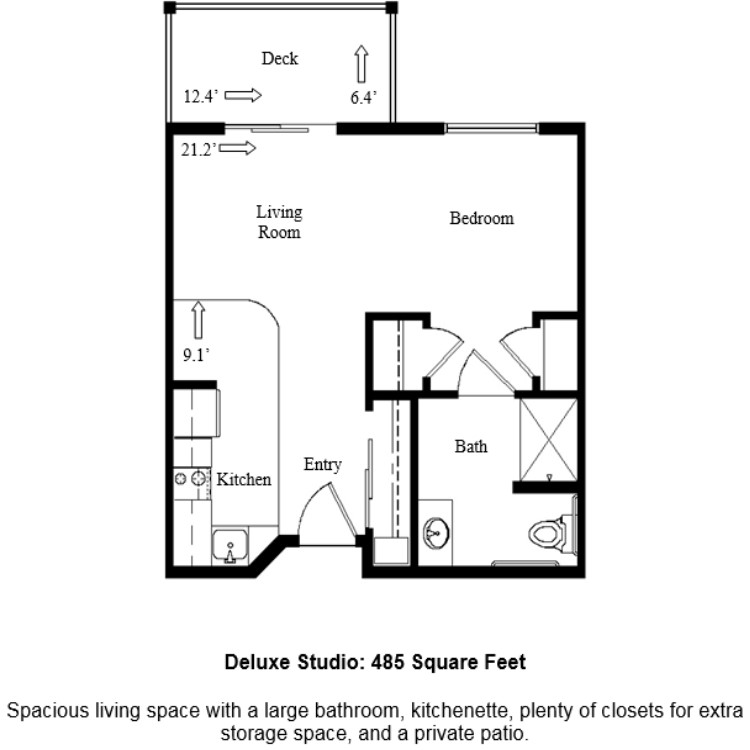
Studio
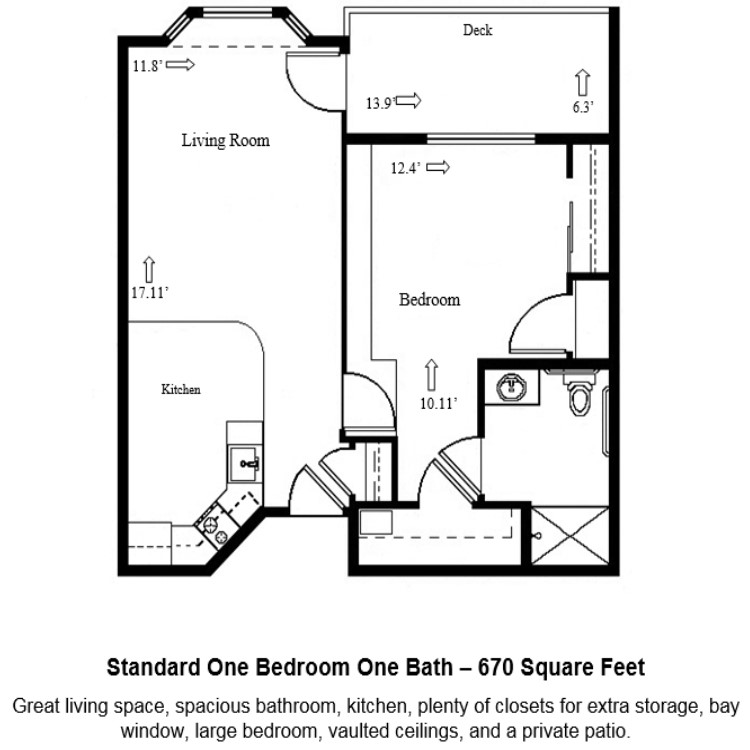
1 Bedroom
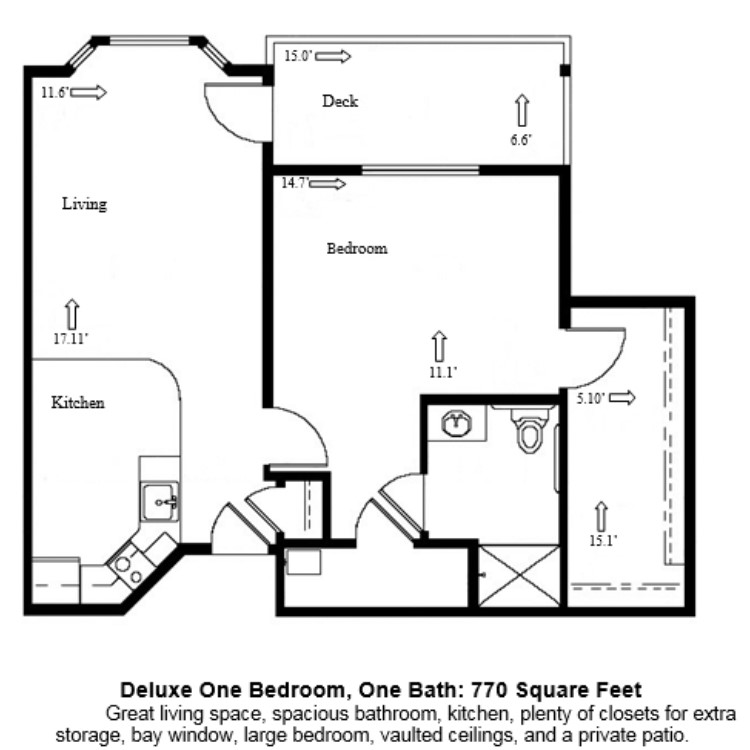
1 Bedroom
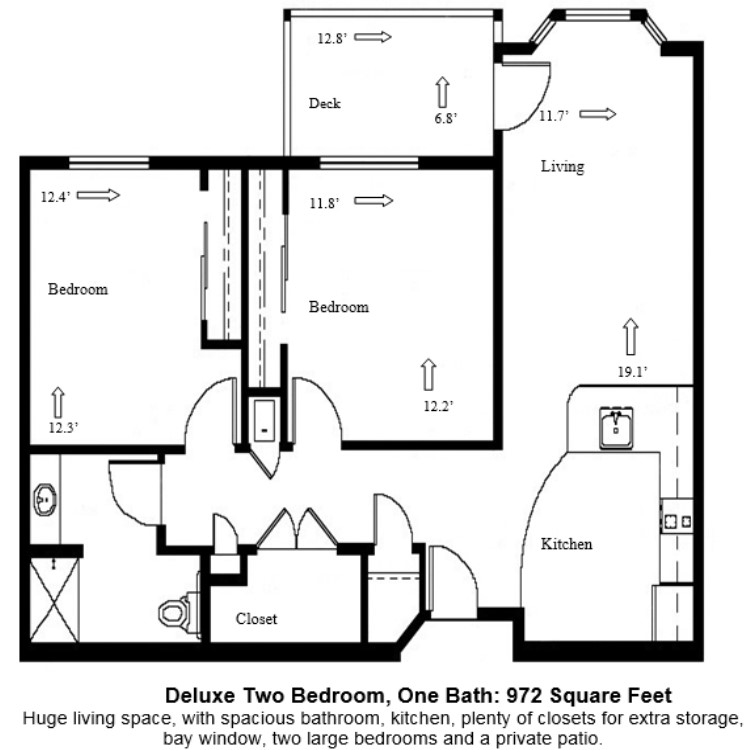
2 bedroom
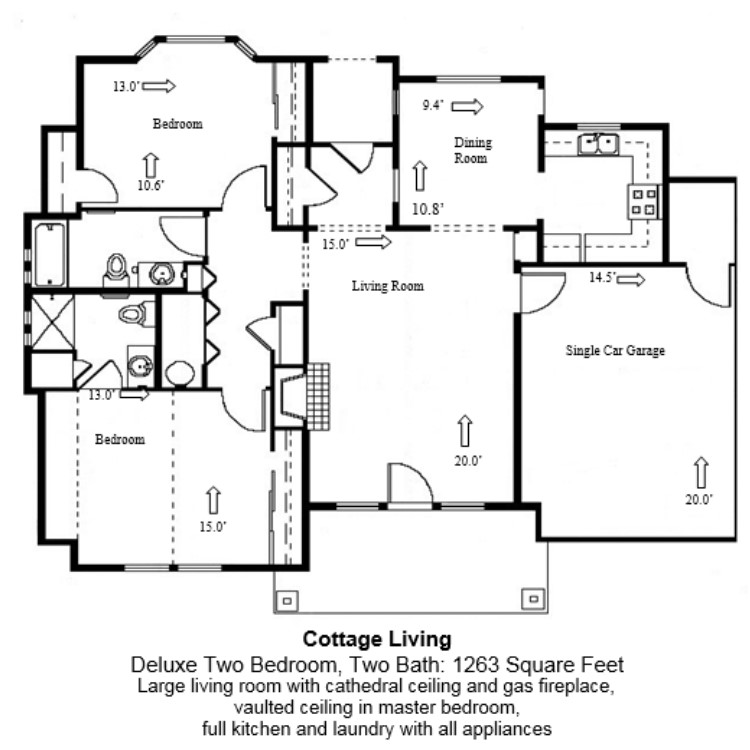
2 bedroom
Places of interest near Country Meadows Village
![]() 1.3 miles from city center
1.3 miles from city center
![]() Estimated distance in miles from Woodburn's city center to Country Meadows Village's address, calculated via Google Maps.
— 11.5 miles to nearest hospital (Providence Newberg Medical Center)
Estimated distance in miles from Woodburn's city center to Country Meadows Village's address, calculated via Google Maps.
— 11.5 miles to nearest hospital (Providence Newberg Medical Center)
Calculate Travel Distance to Country Meadows Village
Add your location
Frequently Asked Questions about Country Meadows Village
What neighborhood is Country Meadows Village in?
Country Meadows Village is in the Country Meadows Village neighborhood of Woodburn.
Who is the owner of Country Meadows Village?
Country Meadows Village is legally operated by Crown Two Development, LLC, and administered by Meggan Mendoza Ebata.
Is Country Meadows Village in a walkable area?
Country Meadows Village has a walk score of 55. Moderately walkable. Some errands can be accomplished on foot, with a mix of nearby amenities.
How long has Country Meadows Village been in business?
Country Meadows Village has been operating for approximately 23 years, based on available licensing and registration records.
Are pets allowed at Country Meadows Village?
Yes, Country Meadows Village allows residents to bring their pets.
What is the best email address for Country Meadows Village?
The team at Country Meadows Village can be reached at health@countrymeadowsvillage.com.
Who is the administrator of Country Meadows Village?
Meggan Mendoza Ebata is the administrator of Country Meadows Village.
Guides for Better Senior Living
Care Cost Calculator: See Prices in Your Area
Nursing Home Data Explorer
Don’t Wait Too Long: 7 Red Flag Signs Your Parent Needs Assisted Living Now
The True Cost of Assisted Living in 2025 – And How Families Are Paying For It
Understanding Senior Living Costs: Pricing Models, Discounts & Financial Assistance
Updated on
