

Total health inspections
17
California average 12.5
Last Health inspection on Aug 2025

We arrange tours, appointments, and even moving support so you don’t have to
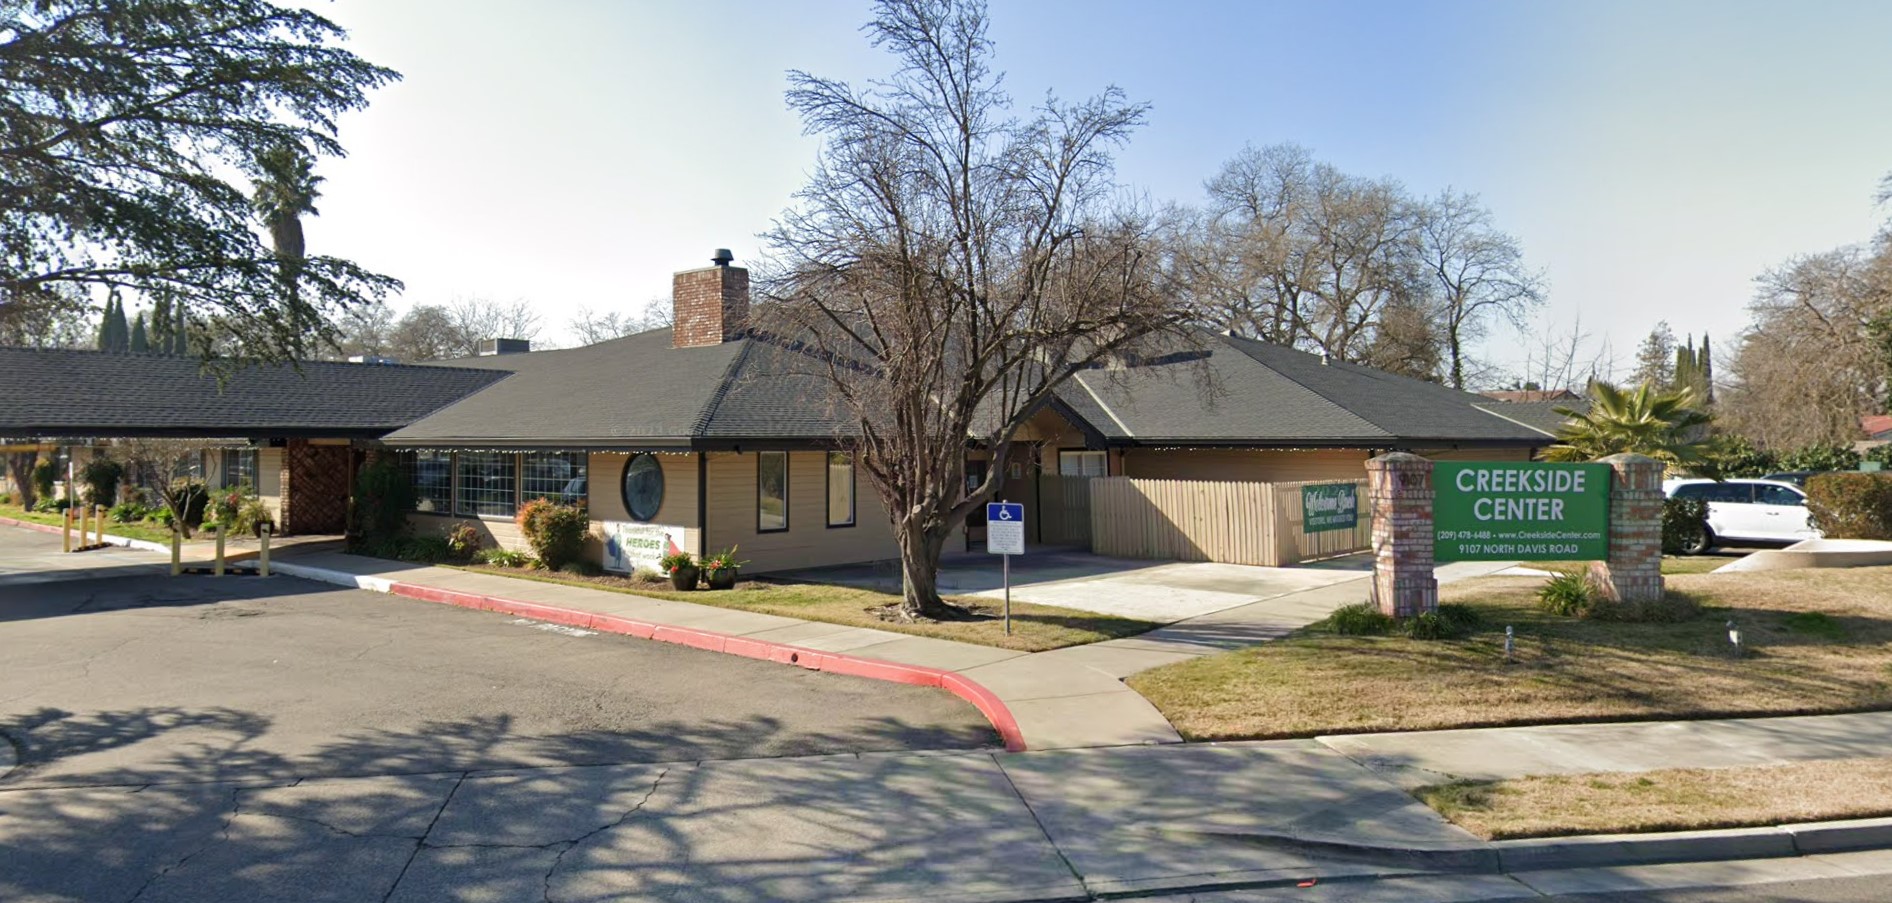
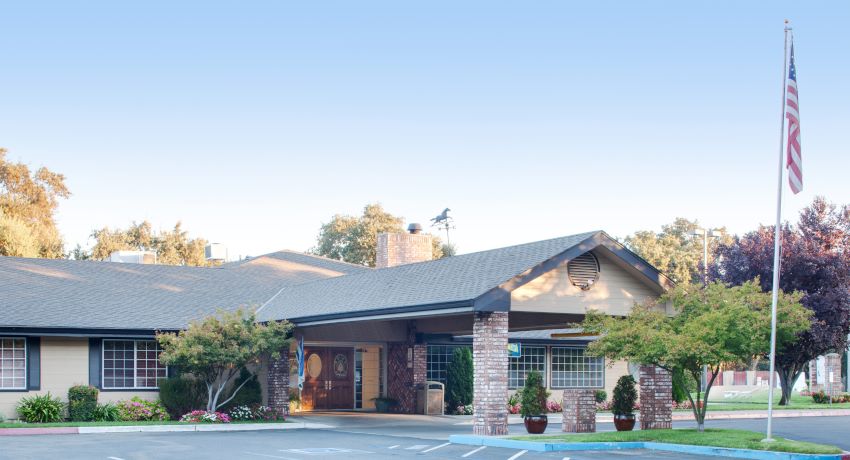
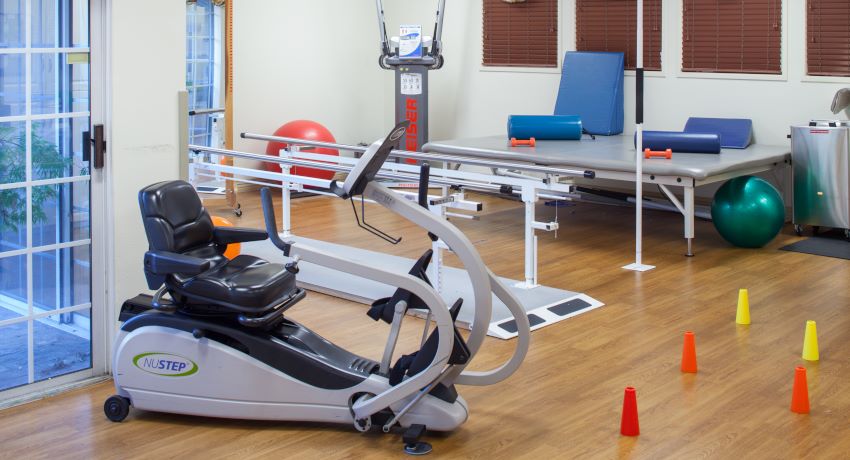

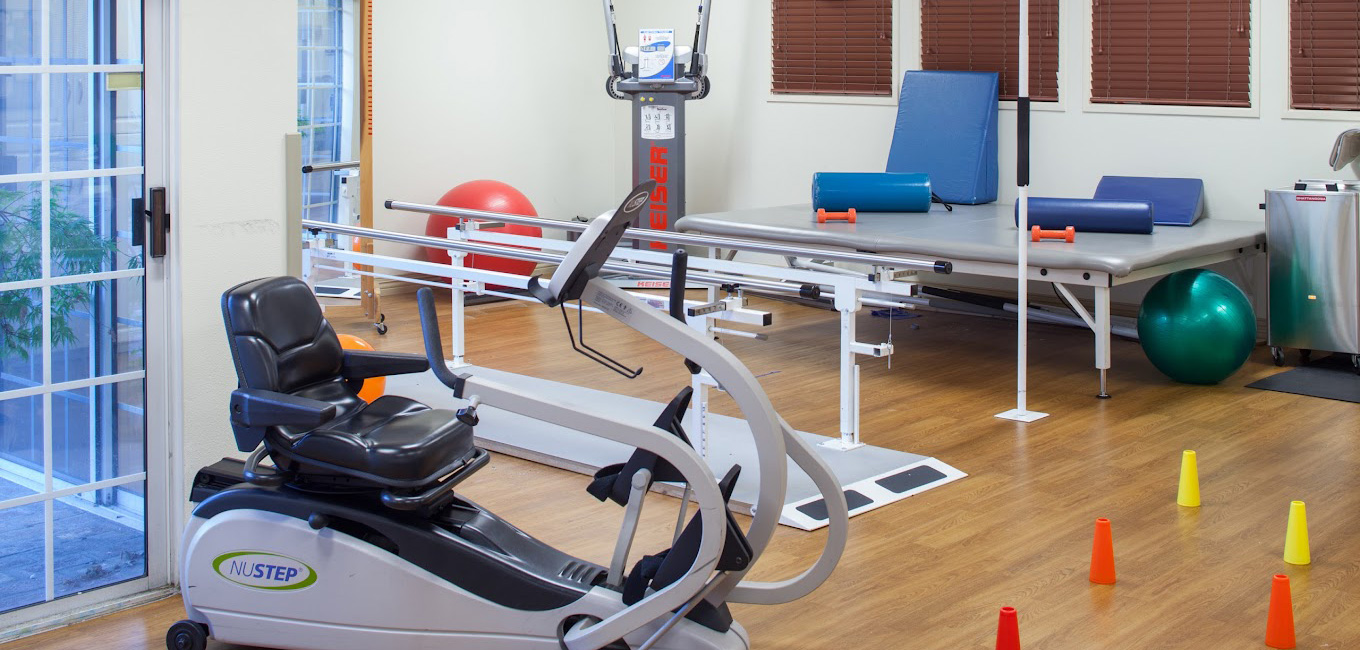


Creekside Center, located in the serene surroundings of Stockton, CA, is a facility that provides unparalleled skilled nursing services to patients in need of post-acute medical and rehabilitation care. With a commitment to excellence, Creekside Center specializes in providing comprehensive support to patients dealing with a myriad of conditions, including pulmonary impairment, diabetes management, wound care, joint replacement, orthopedic injuries, stroke, neurological disorders, cardiac-related problems, and cancer. The facility’s experienced medical professionals employ cutting-edge techniques and personalized treatment plans to facilitate patients’ recovery journeys, ensuring optimal health and well-being.
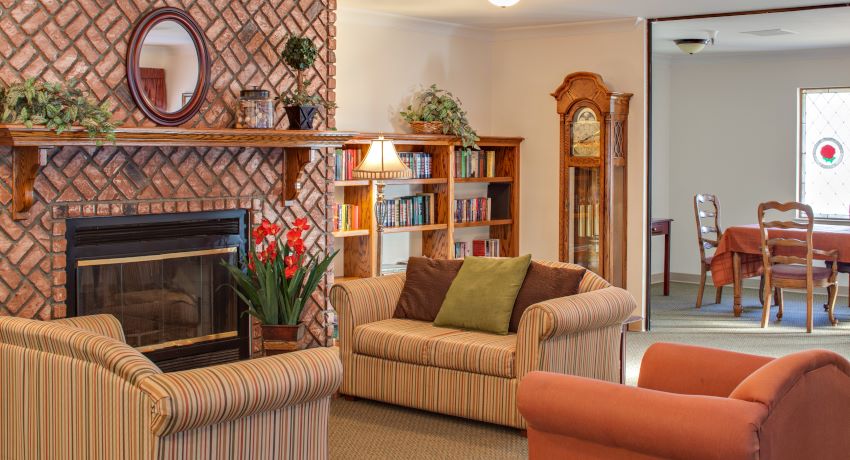
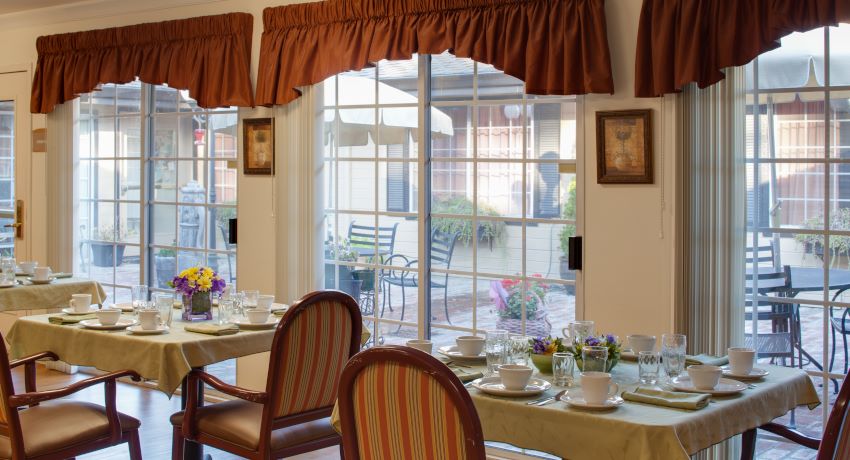
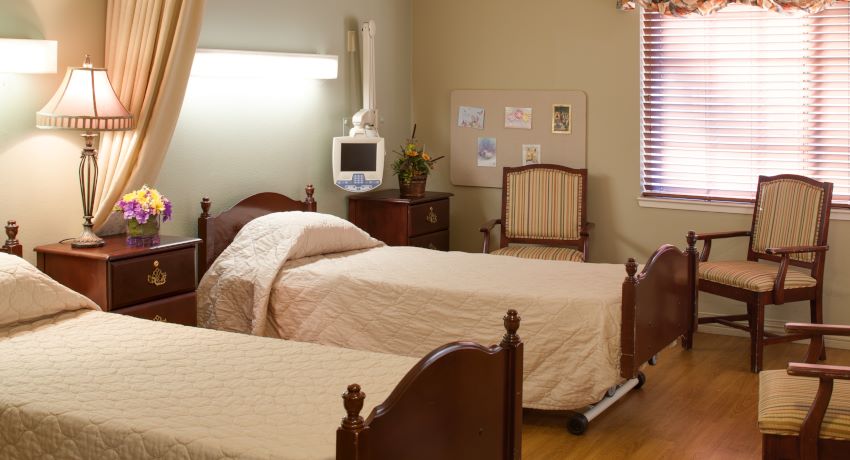
Creekside Center takes pride in its inviting atmosphere, offering spacious private and semi-private rooms that are fully air-conditioned, providing patients with a comfortable and tranquil space to focus on their recovery. To enhance the overall well-being of residents, the facility provides a range of amenities, including grooming services, ensuring residents can maintain their self-esteem and dignity. Creekside Center also offers housekeeping and laundry services, allowing patients to focus solely on their recovery without worrying about daily chores. Additionally, the facility ensures the dietary needs of patients are met, accommodating special dietary restrictions and offering expertly prepared meals and services, fostering a nurturing environment conducive to healing and recovery.
Matthew Taylor serves as the Administrator at Creekside Center. He holds credentials as a Nursing Home Administrator (NHA) and Residential Care Facility for the Elderly (RCFE) licensee, providing dedicated leadership to ensure quality care and a supportive environment for residents.
 Official CMS rating based on health inspections, staffing and quality measures.
Official CMS rating based on deficiencies found during state health inspections.
Official CMS rating based on nurse staffing hours per resident per day.
Official CMS rating based on clinical outcomes for residents.
Average daily nursing hours per resident (adjusted for acuity). Higher values indicate more nursing time per resident.
Hours of care per resident per day, broken down by staff type. Data from CMS Medicare.
Registered nurse hours per resident per day.
Licensed Practical Nurse / Licensed Vocational Nurse hours per resident per day.
Nurse aide hours per resident per day.
Total number of nurse staff hours per resident per day on weekends.
Physical therapist staff hours per resident per day.
Registered nurse hours per resident per day on weekends.
Official CMS rating based on health inspections, staffing and quality measures.
Official CMS rating based on deficiencies found during state health inspections.
Official CMS rating based on nurse staffing hours per resident per day.
Official CMS rating based on clinical outcomes for residents.
Average daily nursing hours per resident (adjusted for acuity). Higher values indicate more nursing time per resident.
Hours of care per resident per day, broken down by staff type. Data from CMS Medicare.
Registered nurse hours per resident per day.
Licensed Practical Nurse / Licensed Vocational Nurse hours per resident per day.
Nurse aide hours per resident per day.
Total number of nurse staff hours per resident per day on weekends.
Physical therapist staff hours per resident per day.
Registered nurse hours per resident per day on weekends.
May offer a more intimate, personalized care environment.
That suggests steady demand, but availability may be limited.
Most residents typically stay for a few weeks or months before returning home or moving on.
49% of new residents, usually for short-term rehab.
33% of new residents, often for short stays.
18% of new residents, often for long-term daily care.
The portion of the home's budget spent on staff, including nurses, caregivers, and other employees who support care and operations.
All remaining costs needed to run the home, such as food, utilities, building maintenance, supplies and administrative expenses.
Memory Care Specialized care for those with Memory Loss, Alzheimer's, or dementia, ensuring safety and support.
Nursing Homes 24/7 care needed
Respite Care
Nursing Homes 24/7 care needed
Nursing Homes 24/7 care needed
Hospice Care
Nursing Homes 24/7 care needed
Nursing Homes 24/7 care needed
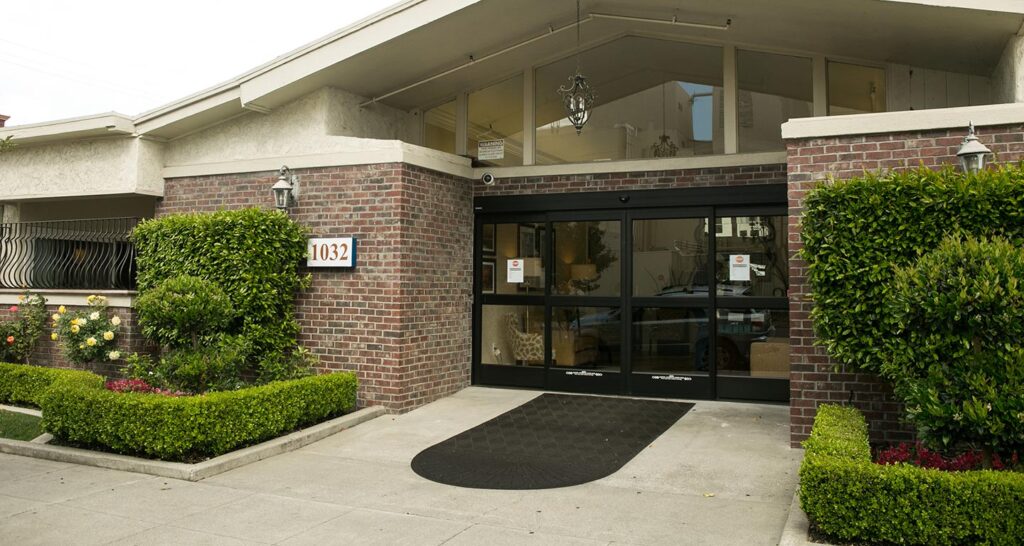
 Riverwood Health Care Center
 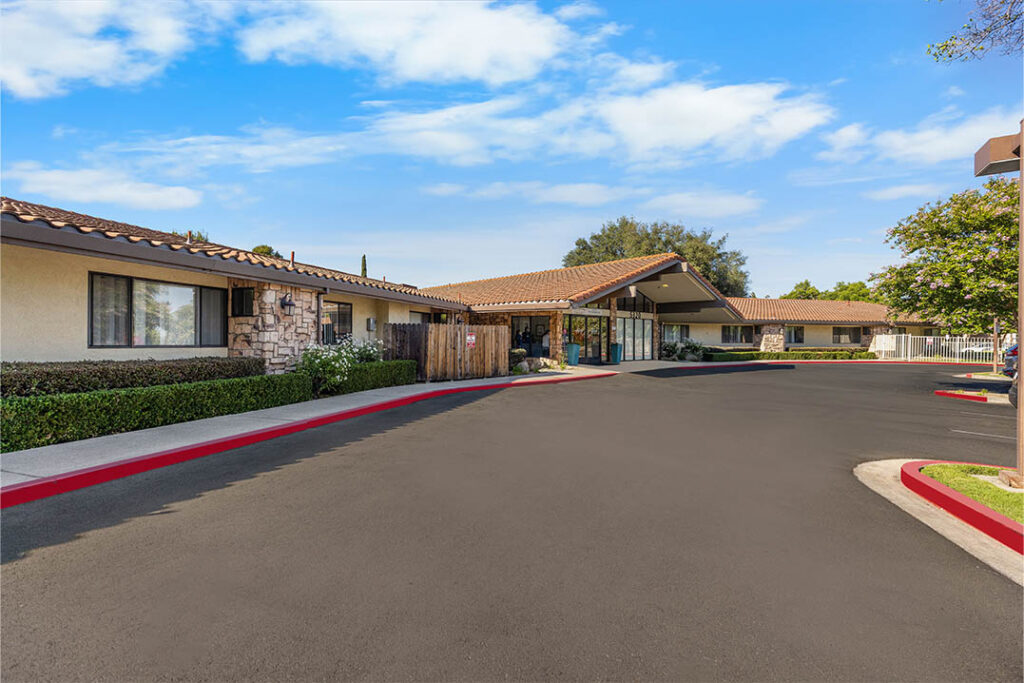 Riverwood Healthcare Center
  Creekside Center
  Lincoln Square
![]() 6.2 miles from city center — 2.18 miles to nearest hospital (Kaiser Permanente)
6.2 miles from city center — 2.18 miles to nearest hospital (Kaiser Permanente)
![]() 9107 Davis Rd, Stockton, CA 95209
9107 Davis Rd, Stockton, CA 95209
Add your location
Source: CMS Payroll-Based Journal (Q2 2025)
| Role ⓘ | Count ⓘ | Avg Shift (hrs) ⓘ | Uses Contractors? ⓘ |
|---|---|---|---|
| Registered Nurse | 7 | 6.3 | No |
| Licensed Practical Nurse | 31 | 7.6 | No |
| Certified Nursing Assistant | 52 | 7.4 | No |
| Role ⓘ | Employees ⓘ | Contractors ⓘ | Total Staff ⓘ | Total Hours ⓘ | Days Worked ⓘ | % of Days ⓘ | Avg Shift (hrs) ⓘ |
|---|---|---|---|---|---|---|---|
| Certified Nursing Assistant | 52 | 0 | 52 | 15,951 | 91 | 100% | 7.4 |
| Licensed Practical Nurse | 31 | 0 | 31 | 6,178 | 91 | 100% | 7.6 |
| RN Director of Nursing | 6 | 0 | 6 | 1,880 | 80 | 88% | 8 |
| Registered Nurse | 7 | 0 | 7 | 1,186 | 91 | 100% | 6.3 |
| Speech Language Pathologist | 4 | 0 | 4 | 1,172 | 77 | 85% | 7.3 |
| Other Dietary Services Staff | 3 | 0 | 3 | 1,059 | 91 | 100% | 7.8 |
| Physical Therapy Aide | 3 | 1 | 4 | 1,034 | 77 | 85% | 5.8 |
| Respiratory Therapy Technician | 3 | 0 | 3 | 929 | 75 | 82% | 6.3 |
| Dental Services Staff | 2 | 0 | 2 | 887 | 64 | 70% | 7.8 |
| Physical Therapy Assistant | 2 | 0 | 2 | 871 | 74 | 81% | 6.7 |
| Nurse Practitioner | 1 | 0 | 1 | 508 | 64 | 70% | 7.9 |
| Qualified Social Worker | 2 | 0 | 2 | 334 | 63 | 69% | 5.3 |
| Administrator | 1 | 0 | 1 | 288 | 36 | 40% | 8 |
| Clinical Nurse Specialist | 2 | 0 | 2 | 199 | 25 | 27% | 6.9 |
| Occupational Therapy Aide | 0 | 1 | 1 | 99 | 19 | 21% | 5.2 |
| Occupational Therapy Assistant | 0 | 1 | 1 | 67 | 10 | 11% | 6.7 |
| Medical Director | 0 | 2 | 2 | 44 | 22 | 24% | 2 |
| Other Physician | 0 | 1 | 1 | 8 | 4 | 4% | 2 |
California average 12.5
Last Health inspection on Aug 2025
Health citations are formal notices following inspections when they fail to comply with safety and care standards.
19 of 41 citations resulted from standard inspections; and 22 of 41 resulted from complaint investigations.
California average: 0.4
California average: 1
Data sourced from CMS Health Deficiencies reports. Citation severity codes range from A (least serious) to L (most serious). Immediate Jeopardy (J-L) citations indicate situations where the facility's noncompliance has placed residents at risk of death or serious harm.
Source: CMS Long-Term Care Facility Characteristics (Data as of Jan 2026)
Active councils help families stay involved in care decisions and facility operations.
These measures show how residents usually do over time at this home, based on health outcomes and preventive care.
California average: 6.6
California average: 11.3
California average: 11.1%
California average: 12.0%
California average: 11.3%
California average: 1.7%
California average: 5.0%
California average: 1.2%
California average: 4.2%
California average: 6.7%
California average: 10.1%
California average: 98.5%
California average: 98.2%
California average: 2.25
California average: 1.59
California average: 94.0%
California average: 1.5%
California average: 93.2%
California average: 23.2%
California average: 11.2%
California average: 0.8%
California average: 53.7%
California average: 50.6%
Quality measures are calculated from Minimum Data Set (MDS) assessments. For most measures, lower percentages indicate better care quality.
Historical financial and operational data for Creekside Center based on CMS SNF Cost Reports.
Loading trend charts...
Care Cost Calculator: See Prices in Your Area
Nursing Home Data Explorer
Don’t Wait Too Long: 7 Red Flag Signs Your Parent Needs Assisted Living Now
The True Cost of Assisted Living in 2025 – And How Families Are Paying For It
Understanding Senior Living Costs: Pricing Models, Discounts & Financial Assistance

We help families find affordable senior communities and unlock same day discounts, Medicaid, and Medicare options tailored to your needs.
Contact us Today
Touring a community? Use this expert-backed checklist to stay organized, ask the right questions, and find the perfect fit.
We'll send you a PDF version of the touring checklist.


