


Hospitalizations per 1,000 days
 Number of hospitalizations per 1,000 long-stay resident days.
2.30
Number of hospitalizations per 1,000 long-stay resident days.
2.30
California average: 2.25
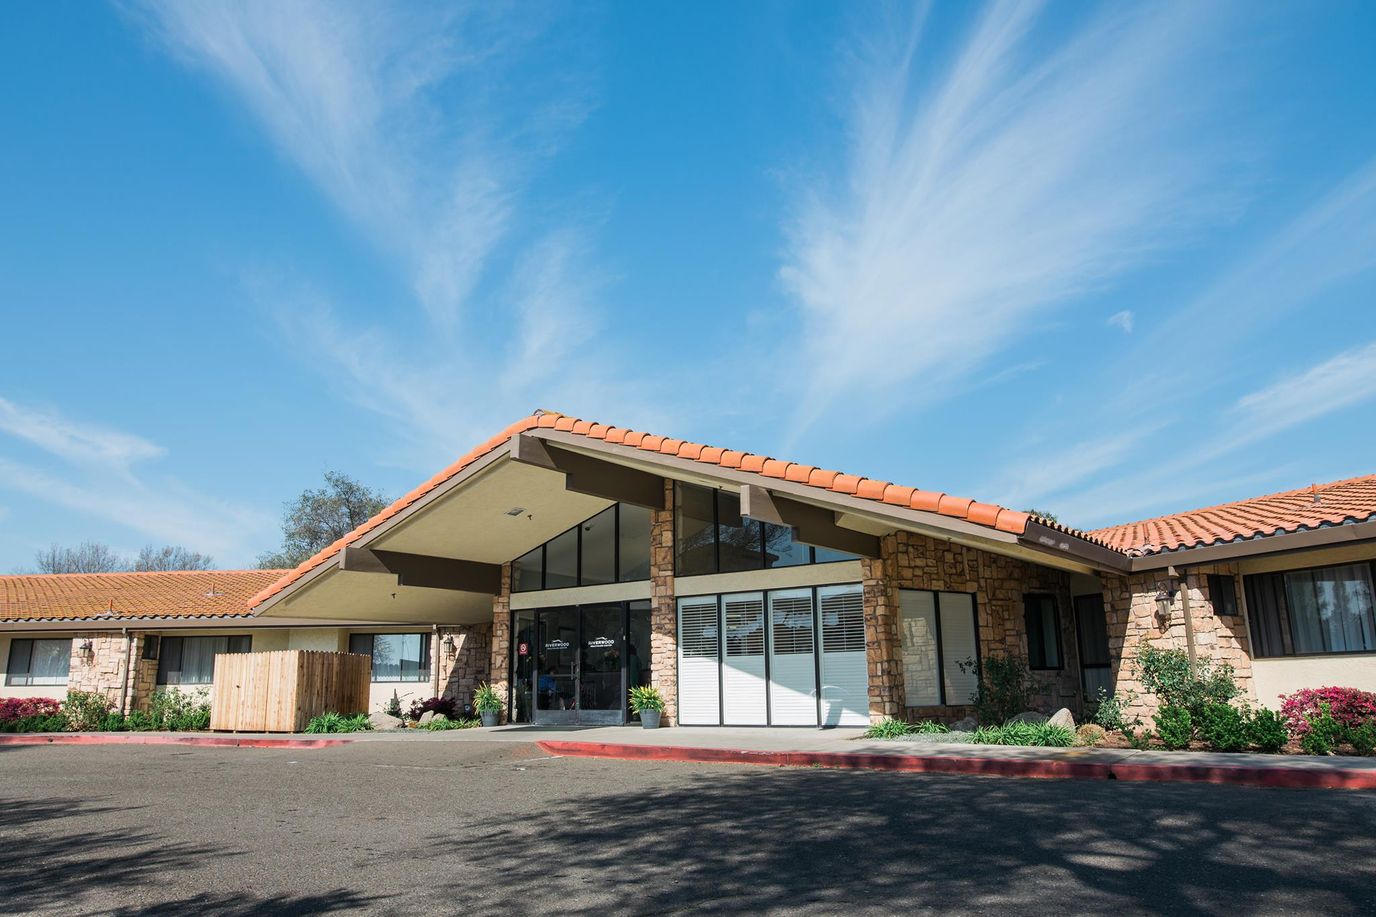
Offering nursing home, skilled nursing, hospice, respite, and memory care services, Riverwood Health Care Center is a skilled nursing community in Stockton, California. The community is located a few miles from downtown Stockton. It has been serving residents for 10 years, giving it an established presence in the area.
Care centers on 24-hour nursing support, with additional services for pain management, diabetes management, mental health, dementia, and memory care.
The nursing team includes registered nurses, licensed practical or vocational nurses, and certified nurse aides. Nurse aides provide an average of about 2 hours and 32 minutes of care per resident each day, making up the largest share of direct daily support. Registered nurses contribute about 20 minutes of care per resident daily, while licensed practical and vocational nurses provide an average of 1 hour and 19 minutes. Weekend staffing is consistent with weekday coverage, so residents receive steady support throughout the week.
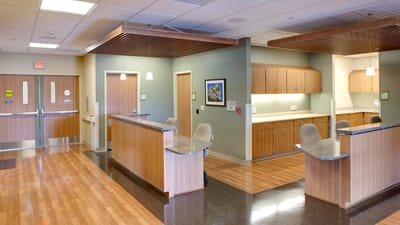
Meals are prepared to meet each resident’s dietary needs rather than following a standard menu. Regular social events encourage residents to stay engaged with one another. Spacious resident rooms provide a comfortable place to live while receiving care.
The area has a Walk Score of 63 out of 100, which is moderately walkable. Some errands and outings can be completed on foot, but others require a short drive. That convenience may be helpful for family members deciding whether to drive or walk during visits from nearby accommodations.
Families considering Riverwood Health Care Center should ask how the community coordinates memory care and hospice services with its daily skilled nursing care because that integration can have an important impact on residents with more complex care needs.
Staffing hours
![]() Daily nursing hours per resident by staff type, reported to CMS. Higher is generally better — compare this facility to state and national averages to see where staffing stands.
Daily nursing hours per resident by staff type, reported to CMS. Higher is generally better — compare this facility to state and national averages to see where staffing stands.
Hours per resident per day vs California averages
4 of 5 metrics below state avg
In California, the Department of Social Services (for assisted living facilities) and the Department of Public Health (for nursing homes) conduct inspections to ensure resident safety and regulatory compliance.
7 points below the California average for nursing homes (81/100)
Rank #996 / 1475 in California Inspection Score — State benchmarked This home is ranked 996th out of 1475 homes in California for inspection score. Shows this facility's inspection score compared to the California average among 1475 comparable communities in the ranking pool. Facilities with the same value for a metric share the same rank. Rankings are based only on facilities in California that report data for that category. Facilities without available data are excluded from the ranking. This is a proprietary Assisted Living Magazine score. Inspection score: 74 out of 100. Letter grade C. 7 points below the California average for nursing homes (81/100)
Citations
| This Facility | CA Average | vs. CA Avg |
|---|---|---|---|
|
Total citations
| 37 | 10 | This facility has 270% more total citations than a typical California nursing home (37 vs. CA avg 10).↑ 270% worse |
|
Citations per inspection
| 4.6 | 3.3 | This facility has 39% more citations per inspection than a typical California nursing home (4.6 vs. CA avg 3.3).↑ 39% worse |
Inspections & Visits
| This Facility | CA Average | vs. CA Avg |
|---|---|---|---|
|
Total inspections
| 4 | 16 | This facility has had 75% fewer total inspections than the California average (4 vs. CA avg 16). More inspections can mean more regulatory scrutiny rather than worse care.↓ 75% fewer |
|
Complaint visits
| 4 | 13 | This facility has had 69% fewer complaint visits than the California average (4 vs. CA avg 13). More inspections can mean more regulatory scrutiny rather than worse care.↓ 69% fewer |
|
Other visits
| 0 | 7 | This facility has had 100% fewer other visits than the California average (0 vs. CA avg 7). More inspections can mean more regulatory scrutiny rather than worse care.↓ 100% fewer |
These measures show how residents usually do over time at this home, based on health outcomes and preventive care.
California average: 2.25
California average: 1.59
California average: 23.2%
California average: 11.2%
California average: 0.8%
California average: 53.7%
California average: 50.6%
Quality measures are calculated from Minimum Data Set (MDS) assessments. For most measures, lower percentages indicate better care quality.
![]() 3.3 miles from city center
3.3 miles from city center
![]() Estimated distance in miles from Stockton's city center to Riverwood Health Care Center's address, calculated via Google Maps.
Estimated distance in miles from Stockton's city center to Riverwood Health Care Center's address, calculated via Google Maps.
Add your location
Info below is compiled from CMS reports & the CA Dept. of Social Services (CDSS), senior community websites & trusted data sources such as Walk Score & BBB.
Communities are listed from highest to lowest based on our ranking methodology.
| O‘Connor Woods | NH AL IL MC RC SNF | Stockton (Sherwood Manor) | 499
Facility
499
CA AVG
104
Rank
#23 / 1646 | - | - | 4.69
Facility
4.69
CA AVG
4.22
Rank
#53 / 289 | +42% | +11% | $0
Facility
$0
CA AVG
$56.5k
Rank
#1 / 294 | 94
Facility
94
CA AVG
81
Rank
#212 / 1475 | 44
Facility
44
CA AVG
50.2
Rank
#159 / 291 | 4.0
Facility
4.0
CA AVG
4.6
Rank
#141 / 291 | - | 95 | - |
22
Facility
22
CA AVG
59
Rank
#1824 / 2058 | O'connor Woods Housing Corp | $34.5MFiscal year ending 12/2023
Facility
$34.5MFiscal year ending 12/2023
CA AVG
$15.7M
Rank
#7 / 260 | $15.8MFiscal year ending 12/2023
Facility
$15.8MFiscal year ending 12/2023
CA AVG
$8.9M
Rank
#19 / 260 | 45.7%Fiscal year ending 12/2023
Facility
45.7%Fiscal year ending 12/2023
CA AVG
61.1%
Rank
#233 / 260 | 555713 | ||||
| Creekside Center | NH HOS MC RC SNF | Stockton (Stonewood) | 75
Facility
75
CA AVG
104
Rank
#952 / 1646 |
96.5%
Facility
96.5%
CA AVG
73.9
Rank
#179 / 1492 | +31% | 3.99
Facility
3.99
CA AVG
4.22
Rank
#151 / 289 | -55% | -5% | $0
Facility
$0
CA AVG
$56.5k
Rank
#1 / 294 | - | 41
Facility
41
CA AVG
50.2
Rank
#145 / 291 | 2.4
Facility
2.4
CA AVG
4.6
Rank
#21 / 291 | - | 72 | - | 65 | - | $12.5MFiscal year ending 12/2023
Facility
$12.5MFiscal year ending 12/2023
CA AVG
$15.7M
Rank
#155 / 260 | $5.4MFiscal year ending 12/2023
Facility
$5.4MFiscal year ending 12/2023
CA AVG
$8.9M
Rank
#210 / 260 | 43%Fiscal year ending 12/2023
Facility
43%Fiscal year ending 12/2023
CA AVG
61.1%
Rank
#244 / 260 | 555387 | ||||
| Riverwood Healthcare Center | NH HOS MC RC SNF | Stockton (Valley Oak) | 99
Facility
99
CA AVG
104
Rank
#725 / 1646 |
91.3%
Facility
91.3%
CA AVG
73.9
Rank
#316 / 1492 | +24% | 4.23
Facility
4.23
CA AVG
4.22
Rank
#113 / 289 | -10% | 0% | $52.9k
Facility
$52.9k
CA AVG
$56.5k
Rank
#254 / 294 | - | 31
Facility
31
CA AVG
50.2
Rank
#100 / 291 | 3.9
Facility
3.9
CA AVG
4.6
Rank
#136 / 291 | 1 | 90 | - | 63 | Martin Gittleman | $15.4MFiscal year ending 12/2023
Facility
$15.4MFiscal year ending 12/2023
CA AVG
$15.7M
Rank
#114 / 260 | $7.6MFiscal year ending 12/2023
Facility
$7.6MFiscal year ending 12/2023
CA AVG
$8.9M
Rank
#148 / 260 | 49.2%Fiscal year ending 12/2023
Facility
49.2%Fiscal year ending 12/2023
CA AVG
61.1%
Rank
#199 / 260 | 555496 | ||||
| Lincoln Square Post-Acute Care | NH HOS RC SNF | Stockton (Civic Center) | 68
Facility
68
CA AVG
104
Rank
#1013 / 1646 |
85.9%
Facility
85.9%
CA AVG
73.9
Rank
#435 / 1492 | +16% | 3.66
Facility
3.66
CA AVG
4.22
Rank
#197 / 289 | +9% | -13% | $0
Facility
$0
CA AVG
$56.5k
Rank
#1 / 294 | - | 55
Facility
55
CA AVG
50.2
Rank
#203 / 291 | 6.9
Facility
6.9
CA AVG
4.6
Rank
#267 / 291 | - | 58 | - |
80
Facility
80
CA AVG
59
Rank
#416 / 2058 | Taylor Ellis-Sherinian | $12.3MFiscal year ending 12/2023
Facility
$12.3MFiscal year ending 12/2023
CA AVG
$15.7M
Rank
#159 / 260 | $6.5MFiscal year ending 12/2023
Facility
$6.5MFiscal year ending 12/2023
CA AVG
$8.9M
Rank
#177 / 260 | 52.9%Fiscal year ending 12/2023
Facility
52.9%Fiscal year ending 12/2023
CA AVG
61.1%
Rank
#142 / 260 | 555186 |
Riverwood Health Care Center is located in Stockton, California.
Here are the financial assistance programs available to residents in California.
Riverwood Health Care Center is in the Valley Oak neighborhood of Stockton.
Riverwood Health Care Center has a walk score of 63. Moderately walkable. Some errands can be accomplished on foot, with a mix of nearby amenities.
Riverwood Health Care Center has been operating for approximately 10 years, based on available licensing and registration records.
No, Riverwood Health Care Center has a no-pet policy.
Riverwood Health Care Center has had 37 reported citations since 2021 according to records from California Department of Social Services (CDSS).
Yes — there are 5 photos of Riverwood Health Care Center in the photo gallery on this page.
Riverwood Health Care Center is located at 5320 Carrington Cir, Stockton, CA 95210.
Care Cost Calculator: See Prices in Your Area
Nursing Home Data Explorer
Don’t Wait Too Long: 7 Red Flag Signs Your Parent Needs Assisted Living Now
The True Cost of Assisted Living in 2025 – And How Families Are Paying For It
Understanding Senior Living Costs: Pricing Models, Discounts & Financial Assistance


