Creekside Center
Nursing Home, Hospice Care, Memory Care & Respite Care · Stockton, CA
CMS overall rating Info CMS (the Centers for Medicare & Medicaid Services) is the federal agency that rates nursing home quality. Its Overall Rating runs from 1 to 5 stars, combining health inspections, staffing, and quality measures, with inspections weighted most heavily.

Creekside Center

Nursing Home, Hospice Care, Memory Care & Respite Care · Stockton, CA
CMS overall rating Info CMS (the Centers for Medicare & Medicaid Services) is the federal agency that rates nursing home quality. Its Overall Rating runs from 1 to 5 stars, combining health inspections, staffing, and quality measures, with inspections weighted most heavily.
Calculator: See prices in your area
Creekside Center accepts Medicare, Medicaid, and private pay.

Overview of Creekside Center

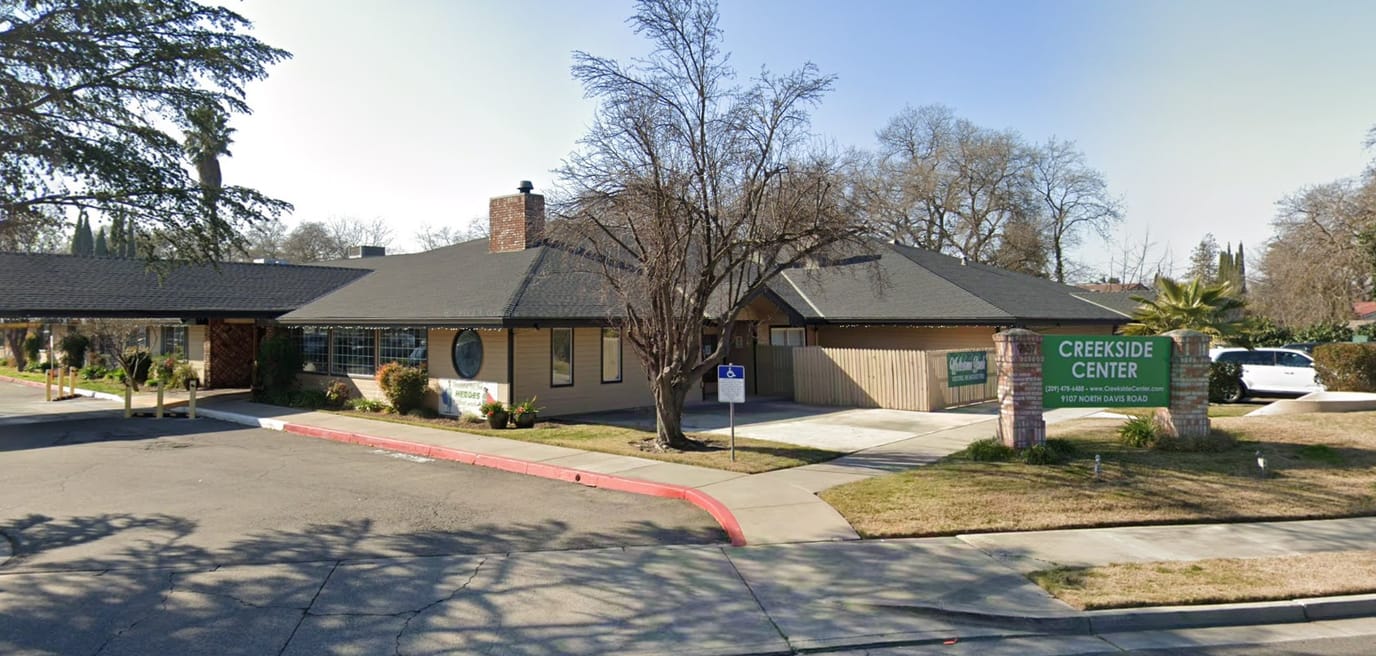
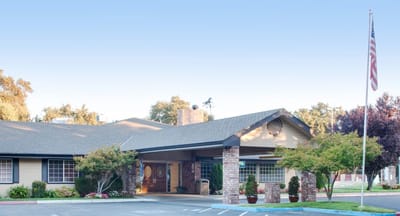
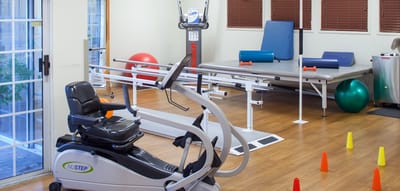
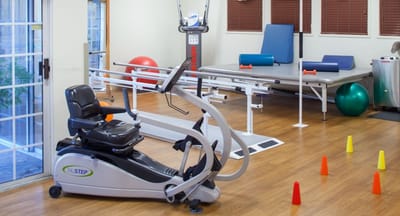
Creekside Center, located in the serene surroundings of Stockton, CA, is a facility that provides unparalleled skilled nursing services to patients in need of post-acute medical and rehabilitation care. With a commitment to excellence, Creekside Center specializes in providing comprehensive support to patients dealing with a myriad of conditions, including pulmonary impairment, diabetes management, wound care, joint replacement, orthopedic injuries, stroke, neurological disorders, cardiac-related problems, and cancer. The facility’s experienced medical professionals employ cutting-edge techniques and personalized treatment plans to facilitate patients’ recovery journeys, ensuring optimal health and well-being.

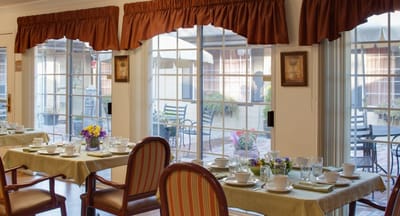
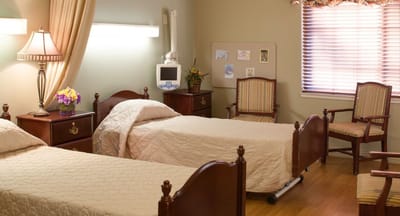
Creekside Center takes pride in its inviting atmosphere, offering spacious private and semi-private rooms that are fully air-conditioned, providing patients with a comfortable and tranquil space to focus on their recovery. To enhance the overall well-being of residents, the facility provides a range of amenities, including grooming services, ensuring residents can maintain their self-esteem and dignity. Creekside Center also offers housekeeping and laundry services, allowing patients to focus solely on their recovery without worrying about daily chores. Additionally, the facility ensures the dietary needs of patients are met, accommodating special dietary restrictions and offering expertly prepared meals and services, fostering a nurturing environment conducive to healing and recovery.

(209) 478-6488

Quality ratings

Measured by Centers for Medicare & Medicaid Services (CMS)

Overall rating Info The Overall CMS Rating combines results from health inspections, staffing levels and quality measures. Health inspections carry the most weight. Staffing and quality scores can increase or decrease the final rating based on performance compared to state and national standards.
▼ 4.7% Below CA avg. ▼ 4.7% Below CA avg.CA average: 3.1Click the badge to see the full State ranking.Click here to see the full State ranking.
Health Inspection Info Based on the results of the facility's three most recent standard inspections and any complaint investigations. CMS reviews the number, scope, and severity of deficiencies, with more recent findings weighted more heavily.
▲ 7.3% Above CA avg. ▲ 7.3% Above CA avg.CA average: 2.8Click the badge to see the full State ranking.Click here to see the full State ranking.
Staffing Info Measures average nursing staff hours per resident per day, including Registered Nurses (RNs) and total nursing staff. Ratings are adjusted based on the level of care residents require and are compared to state and national benchmarks.
▼ 36.3% Below CA avg. ▼ 36.3% Below CA avg.CA average: 3.1Click the badge to see the full State ranking.Click here to see the full State ranking.
Quality Measures Info Based on clinical and physical health indicators reported to CMS, such as hospital readmissions, falls, pressure ulcers, and improvements in mobility. These measures reflect how well residents' health needs are being managed.
▼ 2.1% Below CA avg. ▼ 2.1% Below CA avg.CA average: 4.1Click the badge to see the full State ranking.Click here to see the full State ranking.

Staffing hours breakdown

Info Daily nursing hours per resident by staff type, reported to CMS. Higher is generally better — compare this facility to state and national averages to see where staffing stands.

Hours per resident per day — compared to California state averages

Total nursing care / resident Info This home is ranked 184th out of 354 homes in California for nurse hours. Total adjusted nursing hours per resident per day, combining RN, LPN, and aide time. CMS adjusts this for case-mix so facilities can be fairly compared.
4h 0m per day
Rank #184 / 354Nurse hours — State benchmarkedThis home is ranked 184th out of 354 homes in California. Shows adjusted nurse hours per resident per day benchmarked to the California average, with a ranking across 354 California facilities. More hours mean more direct care. The national average is about 3.5 hrs; below 3.0 is a red flag.Rankings are based only on facilities in California that report data for that category. Facilities without available data are excluded from the ranking.Click the rank badge to see the full State ranking.Click here to see the full State ranking.
This facility California avg (4h 13m per day)
vs California avg
-5%

4 of 6 metrics below state avg

Standout metric Physical Therapist is +47% above state avg
Staff typeHours / Day / Residentvs state avg
Registered Nurse (RN) Info RNs hold the highest nursing license and can assess residents, interpret test results, and direct care plans. More RN hours per day often signals stronger clinical oversight and faster response to health changes. 17m per day ▼ 57% State avg: 39m per day · National avg: 41m per day
LPN / LVN Info Licensed Practical Nurses (LPNs) or Licensed Vocational Nurses (LVNs) deliver routine hands-on care — medication administration, wound dressing, and monitoring vital signs. They work under RN supervision and make up a large share of daily bedside care. 1h 18m per day ▲ 6% State avg: 1h 13m per day · National avg: 52m per day
Nurse Aide Info Certified Nurse Aides (CNAs) provide the most direct day-to-day assistance: bathing, dressing, feeding, and mobility. Nurse aide hours are typically the largest staffing category and directly affect residents' quality of life. 2h 25m per day ▼ 9% State avg: 2h 39m per day · National avg: 2h 21m per day
Weekend Total Nursing Info Combined nursing hours (RN + LPN + Nurse Aide) per resident per day on weekends. Staffing often drops on weekends — this figure reveals whether the facility maintains adequate coverage outside of weekday hours. 3h 40m per day ▼ 10% State avg: 4h 5m per day · National avg: 3h 26m per day
Physical Therapist Info Hours per resident per day provided by licensed Physical Therapists (PTs) or PT Assistants. PT services help residents recover mobility after injury or illness and are especially important for post-acute (short-stay) rehabilitation. 7m per day ▲ 47% State avg: 5m per day · National avg: 4m per day
Weekend RN Info Registered nurse hours specifically on weekends. Facilities sometimes reduce RN presence on Saturdays and Sundays — a low weekend RN figure compared to weekday hours can indicate reduced clinical oversight when most administrative staff are absent. 11m per day ▼ 63% State avg: 30m per day · National avg: 29m per day

Capacity and availability

This home is often near full

Higher occupancy than the California average: 84.7%
Occupancy rate
95% Rank #193 / 1537Occupancy rate — State benchmarkedThis home is ranked 193rd out of 1537 homes in California. Shows this facility's occupancy rate versus the California average, with its Statewide rank out of 1537. Higher occupancy signals strong local demand and financial stability.Rankings are based only on facilities in California that report data for that category. Facilities without available data are excluded from the ranking.Click the rank badge to see the full State ranking.Click here to see the full State ranking.
Avg. Length of Stay
156 days
Bed community size
75-bed community Rank #956 / 1657Bed count — State benchmarkedThis home is ranked 956th out of 1657 homes in California. Shows this facility's certified or reported bed count compared to other California facilities. Larger communities may offer more amenities, programs, and on-site services for residents and families.Rankings are based only on facilities in California that report data for that category. Facilities without available data are excluded from the ranking.Click the rank badge to see the full State ranking.Click here to see the full State ranking.
A moderately sized community that may balance personal attention with shared amenities and social activities.
Walk Score
Walk Score: 65 / 100 Rank #888 / 2092Walk Score — State benchmarkedThis home is ranked 888th out of 2092 homes in California. Shows how walkable this facility's neighborhood is compared to the average Walk Score across California facilities. Higher scores benefit residents, families, and staff.Rankings are based only on facilities in California that report data for that category. Facilities without available data are excluded from the ranking.Click the rank badge to see the full State ranking.Click here to see the full State ranking.
Moderately walkable. Some errands can be accomplished on foot, with a mix of nearby amenities.

Therapy & Rehabilitation

2 services
Rehabilitation Services
Respite Care

Staffing & Medical

1 service
24-Hour Staffing

Amenities & Lifestyle

Open Courtyard
Dining
Specific ProgramsCNA Academy, Send a Greeting, Leave a Review
Touring HoursM-F, 8 am to 5 pm, Sa-Su, 8 am to 5 pm

Dining & Nutrition

Food DescriptionWe provide an array of delicious and nutritious meals for our residents.

Contact Creekside Center

Staffing Data

Reporting period: October 1 – December 31, 2025 (Q4 2025). Source: CMS Payroll-Based Journal report.

Total staff 124
Employees 104
Contractors 20
Staff to resident ratio 1.85 : 1
0% compared with California average
California average ratio: 1.81 : 1 California average ratio: 1.81 : 1See full California ranking
Avg staff/day 49
Average shift 7.4 hours
0% compared with California average
California average: 7.7 hours California average shift: 7.7 hoursSee full California ranking
Total staff hours (quarter) 33,352

Nursing staff breakdown

Q4 2025 · Oct 1 – Dec 31 More info This data comes from the CMS Payroll-Based Journal report covering October 1 – December 31, 2025.
Registered Nurse

Manages medical care and health needs.

RN Staff Info All 5 RN Staff are full-time employees. No contractors work on this role. 5
Average shift length Info Average shift length. Calculated as total hours divided by days worked and average staff per day. 7.3 hours
Licensed Practical Nurse

Assists with medical care and medications.

LPN Staff Info All 26 LPN Staff are full-time employees. No contractors work on this role. 26
Average shift length Info Average shift length. Calculated as total hours divided by days worked and average staff per day. 7.5 hours
Certified Nursing Assistant

Helps with daily care and mobility.

CNA Staff Info All 51 CNA Staff are full-time employees. No contractors work on this role. 51
Average shift length Info Average shift length. Calculated as total hours divided by days worked and average staff per day. 7.5 hours

Contractor staffing

Q4 2025 · Oct 1 – Dec 31 More info This data comes from the CMS Payroll-Based Journal report covering October 1 – December 31, 2025.

Total hours from contractors

13.5%

4,519 contractor hours this quarter

Speech Language Pathologist: 5 Physical Therapy Assistant: 3 Physical Therapy Aide: 3 Respiratory Therapy Technician: 3 Occupational Therapy Aide: 2 Qualified Social Worker: 1 Medical Director: 1 Occupational Therapy Assistant: 1 Other Physician: 1

Staff by category

Q4 2025 · Oct 1 – Dec 31 More info This data comes from the CMS Payroll-Based Journal report covering October 1 – December 31, 2025.
Certified Nursing Assistant5105116,01692100%7.5
Licensed Practical Nurse260266,59792100%7.5
RN Director of Nursing6062,0187177%8
Physical Therapy Aide0331,1987784%7.1
Speech Language Pathologist0551,1577986%7.2
Other Dietary Services Staff40498192100%7.7
Registered Nurse5058208087%7.3
Dental Services Staff2028176470%7.7
Respiratory Therapy Technician0338157683%6.7
Physical Therapy Assistant0337837582%6
Nurse Practitioner1015286672%8
Clinical Nurse Specialist2025237379%7
Administrator1015046368%8
Qualified Social Worker0113646773%5.4
Occupational Therapy Aide0221252426%5.2
Occupational Therapy Assistant0114078%5.7
Nurse Aide in Training6063055%4.3
Medical Director011301516%2
Other Physician011844%2
51 Certified Nursing Assistant
% of Days 100%
26 Licensed Practical Nurse
% of Days 100%
6 RN Director of Nursing
% of Days 77%
3 Physical Therapy Aide
% of Days 84%
5 Speech Language Pathologist
% of Days 86%
4 Other Dietary Services Staff
% of Days 100%
5 Registered Nurse
% of Days 87%
2 Dental Services Staff
% of Days 70%
3 Respiratory Therapy Technician
% of Days 83%
3 Physical Therapy Assistant
% of Days 82%
1 Nurse Practitioner
% of Days 72%
2 Clinical Nurse Specialist
% of Days 79%
1 Administrator
% of Days 68%
1 Qualified Social Worker
% of Days 73%
2 Occupational Therapy Aide
% of Days 26%
1 Occupational Therapy Assistant
% of Days 8%
6 Nurse Aide in Training
% of Days 5%
1 Medical Director
% of Days 16%
1 Other Physician
% of Days 4%

Penalties and fines

Federal penalties imposed by CMS for regulatory violations, including civil money penalties (fines) and denials of payment for new Medicare/Medicaid admissions.

Source: CMS Penalties Database

No penalties in the past 3 years

No civil money penalties or payment denials were reported in the last 3 years.

Quality of care over time

These measures show how residents usually do over time at this home, based on health outcomes and preventive care.

High-risk clinical events score Info A composite score based on pressure ulcers, falls with injury, weight loss, walking ability decline, and activities of daily living decline. 6.5
In line with California average

California average: 6.6

Functional decline score Info A composite score based on activities of daily living decline, walking ability decline, and incontinence. 12.0
6% worse than California average

California average: 11.3

Long-stay resident measures
Average California avg: 4.2 Info CMS star rating based on long-stay quality measure performance. 5 stars = significantly above average, 1 star = significantly below average.
Need for Help with Daily Activities Increased Info Percent of long-stay residents whose need for help with daily activities has increased 11.0%
In line with California average

California average: 11.1%

Walking Ability Worsened Info Percent of long-stay residents whose ability to move independently worsened 9.8%
19% better than California average

California average: 12.0%

Low Risk Residents with Bowel/Bladder Incontinence Info Percent of low risk long-stay residents who lose control of their bowels or bladder 15.1%
34% worse than California average

California average: 11.3%

Falls with Major Injury Info Percent of long-stay residents experiencing one or more falls with major injury 1.6%
7% better than California average

California average: 1.7%

High Risk Residents with Pressure Ulcers Info Percent of long-stay high risk residents with pressure ulcers 7.7%
56% worse than California average

California average: 5.0%

Urinary Tract Infection Info Percent of long-stay residents with a urinary tract infection 0.0%
100% better than California average

California average: 1.2%

Lost Too Much Weight Info Percent of long-stay residents who lose too much weight 2.3%
45% better than California average

California average: 4.2%

Depressive Symptoms Info Percent of long-stay residents who have depressive symptoms 0.0%
100% better than California average

California average: 6.7%

Antipsychotic Use Info Percent of long-stay residents who received an antipsychotic medication 13.2%
31% worse than California average

California average: 10.1%

Pneumococcal Vaccine Info Percent of long-stay residents assessed and appropriately given the pneumococcal vaccine 100.0%
In line with California average

California average: 98.5%

Influenza Vaccine Info Percent of long-stay residents assessed and appropriately given the seasonal influenza vaccine 90.7%
8% worse than California average

California average: 98.2%

Hospitalizations per 1,000 days Info Number of hospitalizations per 1,000 long-stay resident days. 1.98
12% better than California average

California average: 2.25

ED visits per 1,000 days Info Number of outpatient emergency department visits per 1,000 long-stay resident days. 1.95
23% worse than California average

California average: 1.59

Short-stay resident measures
Above average California avg: 3.5 Info CMS star rating based on short-stay quality measure performance. 5 stars = much above average, 1 star = much below average.
Pneumococcal Vaccine Info Percent of short-stay residents assessed and appropriately given the pneumococcal vaccine 94.9%
In line with California average

California average: 94.0%

Antipsychotic medication increase Info Percent of short-stay residents who newly received an antipsychotic medication 2.5%
75% worse than California average

California average: 1.5%

Influenza Vaccine Info Percent of short-stay residents assessed and appropriately given the seasonal influenza vaccine 90.1%
In line with California average

California average: 93.2%

Re-hospitalized after SNF stay Info Percentage of short-stay residents who were re-hospitalized after their nursing home admission. 20.0%
14% better than California average

California average: 23.2%

Emergency department visits Info Percentage of short-stay residents who had an outpatient emergency department visit. 11.4%
In line with California average

California average: 11.2%

Falls with major injury Info Percentage of SNF residents who experience falls with major injury during their stay. 0.8%
6% worse than California average

California average: 0.8%

Ability to care for self at discharge Info Percentage of residents at or above expected ability to care for themselves at discharge. 71.1%
32% better than California average

California average: 53.7%

Successful return to home or community Info Rate of successful return to home or community from a skilled nursing facility. 55.0%
9% better than California average

California average: 50.6%

Breakdown by payment type

Medicare

49% of new residents, usually for short-term rehab.

Typical stay 2 - 3 months

Private pay

33% of new residents, often for short stays.

Typical stay 2 months

Medicaid

18% of new residents, often for long-term daily care.

Typical stay 1 - 2 years

Facility Characteristics

Source: CMS Long-Term Care Facility Characteristics (Data as of Jan 2026)

Total residents 67
Medicare
22
32.8% of residents
Medicaid
43
64.2% of residents
Private pay or other
2
3% of residents
Programs & Services
Residents Group

Residents meet regularly to discuss policies, care quality, and activities

Nurse Aide Training

State-approved Nurse Aide Training and Competency Evaluation Program on-site

Active Resident Council

Organized group of residents that meets regularly to discuss facility policies, quality of life, and activities.

Finances and operations

Based on CMS SNF Cost Report for fiscal year ending in 12/2023.

Privately-owned community
Operated by a single business entity.
Net patient revenue Info Net patient revenue — what the home actually collects for resident care, after contractual allowances, bad debt and discounts are subtracted from its gross charges (CMS cost report, Worksheet G-3). It covers resident care only; money the home earns from other sources is shown separately as "Other income."
$12.5M
Net patient income Info Net patient income: net patient revenue minus the home's total operating expenses. A positive figure means it earns more from resident care than it spends to deliver it; a negative figure means the opposite. It excludes non-operating "other income."
$667.4K
Privately-owned community Operated by a single business entity.
Net patient revenue Info Net patient revenue — what the home actually collects for resident care, after contractual allowances, bad debt and discounts are subtracted from its gross charges (CMS cost report, Worksheet G-3). It covers resident care only; money the home earns from other sources is shown separately as "Other income."
$12.5M Rank #226 / 355Revenue — State benchmarkedThis home is ranked 226th out of 355 homes in California. Shows this facility's annual revenue compared to the California average. Higher revenue generally means more resources for staffing and capital — read alongside Payroll %.Rankings are based only on facilities in California that report data for that category. Facilities without available data are excluded from the ranking.Click the rank badge to see the full State ranking.Click here to see the full State ranking.
Net patient income Info Net patient income: net patient revenue minus the home's total operating expenses. A positive figure means it earns more from resident care than it spends to deliver it; a negative figure means the opposite. It excludes non-operating "other income."
$667.4K
Other income Info Money the home earns outside of resident care — such as investments, grants, rentals and other non-operating sources (CMS cost report, Worksheet G-3). It is tracked separately from net patient revenue: it is not part of that figure, and it is not included in net patient income.
$193.9K
Payroll costs Info Staff salaries plus wage-related costs — benefits such as payroll taxes, health insurance and retirement — from the home's own accounting records (CMS cost report, Worksheet A). Contract or agency labor is counted separately, under other operating costs. Rank #251 / 355Payroll — State benchmarkedThis home is ranked 251st out of 355 homes in California. Shows total annual staff payroll benchmarked to the California average. Higher payroll investment relative to peers often signals better staffing and less reliance on cheaper contract labor.Rankings are based only on facilities in California that report data for that category. Facilities without available data are excluded from the ranking.Click the rank badge to see the full State ranking.Click here to see the full State ranking.
$5.4M 43% of net patient revenue Info Payroll as a share of revenue: staff salaries and wage-related benefits divided by net patient revenue. A higher figure means more of each revenue dollar goes to staff pay. Rank #219 / 355Payroll % — State benchmarkedThis home is ranked 219th out of 355 homes in California. Shows payroll as a percentage of revenue versus the California average. Well-run California facilities typically land around 56–67% — the top third Statewide. Below 25% may signal understaffing or heavy agency use — read with Staffing ratings.Rankings are based only on facilities in California that report data for that category. Facilities without available data are excluded from the ranking.Click the rank badge to see the full State ranking.Click here to see the full State ranking.
Other operating costs Info Everything it costs to run the home apart from payroll — food, utilities, supplies, maintenance, contract labor and administration. Calculated as total operating expense minus payroll (staff salaries and wage-related benefits).
$6.5M
Total costs Info The home's total operating expense for the year — all the costs of running it, salaries included (CMS cost report, Worksheet G-3).
$11.8M

Who this home usually serves

TYPE OF STAY

Mostly short-term rehab stays

Most residents typically stay for a few weeks or months before returning home or moving on.

New residents most often arrive under Medicare (49% of admissions), and a typical Medicare stay runs around 2 - 3 months.

Admissions
169 total

Coverage residents most often arrive under.

Medicare 49%
Private pay 33%
Medicaid 18%
Discharges
167 total

Coverage residents most often leave under.

Medicare 64%
Medicaid 35%

Managed by Matthew Taylor, Nha, Rcfe

Administrator

Matthew Taylor serves as the Administrator at Creekside Center. He holds credentials as a Nursing Home Administrator (NHA) and Residential Care Facility for the Elderly (RCFE) licensee, providing dedicated leadership to ensure quality care and a supportive environment for residents.

Places of interest near Creekside Center

Address 6.2 miles from city center Info Estimated distance in miles from Stockton's city center to Creekside Center's address, calculated via Google Maps.

Calculate Travel Distance to Creekside Center

Add your location

Address

Compare Nursing Homes around Stockton

The information below is reported by the California Department of Social Services and Department of Public Health.

5 facilities compared · CMS & CA Dept. of Health data

O‘Connor Woods
NH
AL
IL
MC
RC
Stockton (Sherwood Manor)
499
Facility 499
CA AVG 103
Rank #23 / 1657
--
4.69
Facility 4.69
CA AVG 4.22
Rank #69 / 354
+42%+11%
$0
Facility $0
CA AVG $56.5k
Rank #1 / 362
94
Facility 94
CA AVG 81
Rank #185 / 1401
44
Facility 44
CA AVG 50.2
Rank #196 / 361
4.0
Facility 4.0
CA AVG 4.6
Rank #169 / 361
-67-
22
Facility 22
CA AVG 57
Rank #1826 / 2092
O'connor Woods Housing Corp
$34.5M
Facility $34.5M
CA AVG $17.0M
Rank #26 / 355
$15.8M
Facility $15.8M
CA AVG $7.0M
Rank #18 / 355
45.7%
Facility 45.7%
CA AVG 45.2%
Rank #229 / 355
555713
Creekside Center
NH
HC
MC
RC
Stockton (Stonewood)
75
Facility 75
CA AVG 103
Rank #956 / 1657
95.0%
Facility 95.0%
CA AVG 84.7%
Rank #193 / 1537
+12%
3.99
Facility 3.99
CA AVG 4.22
Rank #184 / 354
-55%-5%
$0
Facility $0
CA AVG $56.5k
Rank #1 / 362
-
41
Facility 41
CA AVG 50.2
Rank #176 / 361
2.4
Facility 2.4
CA AVG 4.6
Rank #25 / 361
-72-
65
Facility 65
CA AVG 57
Rank #888 / 2092
-
$12.5M
Facility $12.5M
CA AVG $17.0M
Rank #226 / 355
$5.4M
Facility $5.4M
CA AVG $7.0M
Rank #251 / 355
43%
Facility 43%
CA AVG 45.2%
Rank #219 / 355
555387
Riverwood Healthcare Center
NH
HC
MC
RC
Stockton (Valley Oak)
99
Facility 99
CA AVG 103
Rank #725 / 1657
90.5%
Facility 90.5%
CA AVG 84.7%
Rank #308 / 1537
+7%
4.23
Facility 4.23
CA AVG 4.22
Rank #138 / 354
-10%0%
$52.9k
Facility $52.9k
CA AVG $56.5k
Rank #315 / 362
-
31
Facility 31
CA AVG 50.2
Rank #118 / 361
3.9
Facility 3.9
CA AVG 4.6
Rank #161 / 361
190-
63
Facility 63
CA AVG 57
Rank #951 / 2092
Martin Gittleman
$15.4M
Facility $15.4M
CA AVG $17.0M
Rank #200 / 355
$7.6M
Facility $7.6M
CA AVG $7.0M
Rank #153 / 355
49.2%
Facility 49.2%
CA AVG 45.2%
Rank #84 / 355
555496
Stockton Nursing Center
NH
Stockton (Pacific)
119
Facility 119
CA AVG 103
Rank #597 / 1657
88.2%
Facility 88.2%
CA AVG 84.7%
Rank #372 / 1537
+4%
4.57
Facility 4.57
CA AVG 4.22
Rank #80 / 354
-20%+8%
$83.7k
Facility $83.7k
CA AVG $56.5k
Rank #336 / 362
-
110
Facility 110
CA AVG 50.2
Rank #348 / 361
2.5
Facility 2.5
CA AVG 4.6
Rank #33 / 361
2113-
71
Facility 71
CA AVG 57
Rank #702 / 2092
Stockton Nursing And Rehab Center, LLC
$13.6M
Facility $13.6M
CA AVG $17.0M
Rank #231 / 355
$8.2M
Facility $8.2M
CA AVG $7.0M
Rank #172 / 355
60.5%
Facility 60.5%
CA AVG 45.2%
Rank #44 / 355
55201
Noble Care Center
NH
MC
RC
Stockton (Pacific)
99
Facility 99
CA AVG 103
Rank #725 / 1657
91.9%
Facility 91.9%
CA AVG 84.7%
Rank #269 / 1537
+9%
3.72
Facility 3.72
CA AVG 4.22
Rank #245 / 354
-17%-12%
$0
Facility $0
CA AVG $56.5k
Rank #1 / 362
-
91
Facility 91
CA AVG 50.2
Rank #329 / 361
3.5
Facility 3.5
CA AVG 4.6
Rank #115 / 361
-96A+
55
Facility 55
CA AVG 57
Rank #1215 / 2092
-
$17.7M
Facility $17.7M
CA AVG $17.0M
Rank #252 / 355
$5.7M
Facility $5.7M
CA AVG $7.0M
Rank #270 / 355
32.2%
Facility 32.2%
CA AVG 45.2%
Rank #211 / 355
555105

Financial Assistance for
Nursing Home in California

Creekside Center is located in Stockton, California.
Here are the financial assistance programs available to residents in California.

Get Financial aid guidance

Multipurpose Senior Services Program

MSSP (Medi-Cal Waiver)

Age 65+
General California resident, Medi-Cal eligible, nursing home risk.
Income Limits (2025) ~$2,829/month 300% FBR, individual
Asset Limits $2,000 (individual), $3,000 (couple).
CA

County-managed; waitlists possible.

Benefits
In-home support (4-6 hours/day) Respite care (14 days/year) Meals (~$6/meal) Transportation (8 trips/month) Care management

In-Home Supportive Services (IHSS)

California IHSS

Age 65+
General California resident, Medicaid-eligible or low-income.
Income Limits ~$1,732/month individual, Medi-Cal threshold
Asset Limits $2,000 individual
CA

Can hire family as caregivers.

Benefits
Personal care (up to 283 hours/month) Homemaker services Respite (varies)

Multipurpose Senior Services Program (MSSP)

CA MSSP

Age 65+
General California resident, Medi-Cal-eligible, nursing home-eligible but community-capable.
Income Limits ~$2,829/month 300% FBR, individual
Asset Limits $2,000 individual
CA

Available in 38 counties; waitlists common.

Benefits
Case management Respite care (up to 10 days/year) Minor home mods (avg. $500) Adult day care (~$50/day)

Property Tax Postponement Program (PTP)

CA PTP

Age 62+
General California resident, own and live in home, 40% equity.
Income Limits (2025) ~$51,500/year household, adjusted annually
Asset Limits Equity-based; no strict asset cap.
CA

Deferred taxes accrue interest (5% as of 2024); repaid upon sale/death.

Benefits
Property tax deferral (avg. $1,000-$3,000/year, varies by county)

Assisted Living Waiver (ALW)

CA ALW

Age 65+ or disabled
General California resident, Medi-Cal-eligible, nursing home-eligible.
Income Limits ~$2,829/month 300% FBR, individual
Asset Limits $2,000 individual
CA

Available in 15 counties (e.g., LA, Sacramento); waitlists common.

Benefits
Personal care in ALFs (5-7 hours/day) Medication management Social services

California CARES Program

CA CARES

Age
General Caregivers of California residents 60+ needing help with 3+ daily activities; no caregiver age limit.
Income Limits No strict limit; cost-sharing above ~$2,500/month threshold.
Asset Limits Not applicable; need-based.
CA

High demand in urban areas; complements IHSS respite.

Benefits
Respite care (up to 10 days/year) Counseling (4-6 sessions/year) Training (2-3 workshops/year) Supplies (~$200/year)

Frequently Asked Questions about Creekside Center

What neighborhood is Creekside Center in?

Creekside Center is in the Stonewood neighborhood.

Is Creekside Center in a walkable area?

Creekside Center has a walk score of 65. Moderately walkable. Some errands can be accomplished on foot, with a mix of nearby amenities.

What is the occupancy rate at Creekside Center?

Creekside Center's occupancy is 95.0%.

Are there photos of Creekside Center?

Yes — there are 7 photos of Creekside Center in the photo gallery on this page.

What is the address of Creekside Center?

Creekside Center is located at 9107 Davis Rd, Stockton, CA 95209.

What is the phone number of Creekside Center?

(209) 478-6488 will put you in contact with the team at Creekside Center.

Is Creekside Center Medicare or Medicaid certified?

Yes — Creekside Center is a CMS-certified provider of Medicare and Medicaid.

Guides for Better Senior Living

Care Cost Calculator: See Prices in Your Area

Nursing Home Data Explorer

Don’t Wait Too Long: 7 Red Flag Signs Your Parent Needs Assisted Living Now

The True Cost of Assisted Living in 2025 – And How Families Are Paying For It

Understanding Senior Living Costs: Pricing Models, Discounts & Financial Assistance