Lincoln Square
Nursing Home & Hospice Care · Stockton, CA
CMS overall rating Info CMS (the Centers for Medicare & Medicaid Services) is the federal agency that rates nursing home quality. Its Overall Rating runs from 1 to 5 stars, combining health inspections, staffing, and quality measures, with inspections weighted most heavily.

Lincoln Square

Nursing Home & Hospice Care · Stockton, CA
CMS overall rating Info CMS (the Centers for Medicare & Medicaid Services) is the federal agency that rates nursing home quality. Its Overall Rating runs from 1 to 5 stars, combining health inspections, staffing, and quality measures, with inspections weighted most heavily.
Calculator: See prices in your area
Lincoln Square accepts Medicare, Medicaid, and private pay.

Overview of Lincoln Square

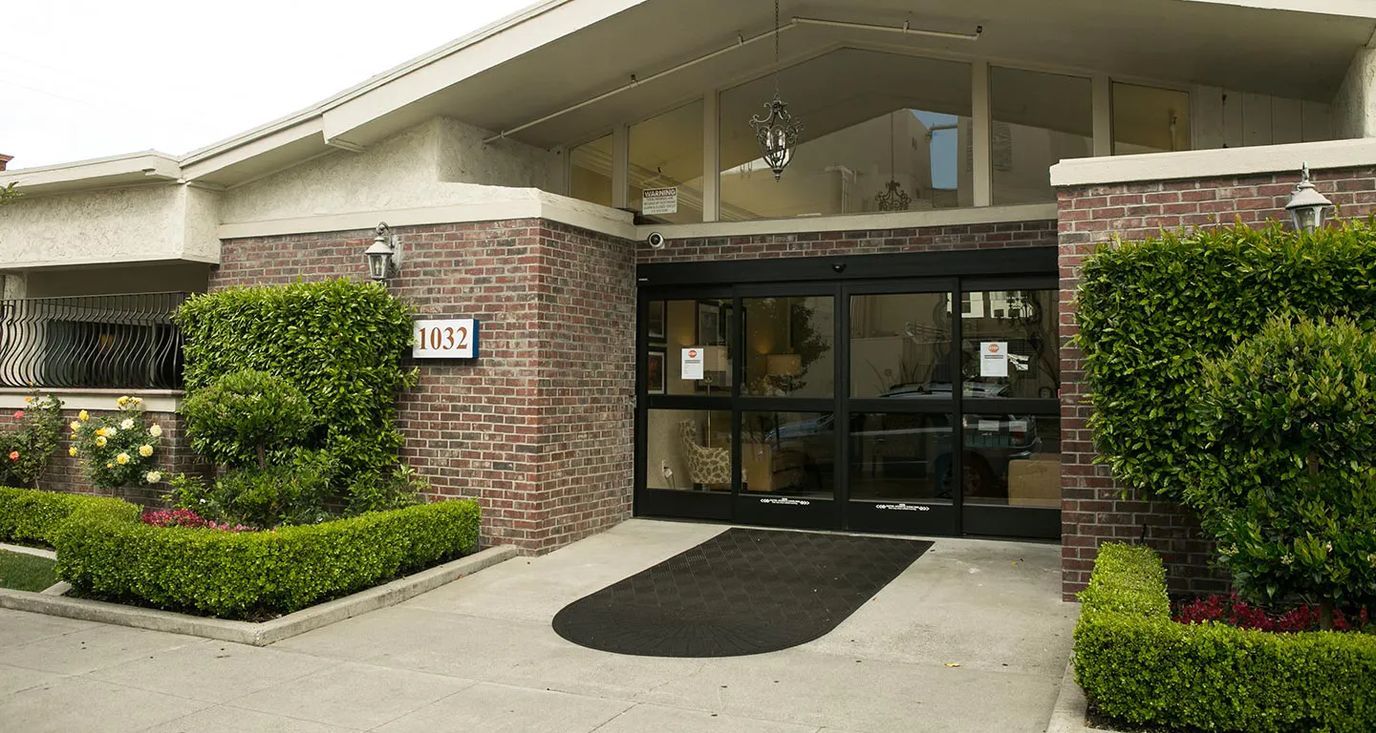
Lincoln Square, seated in Stockton, CA, is a skilled nursing facility that offers a comprehensive range of services designed to cater to various healthcare needs. With a focus on rehabilitation and long-term/end-of-life care, Lincoln Square provides a nurturing environment where residents receive top-notch medical attention and support. The facility’s dedicated team of professionals delivers personalized nursing services, ensuring residents’ well-being through expert medication management and assistance with Activities of Daily Living (ADLs).

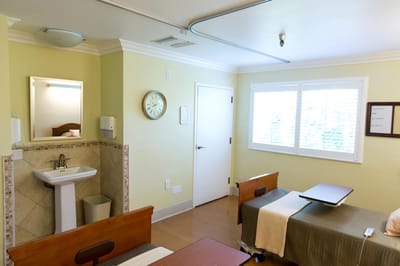
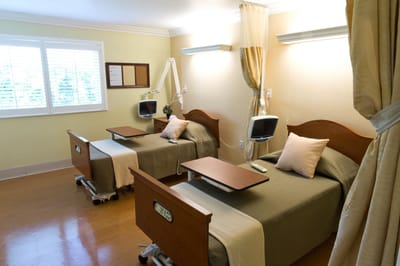
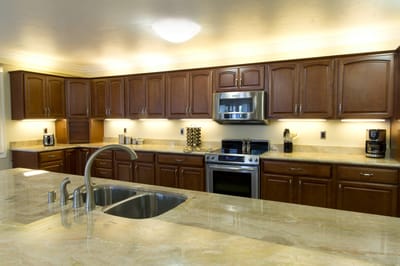
At Lincoln Square, residents benefit from specialized dementia care, tailored to meet the unique needs of individuals with memory impairments. The facility boasts 24-hour supervision and a responsive 24-hour call system, always ensuring the residents’ safety. With 12–16-hour nursing services, residents receive continuous medical care, further enhancing their peace of mind. Lincoln Square prioritizes residents’ comfort with essential housekeeping services, maintaining a clean and hygienic living environment. Additionally, the facility offers a diverse range of culinary experiences, including diabetes diets and accommodation for special dietary restrictions. Residents indulge in restaurant-style dining, relishing carefully prepared meals served with care and attention, enriching their overall dining experience and quality of life.

Quality ratings

Measured by Centers for Medicare & Medicaid Services (CMS)

Overall rating Info The Overall CMS Rating combines results from health inspections, staffing levels and quality measures. Health inspections carry the most weight. Staffing and quality scores can increase or decrease the final rating based on performance compared to state and national standards.
▼ 4.7% Below CA avg. ▼ 4.7% Below CA avg.CA average: 3.1Click the badge to see the full State ranking.Click here to see the full State ranking.
Health Inspection Info Based on the results of the facility's three most recent standard inspections and any complaint investigations. CMS reviews the number, scope, and severity of deficiencies, with more recent findings weighted more heavily.
▼ 28.5% Below CA avg. ▼ 28.5% Below CA avg.CA average: 2.8Click the badge to see the full State ranking.Click here to see the full State ranking.
Staffing Info Measures average nursing staff hours per resident per day, including Registered Nurses (RNs) and total nursing staff. Ratings are adjusted based on the level of care residents require and are compared to state and national benchmarks.
▲ 27.5% Above CA avg. ▲ 27.5% Above CA avg.CA average: 3.1Click the badge to see the full State ranking.Click here to see the full State ranking.
Quality Measures Info Based on clinical and physical health indicators reported to CMS, such as hospital readmissions, falls, pressure ulcers, and improvements in mobility. These measures reflect how well residents' health needs are being managed.
▲ 22.4% Above CA avg. ▲ 22.4% Above CA avg.CA average: 4.1Click the badge to see the full State ranking.Click here to see the full State ranking.

Staffing hours breakdown

Info Daily nursing hours per resident by staff type, reported to CMS. Higher is generally better — compare this facility to state and national averages to see where staffing stands.

Hours per resident per day — compared to California state averages

Total nursing care / resident Info This home is ranked 245th out of 354 homes in California for nurse hours. Total adjusted nursing hours per resident per day, combining RN, LPN, and aide time. CMS adjusts this for case-mix so facilities can be fairly compared.
3h 40m per day
Rank #245 / 354Nurse hours — State benchmarkedThis home is ranked 245th out of 354 homes in California. Shows adjusted nurse hours per resident per day benchmarked to the California average, with a ranking across 354 California facilities. More hours mean more direct care. The national average is about 3.5 hrs; below 3.0 is a red flag.Rankings are based only on facilities in California that report data for that category. Facilities without available data are excluded from the ranking.Click the rank badge to see the full State ranking.Click here to see the full State ranking.
This facility California avg (4h 13m per day)
vs California avg
-13%

4 of 6 metrics below state avg

Standout metric Physical Therapist is +149% above state avg
Staff typeHours / Day / Residentvs state avg
Registered Nurse (RN) Info RNs hold the highest nursing license and can assess residents, interpret test results, and direct care plans. More RN hours per day often signals stronger clinical oversight and faster response to health changes. 35m per day ▼ 10% State avg: 39m per day · National avg: 41m per day
LPN / LVN Info Licensed Practical Nurses (LPNs) or Licensed Vocational Nurses (LVNs) deliver routine hands-on care — medication administration, wound dressing, and monitoring vital signs. They work under RN supervision and make up a large share of daily bedside care. 1h 12m per day ■ Avg State avg: 1h 13m per day · National avg: 52m per day
Nurse Aide Info Certified Nurse Aides (CNAs) provide the most direct day-to-day assistance: bathing, dressing, feeding, and mobility. Nurse aide hours are typically the largest staffing category and directly affect residents' quality of life. 2h 19m per day ▼ 13% State avg: 2h 39m per day · National avg: 2h 21m per day
Weekend Total Nursing Info Combined nursing hours (RN + LPN + Nurse Aide) per resident per day on weekends. Staffing often drops on weekends — this figure reveals whether the facility maintains adequate coverage outside of weekday hours. 3h 40m per day ▼ 10% State avg: 4h 5m per day · National avg: 3h 26m per day
Physical Therapist Info Hours per resident per day provided by licensed Physical Therapists (PTs) or PT Assistants. PT services help residents recover mobility after injury or illness and are especially important for post-acute (short-stay) rehabilitation. 12m per day ▲ 149% State avg: 5m per day · National avg: 4m per day
Weekend RN Info Registered nurse hours specifically on weekends. Facilities sometimes reduce RN presence on Saturdays and Sundays — a low weekend RN figure compared to weekday hours can indicate reduced clinical oversight when most administrative staff are absent. 25m per day ▼ 15% State avg: 30m per day · National avg: 29m per day

Capacity and availability

Smaller home

May offer a more intimate, personalized care environment.

Total beds 68

This home usually has limited availability

Higher occupancy than the California average: 84.7%
Occupancy rate
87.2% Rank #404 / 1537Occupancy rate — State benchmarkedThis home is ranked 404th out of 1537 homes in California. Shows this facility's occupancy rate versus the California average, with its Statewide rank out of 1537. Higher occupancy signals strong local demand and financial stability.Rankings are based only on facilities in California that report data for that category. Facilities without available data are excluded from the ranking.Click the rank badge to see the full State ranking.Click here to see the full State ranking.
Avg. Length of Stay
54 days
Walk Score
Walk Score: 80 / 100 Rank #417 / 2092Walk Score — State benchmarkedThis home is ranked 417th out of 2092 homes in California. Shows how walkable this facility's neighborhood is compared to the average Walk Score across California facilities. Higher scores benefit residents, families, and staff.Rankings are based only on facilities in California that report data for that category. Facilities without available data are excluded from the ranking.Click the rank badge to see the full State ranking.Click here to see the full State ranking.
Very walkable. Most errands can be accomplished on foot, and many essentials are within a short walk.

Amenities & Lifestyle

Public Safety Officers
Clean Team
Seasonal Beautification
Community Events
Specific ProgramsPublic Safety, Area Maintenance, Streetscape and Beautification, Marketing and Promotion
Touring HoursMonday-Sunday: 8am-8pm

Contact Lincoln Square

Penalties and fines

Federal penalties imposed by CMS for regulatory violations, including civil money penalties (fines) and denials of payment for new Medicare/Medicaid admissions.

Source: CMS Penalties Database

No penalties in the past 3 years

No civil money penalties or payment denials were reported in the last 3 years.

Quality of care over time

These measures show how residents usually do over time at this home, based on health outcomes and preventive care.

Long-stay resident measures
Significantly above average California avg: 4.2 Info CMS star rating based on long-stay quality measure performance. 5 stars = significantly above average, 1 star = significantly below average.
Hospitalizations per 1,000 days Info Number of hospitalizations per 1,000 long-stay resident days. 2.61
16% worse than California average

California average: 2.25

ED visits per 1,000 days Info Number of outpatient emergency department visits per 1,000 long-stay resident days. 1.70
7% worse than California average

California average: 1.59

Short-stay resident measures
Significantly above average California avg: 3.5 Info CMS star rating based on short-stay quality measure performance. 5 stars = much above average, 1 star = much below average.
Re-hospitalized after SNF stay Info Percentage of short-stay residents who were re-hospitalized after their nursing home admission. 20.9%
10% better than California average

California average: 23.2%

Emergency department visits Info Percentage of short-stay residents who had an outpatient emergency department visit. 11.7%
In line with California average

California average: 11.2%

Falls with major injury Info Percentage of SNF residents who experience falls with major injury during their stay. 1.1%
43% worse than California average

California average: 0.8%

Ability to care for self at discharge Info Percentage of residents at or above expected ability to care for themselves at discharge. 74.4%
38% better than California average

California average: 53.7%

Successful return to home or community Info Rate of successful return to home or community from a skilled nursing facility. 66.7%
32% better than California average

California average: 50.6%

Breakdown by payment type

Medicare

42% of new residents, usually for short-term rehab.

Typical stay 1 - 2 months

Private pay

40% of new residents, often for short stays.

Typical stay 1 months

Medicaid

18% of new residents, often for long-term daily care.

Typical stay 4 - 5 months

Finances and operations

Based on CMS SNF Cost Report for fiscal year ending in 12/2023.

Voluntary non-profit community
Operated by a church.
Net patient revenue Info Net patient revenue — what the home actually collects for resident care, after contractual allowances, bad debt and discounts are subtracted from its gross charges (CMS cost report, Worksheet G-3). It covers resident care only; money the home earns from other sources is shown separately as "Other income."
$12.3M
Net patient income Info Net patient income: net patient revenue minus the home's total operating expenses. A positive figure means it earns more from resident care than it spends to deliver it; a negative figure means the opposite. It excludes non-operating "other income."
$1.4M
Voluntary non-profit community Operated by a church.
Net patient revenue Info Net patient revenue — what the home actually collects for resident care, after contractual allowances, bad debt and discounts are subtracted from its gross charges (CMS cost report, Worksheet G-3). It covers resident care only; money the home earns from other sources is shown separately as "Other income."
$12.3M Rank #191 / 355Revenue — State benchmarkedThis home is ranked 191st out of 355 homes in California. Shows this facility's annual revenue compared to the California average. Higher revenue generally means more resources for staffing and capital — read alongside Payroll %.Rankings are based only on facilities in California that report data for that category. Facilities without available data are excluded from the ranking.Click the rank badge to see the full State ranking.Click here to see the full State ranking.
Net patient income Info Net patient income: net patient revenue minus the home's total operating expenses. A positive figure means it earns more from resident care than it spends to deliver it; a negative figure means the opposite. It excludes non-operating "other income."
$1.4M
Other income Info Money the home earns outside of resident care — such as investments, grants, rentals and other non-operating sources (CMS cost report, Worksheet G-3). It is tracked separately from net patient revenue: it is not part of that figure, and it is not included in net patient income.
$40.4K
Payroll costs Info Staff salaries plus wage-related costs — benefits such as payroll taxes, health insurance and retirement — from the home's own accounting records (CMS cost report, Worksheet A). Contract or agency labor is counted separately, under other operating costs. Rank #244 / 355Payroll — State benchmarkedThis home is ranked 244th out of 355 homes in California. Shows total annual staff payroll benchmarked to the California average. Higher payroll investment relative to peers often signals better staffing and less reliance on cheaper contract labor.Rankings are based only on facilities in California that report data for that category. Facilities without available data are excluded from the ranking.Click the rank badge to see the full State ranking.Click here to see the full State ranking.
$6.5M 52.9% of net patient revenue Info Payroll as a share of revenue: staff salaries and wage-related benefits divided by net patient revenue. A higher figure means more of each revenue dollar goes to staff pay. Rank #271 / 355Payroll % — State benchmarkedThis home is ranked 271st out of 355 homes in California. Shows payroll as a percentage of revenue versus the California average. Well-run California facilities typically land around 56–67% — the top third Statewide. Below 25% may signal understaffing or heavy agency use — read with Staffing ratings.Rankings are based only on facilities in California that report data for that category. Facilities without available data are excluded from the ranking.Click the rank badge to see the full State ranking.Click here to see the full State ranking.
Other operating costs Info Everything it costs to run the home apart from payroll — food, utilities, supplies, maintenance, contract labor and administration. Calculated as total operating expense minus payroll (staff salaries and wage-related benefits).
$4.4M
Total costs Info The home's total operating expense for the year — all the costs of running it, salaries included (CMS cost report, Worksheet G-3).
$10.9M

Who this home usually serves

TYPE OF STAY

Mostly short-term rehab stays

Most residents typically stay for a few weeks or months before returning home or moving on.

New residents most often arrive under Medicare (42% of admissions), and a typical Medicare stay runs around 1 - 2 months.

Admissions
416 total

Coverage residents most often arrive under.

Medicare 42%
Private pay 40%
Medicaid 18%
Discharges
403 total

Coverage residents most often leave under.

Medicare 43%
Private pay 39%
Medicaid 18%

Places of interest near Lincoln Square

Address 0.8 miles from city center Info Estimated distance in miles from Stockton's city center to Lincoln Square's address, calculated via Google Maps.

Calculate Travel Distance to Lincoln Square

Add your location

Address

Compare Nursing Homes around Stockton

The information below is reported by the California Department of Social Services and Department of Public Health.

4 facilities compared · CMS & CA Dept. of Health data

O‘Connor Woods
NH
AL
IL
MC
RC
Stockton (Sherwood Manor)
499
Facility 499
CA AVG 103
Rank #23 / 1657
--
4.69
Facility 4.69
CA AVG 4.22
Rank #69 / 354
+42%+11%
$0
Facility $0
CA AVG $56.5k
Rank #1 / 362
94
Facility 94
CA AVG 81
Rank #185 / 1401
44
Facility 44
CA AVG 50.2
Rank #196 / 361
4.0
Facility 4.0
CA AVG 4.6
Rank #169 / 361
-67-
22
Facility 22
CA AVG 57
Rank #1826 / 2092
O'connor Woods Housing Corp
$34.5M
Facility $34.5M
CA AVG $17.0M
Rank #26 / 355
$15.8M
Facility $15.8M
CA AVG $7.0M
Rank #18 / 355
45.7%
Facility 45.7%
CA AVG 45.2%
Rank #229 / 355
555713
Riverwood Healthcare Center
NH
HC
MC
RC
Stockton (Valley Oak)
99
Facility 99
CA AVG 103
Rank #725 / 1657
90.5%
Facility 90.5%
CA AVG 84.7%
Rank #308 / 1537
+7%
4.23
Facility 4.23
CA AVG 4.22
Rank #138 / 354
-10%0%
$52.9k
Facility $52.9k
CA AVG $56.5k
Rank #315 / 362
-
31
Facility 31
CA AVG 50.2
Rank #118 / 361
3.9
Facility 3.9
CA AVG 4.6
Rank #161 / 361
190-
63
Facility 63
CA AVG 57
Rank #951 / 2092
Martin Gittleman
$15.4M
Facility $15.4M
CA AVG $17.0M
Rank #200 / 355
$7.6M
Facility $7.6M
CA AVG $7.0M
Rank #153 / 355
49.2%
Facility 49.2%
CA AVG 45.2%
Rank #84 / 355
555496
Stockton Nursing Center
NH
Stockton (Pacific)
119
Facility 119
CA AVG 103
Rank #597 / 1657
88.2%
Facility 88.2%
CA AVG 84.7%
Rank #372 / 1537
+4%
4.57
Facility 4.57
CA AVG 4.22
Rank #80 / 354
-20%+8%
$83.7k
Facility $83.7k
CA AVG $56.5k
Rank #336 / 362
-
110
Facility 110
CA AVG 50.2
Rank #348 / 361
2.5
Facility 2.5
CA AVG 4.6
Rank #33 / 361
2113-
71
Facility 71
CA AVG 57
Rank #702 / 2092
Stockton Nursing And Rehab Center, LLC
$13.6M
Facility $13.6M
CA AVG $17.0M
Rank #231 / 355
$8.2M
Facility $8.2M
CA AVG $7.0M
Rank #172 / 355
60.5%
Facility 60.5%
CA AVG 45.2%
Rank #44 / 355
55201
Noble Care Center
NH
MC
RC
Stockton (Pacific)
99
Facility 99
CA AVG 103
Rank #725 / 1657
91.9%
Facility 91.9%
CA AVG 84.7%
Rank #269 / 1537
+9%
3.72
Facility 3.72
CA AVG 4.22
Rank #245 / 354
-17%-12%
$0
Facility $0
CA AVG $56.5k
Rank #1 / 362
-
91
Facility 91
CA AVG 50.2
Rank #329 / 361
3.5
Facility 3.5
CA AVG 4.6
Rank #115 / 361
-96A+
55
Facility 55
CA AVG 57
Rank #1215 / 2092
-
$17.7M
Facility $17.7M
CA AVG $17.0M
Rank #252 / 355
$5.7M
Facility $5.7M
CA AVG $7.0M
Rank #270 / 355
32.2%
Facility 32.2%
CA AVG 45.2%
Rank #211 / 355
555105

Financial Assistance for
Nursing Home in California

Lincoln Square is located in Stockton, California.
Here are the financial assistance programs available to residents in California.

Get Financial aid guidance

Multipurpose Senior Services Program

MSSP (Medi-Cal Waiver)

Age 65+
General California resident, Medi-Cal eligible, nursing home risk.
Income Limits (2025) ~$2,829/month 300% FBR, individual
Asset Limits $2,000 (individual), $3,000 (couple).
CA

County-managed; waitlists possible.

Benefits
In-home support (4-6 hours/day) Respite care (14 days/year) Meals (~$6/meal) Transportation (8 trips/month) Care management

In-Home Supportive Services (IHSS)

California IHSS

Age 65+
General California resident, Medicaid-eligible or low-income.
Income Limits ~$1,732/month individual, Medi-Cal threshold
Asset Limits $2,000 individual
CA

Can hire family as caregivers.

Benefits
Personal care (up to 283 hours/month) Homemaker services Respite (varies)

Multipurpose Senior Services Program (MSSP)

CA MSSP

Age 65+
General California resident, Medi-Cal-eligible, nursing home-eligible but community-capable.
Income Limits ~$2,829/month 300% FBR, individual
Asset Limits $2,000 individual
CA

Available in 38 counties; waitlists common.

Benefits
Case management Respite care (up to 10 days/year) Minor home mods (avg. $500) Adult day care (~$50/day)

Property Tax Postponement Program (PTP)

CA PTP

Age 62+
General California resident, own and live in home, 40% equity.
Income Limits (2025) ~$51,500/year household, adjusted annually
Asset Limits Equity-based; no strict asset cap.
CA

Deferred taxes accrue interest (5% as of 2024); repaid upon sale/death.

Benefits
Property tax deferral (avg. $1,000-$3,000/year, varies by county)

Assisted Living Waiver (ALW)

CA ALW

Age 65+ or disabled
General California resident, Medi-Cal-eligible, nursing home-eligible.
Income Limits ~$2,829/month 300% FBR, individual
Asset Limits $2,000 individual
CA

Available in 15 counties (e.g., LA, Sacramento); waitlists common.

Benefits
Personal care in ALFs (5-7 hours/day) Medication management Social services

California CARES Program

CA CARES

Age
General Caregivers of California residents 60+ needing help with 3+ daily activities; no caregiver age limit.
Income Limits No strict limit; cost-sharing above ~$2,500/month threshold.
Asset Limits Not applicable; need-based.
CA

High demand in urban areas; complements IHSS respite.

Benefits
Respite care (up to 10 days/year) Counseling (4-6 sessions/year) Training (2-3 workshops/year) Supplies (~$200/year)

Frequently Asked Questions about Lincoln Square

What neighborhood is Lincoln Square in?

Lincoln Square is in the Civic Center neighborhood.

Is Lincoln Square in a walkable area?

Lincoln Square has a walk score of 80. Very walkable. Most errands can be accomplished on foot, and many essentials are within a short walk.

What is the occupancy rate at Lincoln Square?

Lincoln Square's occupancy is 87.2%.

Are there photos of Lincoln Square?

Yes — there are 5 photos of Lincoln Square in the photo gallery on this page.

What is the address of Lincoln Square?

Lincoln Square is located at 1032 N Lincoln St, Stockton, CA 95203.

What is the phone number of Lincoln Square?

(209) 466-5341 will put you in contact with the team at Lincoln Square.

Is Lincoln Square Medicare or Medicaid certified?

Lincoln Square is not currently listed as a CMS-certified provider of Medicare or Medicaid.

Guides for Better Senior Living

Care Cost Calculator: See Prices in Your Area

Nursing Home Data Explorer

Don’t Wait Too Long: 7 Red Flag Signs Your Parent Needs Assisted Living Now

The True Cost of Assisted Living in 2025 – And How Families Are Paying For It

Understanding Senior Living Costs: Pricing Models, Discounts & Financial Assistance