Nursing Home

Creekside Village Health and Rehabilitation Center

Nursing Home

Creekside Village Health and Rehabilitation Center

1000 E. Stuart St, Fort Collins, CO 80525 View map
Overview of Creekside Village Health and Rehabilitation Center

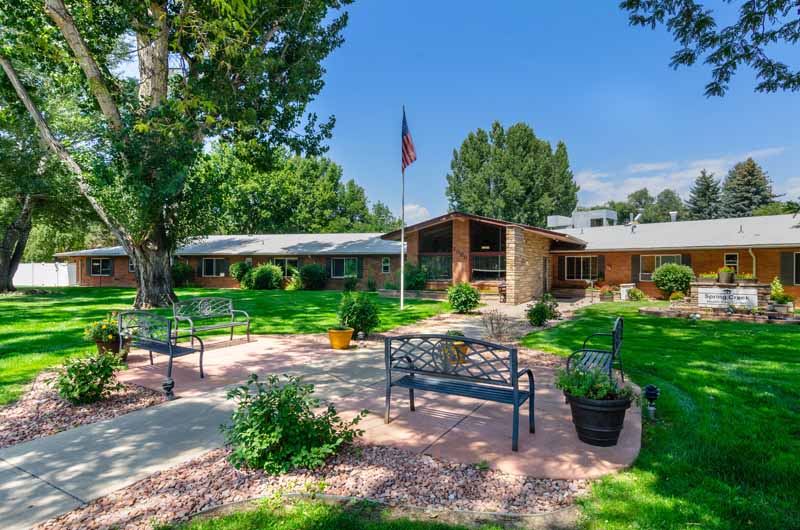
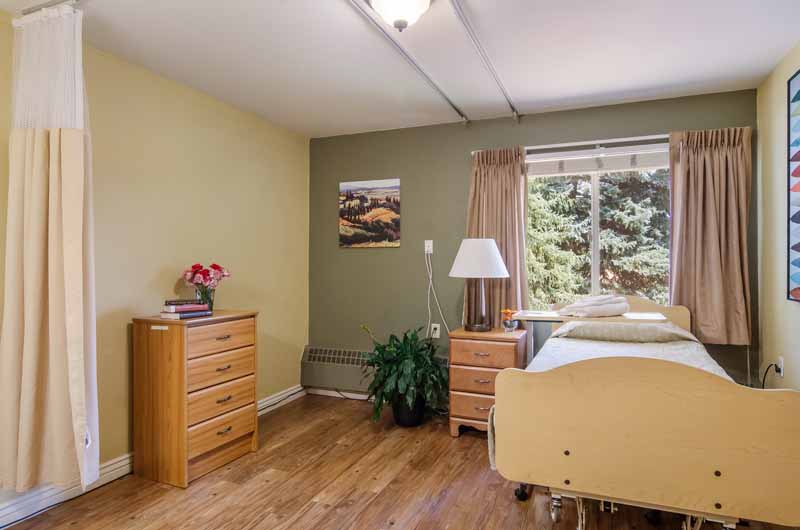
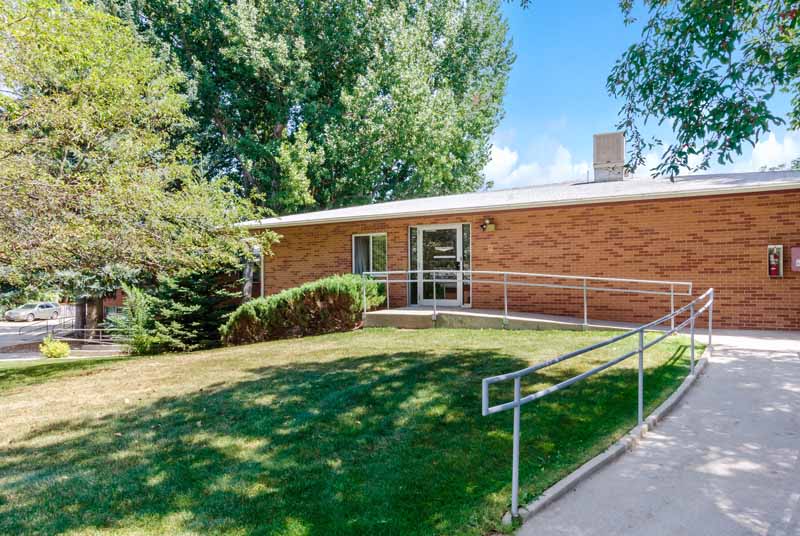
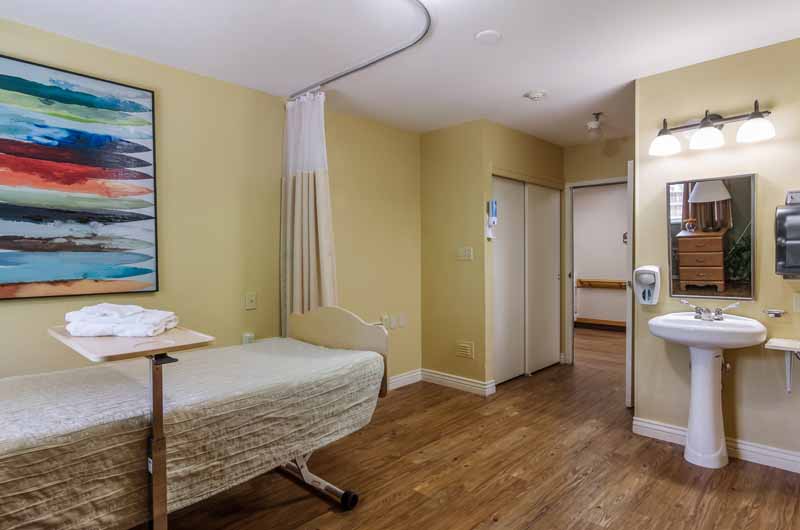
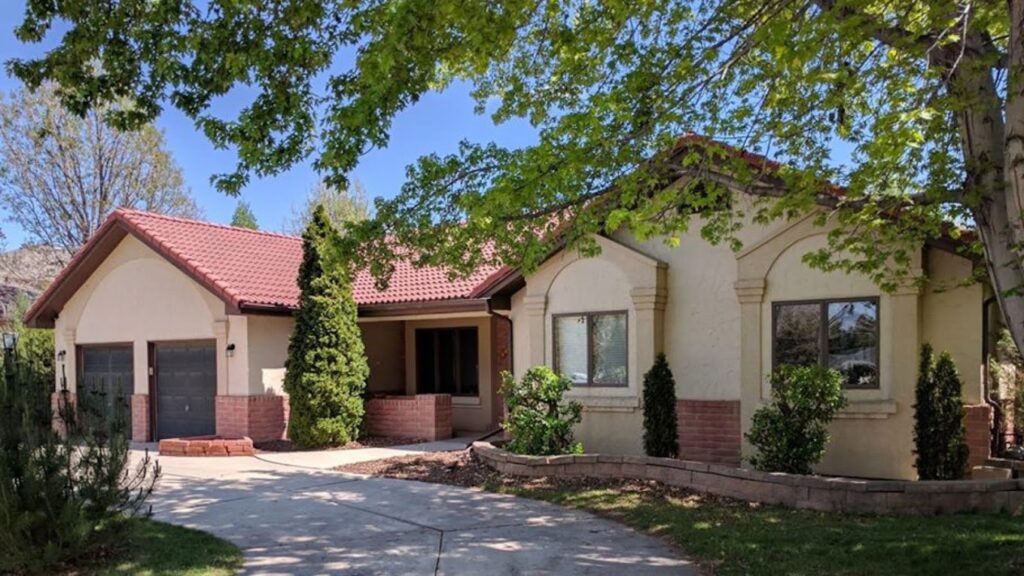
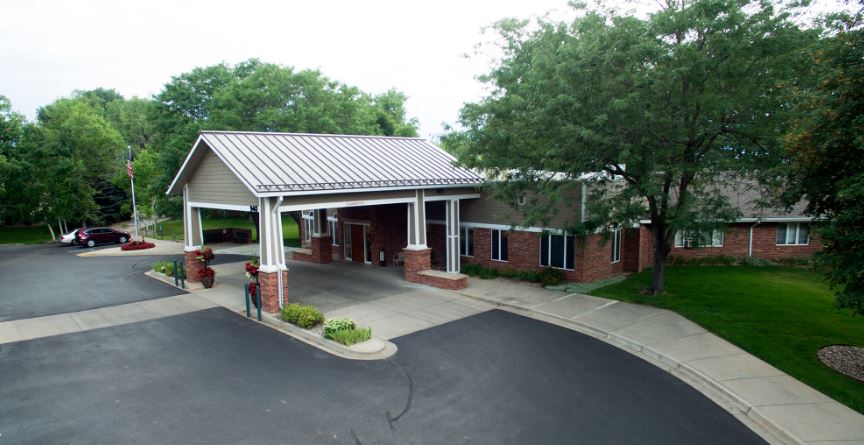
Live a blissful retirement at Creekside Village Health and Rehabilitation Center, an outstanding community in Fort Collins, CO, offering skilled nursing and rehabilitation. Residents receive top-notch care tailored to their unique needs from a compassionate and well-trained team available 24/7. Purposely built and secure accommodations are provided in a nurturing and welcoming environment, ensuring older adults feel at ease during their stay.

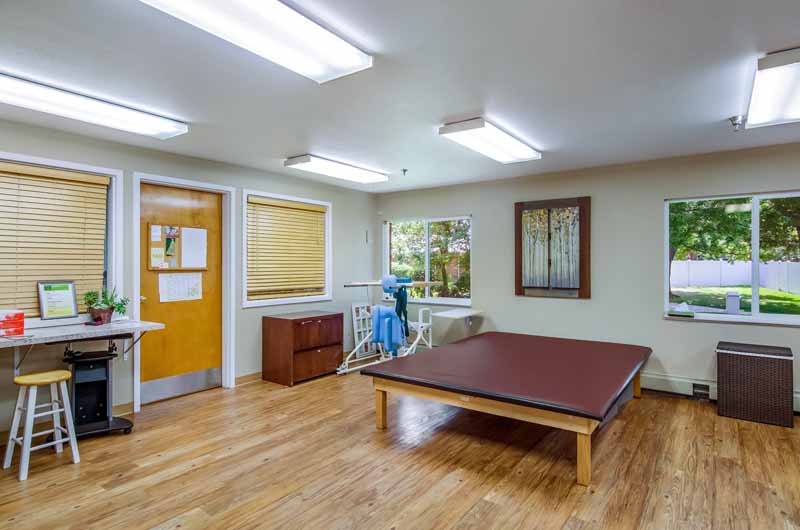
The community participates in Medicare and Medicaid to ease financial burdens. With therapy services, including physical, occupational, and speech therapy, the community strives to enhance residents’ living experiences. With exceptional care and extensive amenities, residents are guaranteed the finest retirement experience.

(970) 482-5712

Quality ratings

Measured by Centers for Medicare & Medicaid Services (CMS)

Overall rating Info Official CMS rating based on health inspections, staffing and quality measures.
1/5
Colorado average: 3.1/5
Health Inspection Info Official CMS rating based on deficiencies found during state health inspections.
1/5
Colorado average: 2.8/5
Staffing Info Official CMS rating based on nurse staffing hours per resident per day.
1/5
Colorado average: 3.0/5
Quality Measures Info Official CMS rating based on clinical outcomes for residents.
4/5
Colorado average: 4.1/5

Nursing care per resident

Info Average daily nursing hours per resident (adjusted for acuity). Higher values indicate more nursing time per resident.
2h 38m per day

This home provides 32% less nursing time per resident than the Colorado average.

Colorado average: 3h 52m per day

Staffing hours breakdown

Info Hours of care per resident per day, broken down by staff type. Data from CMS Medicare.
Staff type Facility State avg National avg
Registered Nurse (RN) Info Registered nurse hours per resident per day. 38m per day 36m per day 29m per day

Capacity and availability

Medium-capacity home

Offers a balance of services and community atmosphere.

Total beds 120

This home usually has availability

Lower occupancy suggests more openings may be available.

Lower demand than the Colorado average
Occupancy rate 57.9%
Residents per day (avg) 71
Occupancy rate
57.9%
Residents per day (avg)
71

Who this home usually serves

TYPE OF STAY

Mostly long-term care residents

Most residents stay for extended periods and receive ongoing daily care.

Might be optimal for
Long-term daily care Ongoing support needs

Breakdown by payment type

Medicare

21% of new residents, usually for short-term rehab.

Typical stay 2 - 3 months

Private pay

45% of new residents, often for short stays.

Typical stay 1 - 2 months

Medicaid

34% of new residents, often for long-term daily care.

Typical stay 5 years

Finances and operations

Privately-owned community
Operated by a business corporation.
Home revenue
$11.2M
Operating loss
-$3.8M
Privately-owned community Operated by a business corporation.
Home revenue
$11,160,562.00
Operating loss
$-3,778,107.00
Payroll costs Info The portion of the home's budget spent on staff, including nurses, caregivers, and other employees who support care and operations.
$2.2M
19.8% of revenue
Other operating costs Info All remaining costs needed to run the home, such as food, utilities, building maintenance, supplies and administrative expenses.
$12.7M
Total costs $14.9M

What does this home offer?

Accepts Medicaid icon

Accept Medicaid: Yes

Housing options icon

Housing Options: Studio / Semi-Private Rooms

Building type icon
Building type icon

Building Type: Single-story
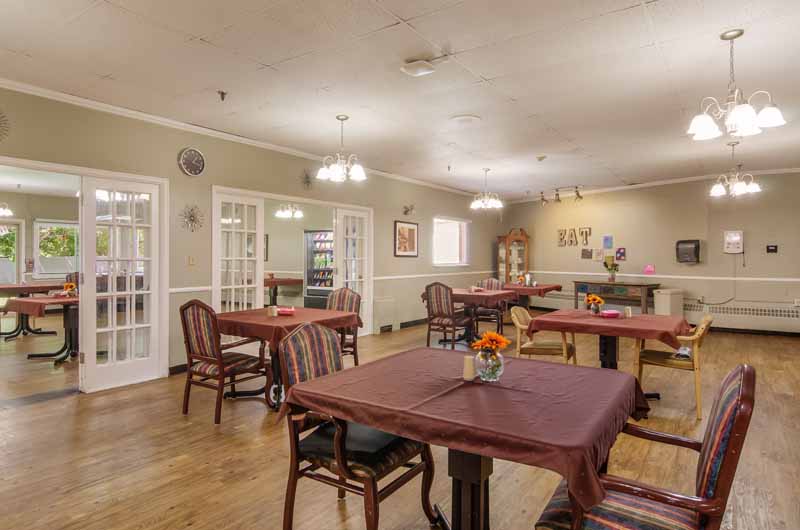
Dining services icon

Dining Services

Social and recreational activities icon

Social and Recreational Activities

On-site medical care and health services icon

On-site Medical Care and Health Services

Types of Care at Creekside Village Health and Rehabilitation Center

Nursing Home Assisted Living
Contact Creekside Village Health and Rehabilitation Center

Health Inspection History

Inspections
Total health inspections 12

Colorado average 4.8


Last Health inspection on Sep 2025

Total health citations 40
Citations per inspection
3.33

Health citations are formal notices following inspections when they fail to comply with safety and care standards.

24 of 40 citations resulted from standard inspections; 15 of 40 resulted from complaint investigations; and 1 of 40 came from combined inspections (standard and complaint).

Breakdown of citation severity (last 3 years)
Critical Health citations More info 0
100% better than Colorado average

Colorado average: 0.4


Serious Health citations More info 6
186% worse than Colorado average

Colorado average: 2.1

0 critical citations More info Colorado average: 0.4

6 serious citations More info Colorado average: 2.1

34 moderate citations More info Colorado average: 22.2

0 minor citations More info Colorado average: 0.2
Citations history (last 3 years)
Abuse/Neglect moderate citation Sep 04, 2025
Corrected

Nutrition moderate citation Sep 04, 2025
Corrected

Abuse/Neglect moderate citation Jul 08, 2025
Corrected

Pharmacy serious citation Jul 08, 2025
Corrected

Compare Assisted Living around Larimer County

The information below is reported by the Colorado Department of Public Health and Environment, Health Facilities Division.
Centre Avenue Health and Rehab Facility
SNF

Nursing Home 24/7 care needed

AL

Assisted Living For seniors needing help with daily tasks but not full-time nursing.

Fort Collins
90
A+
73
-
88.9%
$16,759,746.00
$6,629,342.00
39.6%
81.50
5/5
4.3266
5/5
4/5
5/5
1
5
2
+12%
+12%
+16%
Studio / Semi-Private Rooms
Good Samaritan Society – Fort Collins Village
SNF

Nursing Home 24/7 care needed

AL

Assisted Living For seniors needing help with daily tasks but not full-time nursing.

Fort Collins
92
A+
16
BERMINGHAM, ROGER
62.4%
$8,529,930.00
$3,888,336.00
45.6%
55.70
4/5
3.9645
4/5
4/5
3/5
-
5
-
+50%
+3%
-18%
Studio / Semi-Private Rooms
Columbine West Health and Rehab Facility
SNF

Nursing Home 24/7 care needed

AL

Assisted Living For seniors needing help with daily tasks but not full-time nursing.

Fort Collins (Prospect/Shields)
100
A+
72
-
89.4%
$12,585,186.00
$6,400,310.00
50.9%
88.60
2/5
5.2531
1/5
5/5
5/5
2
17
2
-29%
+36%
+17%
Studio / Semi-Private Rooms
Creekside Village Health and Rehabilitation Center
AL

Assisted Living For seniors needing help with daily tasks but not full-time nursing.

SNF

Nursing Homes 24/7 care needed

Fort Collins (Prospect at Spring Meadows)
120
-
73
-
57.9%
$11,056,451.00
$2,212,155.00
20%
71.30
1/5
2.6251
1/5
1/5
4/5
4
40
6
+1%
-32%
-24%
Studio / Semi-Private Rooms
Seneca House Assisted Living
AL

Assisted Living For seniors needing help with daily tasks but not full-time nursing.

Fort Collins
14
-
36
-
-
-
-
-
-
-
-
-
-
-
-
-
-
-
-
-
Private / Shared Rooms

Places of interest near Creekside Village Health and Rehabilitation Center

Address 2.8 miles from city center

Address 1000 E. Stuart St, Fort Collins, CO 80525

Calculate Travel Distance to Creekside Village Health and Rehabilitation Center

Add your location

Address

Staffing Data

Source: CMS Payroll-Based Journal (Q2 2025)

95
Total Staff
79
Employees
16
Contractors
21,884
Total Hours (Quarter)
27
Avg Staff/Day
8.9
Avg Shift (hrs)
Nursing Staff Breakdown
Role Count Avg Shift (hrs) Uses Contractors?
Registered Nurse 13 9.8 No
Licensed Practical Nurse 3 13 No
Certified Nursing Assistant 53 9.2 No
Staff by Category
Administration
4 staff
7.6hs shift avg
Nursing Staff
72 staff
9.5hs shift avg
Physicians & Practitioners
1 staff
7.4hs shift avg
Therapy Services
10 staff
7.2hs shift avg
Activities & Recreation
0 staff
0hs shift avg
Social Services
1 staff
7.7hs shift avg
Dietary Services
3 staff
8.2hs shift avg
Other Services
4 staff
7.8hs shift avg
Contractor Analysis
10.3%
of total hours from contractors
2,249 contractor hours this quarter
Physical Therapy Assistant: 3 Speech Language Pathologist: 2 Qualified Social Worker: 1 Mental Health Service Worker: 3 Respiratory Therapy Technician: 3 Occupational Therapy Aide: 1 Dietitian: 1 Occupational Therapy Assistant: 1 Medical Director: 1
Role Employees Contractors Total Staff Total Hours Days Worked % of Days Avg Shift (hrs)
Certified Nursing Assistant 53 0 53 9,454 91 100% 9.2
Registered Nurse 13 0 13 4,873 91 100% 9.8
Administrator 3 0 3 1,137 68 75% 7.7
Other Dietary Services Staff 2 0 2 962 89 98% 8.2
Physical Therapy Assistant 0 3 3 855 72 79% 9.1
Medication Aide/Technician 1 0 1 746 65 71% 11.5
Licensed Practical Nurse 3 0 3 701 48 53% 13
Nurse Practitioner 1 0 1 520 70 77% 7.4
Qualified Social Worker 0 1 1 511 66 73% 7.7
Mental Health Service Worker 1 3 4 458 55 60% 7.8
Nurse Aide in Training 1 0 1 408 41 45% 10
RN Director of Nursing 1 0 1 395 56 62% 7.1
Respiratory Therapy Technician 0 3 3 387 51 56% 7.3
Speech Language Pathologist 0 2 2 352 61 67% 5.8
Occupational Therapy Aide 0 1 1 110 24 26% 4.6
Dietitian 0 1 1 9 2 2% 4.5
Medical Director 0 1 1 4 1 1% 4
Occupational Therapy Assistant 0 1 1 3 3 3% 1

Facility Characteristics

Source: CMS Long-Term Care Facility Characteristics (Data as of Jan 2026)

Total census
58 residents
Residents by payment source
Medicare
1 resident (1.7%)
Medicaid
55 residents (94.8%)
Private pay or other
2 residents (3.4%)
Programs & Services
Residents' Group

Residents meet regularly to discuss policies, care quality, and activities

Active Resident Council

Organized group of residents that meets regularly to discuss facility policies, quality of life, and activities.

Quality of care over time

These measures show how residents usually do over time at this home, based on health outcomes and preventive care.

High-risk clinical events score Info A composite score based on pressure ulcers, falls with injury, weight loss, walking ability decline, and activities of daily living decline. 7.2
20% better than Colorado average

Colorado average: 9.0

Functional decline score Info A composite score based on activities of daily living decline, walking ability decline, and incontinence. 13.7
27% better than Colorado average

Colorado average: 18.8

Long-stay resident measures
Above average Colorado avg: 3.8 Info CMS star rating based on long-stay quality measure performance. 5 stars = significantly above average, 1 star = significantly below average.
Need for Help with Daily Activities Increased Info Percent of long-stay residents whose need for help with daily activities has increased 11.2%
30% better than Colorado average

Colorado average: 16.0%

Walking Ability Worsened Info Percent of long-stay residents whose ability to move independently worsened 14.8%
13% better than Colorado average

Colorado average: 17.0%

Low Risk Residents with Bowel/Bladder Incontinence Info Percent of low risk long-stay residents who lose control of their bowels or bladder 15.1%
35% better than Colorado average

Colorado average: 23.2%

Falls with Major Injury Info Percent of long-stay residents experiencing one or more falls with major injury 2.5%
26% better than Colorado average

Colorado average: 3.3%

High Risk Residents with Pressure Ulcers Info Percent of long-stay high risk residents with pressure ulcers 2.7%
31% better than Colorado average

Colorado average: 3.9%

Urinary Tract Infection Info Percent of long-stay residents with a urinary tract infection 0.0%
100% better than Colorado average

Colorado average: 1.4%

Lost Too Much Weight Info Percent of long-stay residents who lose too much weight 5.0%
In line with Colorado average

Colorado average: 5.2%

Depressive Symptoms Info Percent of long-stay residents who have depressive symptoms 22.8%
217% worse than Colorado average

Colorado average: 7.2%

Antipsychotic Use Info Percent of long-stay residents who received an antipsychotic medication 23.6%
26% worse than Colorado average

Colorado average: 18.8%

Pneumococcal Vaccine Info Percent of long-stay residents assessed and appropriately given the pneumococcal vaccine 92.2%
In line with Colorado average

Colorado average: 93.3%

Influenza Vaccine Info Percent of long-stay residents assessed and appropriately given the seasonal influenza vaccine 97.1%
In line with Colorado average

Colorado average: 94.7%

Hospitalizations per 1,000 days Info Number of hospitalizations per 1,000 long-stay resident days. 2.21
70% worse than Colorado average

Colorado average: 1.30

ED visits per 1,000 days Info Number of outpatient emergency department visits per 1,000 long-stay resident days. 3.01
80% worse than Colorado average

Colorado average: 1.67

Short-stay resident measures
Pneumococcal Vaccine Info Percent of short-stay residents assessed and appropriately given the pneumococcal vaccine 70.2%
8% worse than Colorado average

Colorado average: 76.6%

Antipsychotic medication increase Info Percent of short-stay residents who newly received an antipsychotic medication 6.3%
344% worse than Colorado average

Colorado average: 1.4%

Influenza Vaccine Info Percent of short-stay residents assessed and appropriately given the seasonal influenza vaccine 59.4%
21% worse than Colorado average

Colorado average: 75.6%

Penalties and fines

Federal penalties imposed by CMS for regulatory violations, including civil money penalties (fines) and denials of payment for new Medicare/Medicaid admissions.

Source: CMS Penalties Database (Data as of Jan 2026)

Total fines amount $61K
54% higher than Colorado average

Colorado average: $40K

Number of fines 5
125% more fines than Colorado average

Colorado average: 2.2

Payment Denials Info Serious action where Medicare and/or Medicaid temporarily stops payments for new residents until issues are fixed. 0
100% fewer payment denials than Colorado average

Colorado average: 0.3

Fines amount comparison
This facility $61K
Colorado average $40K
Penalty History

Penalties are imposed by CMS for violations of federal nursing home regulations.

Civil Money Penalty Info Fines imposed for noncompliance, which can be assessed per day or per instance of violation. Jul 8, 2025
$14K
Civil Money Penalty Info Fines imposed for noncompliance, which can be assessed per day or per instance of violation. Dec 19, 2023
$8K
Civil Money Penalty Info Fines imposed for noncompliance, which can be assessed per day or per instance of violation. Nov 6, 2023
$3K
Civil Money Penalty Info Fines imposed for noncompliance, which can be assessed per day or per instance of violation. Oct 17, 2023
$7K

Last updated: Jan 2026

Guides for Better Senior Living

Care Cost Calculator: See Prices in Your Area

Nursing Home Data Explorer

Don’t Wait Too Long: 7 Red Flag Signs Your Parent Needs Assisted Living Now

The True Cost of Assisted Living in 2025 – And How Families Are Paying For It

Understanding Senior Living Costs: Pricing Models, Discounts & Financial Assistance

Financial Aid for Colorado Seniors

Get financial aid guidance

Elderly, Blind, and Disabled Waiver

Colorado Medicaid EBD Waiver

Age 65+ or disabled, Colorado resident, Medicaid- eligible, nursing home-level care need.

~$2,829/month (300% FBR, individual).

$2,000 (individual), $3,000 (couple).

Requires level-of-care assessment by case manager.

Old Age Pension (OAP) Health Care Program

Colorado OAP

Age 60+, Colorado resident.

~$1,215/month (individual).

$2,000 (individual).

Supplements SSI; limited medical coverage.

Program of All-Inclusive Care for the Elderly (PACE)

Colorado Medicaid PACE

Age 55+, Colorado resident, nursing home-level care need, safe with PACE support.

~$2,829/month (300% FBR).

$2,000 (individual), $3,000 (couple).

Limited to specific regions (e.g., Denver, Pueblo).

Home Care Allowance (HCA)

Colorado Home Care Allowance (HCA)

Seniors typically 65+, Age 5+ with disability, Colorado resident, financial/functional need.

~$1,004/month (individual, stricter than waivers).

$2,000 (individual), $3,000 (couple).

Must need help with ADLs; not Medicaid-waiver eligible.

Senior Community Service Employment Program (SCSEP)

Colorado SCSEP (federally funded, state-administered)

Age 55+, unemployed, low-income, Colorado resident.

~$1,983/month (125% FPL, individual).

Not specified; income-focused.

Priority for veterans, rural residents.