Crestpark DeWitt, LLC
CMS overall rating Info CMS (the Centers for Medicare & Medicaid Services) is the federal agency that rates nursing home quality. Its Overall Rating runs from 1 to 5 stars, combining health inspections, staffing, and quality measures, with inspections weighted most heavily.

Crestpark DeWitt, LLC

CMS overall rating Info CMS (the Centers for Medicare & Medicaid Services) is the federal agency that rates nursing home quality. Its Overall Rating runs from 1 to 5 stars, combining health inspections, staffing, and quality measures, with inspections weighted most heavily.
Calculator: See prices in your area
Crestpark DeWitt, LLC accepts Medicare, Medicaid, and private pay.

Overview of Crestpark Dewitt, LLC

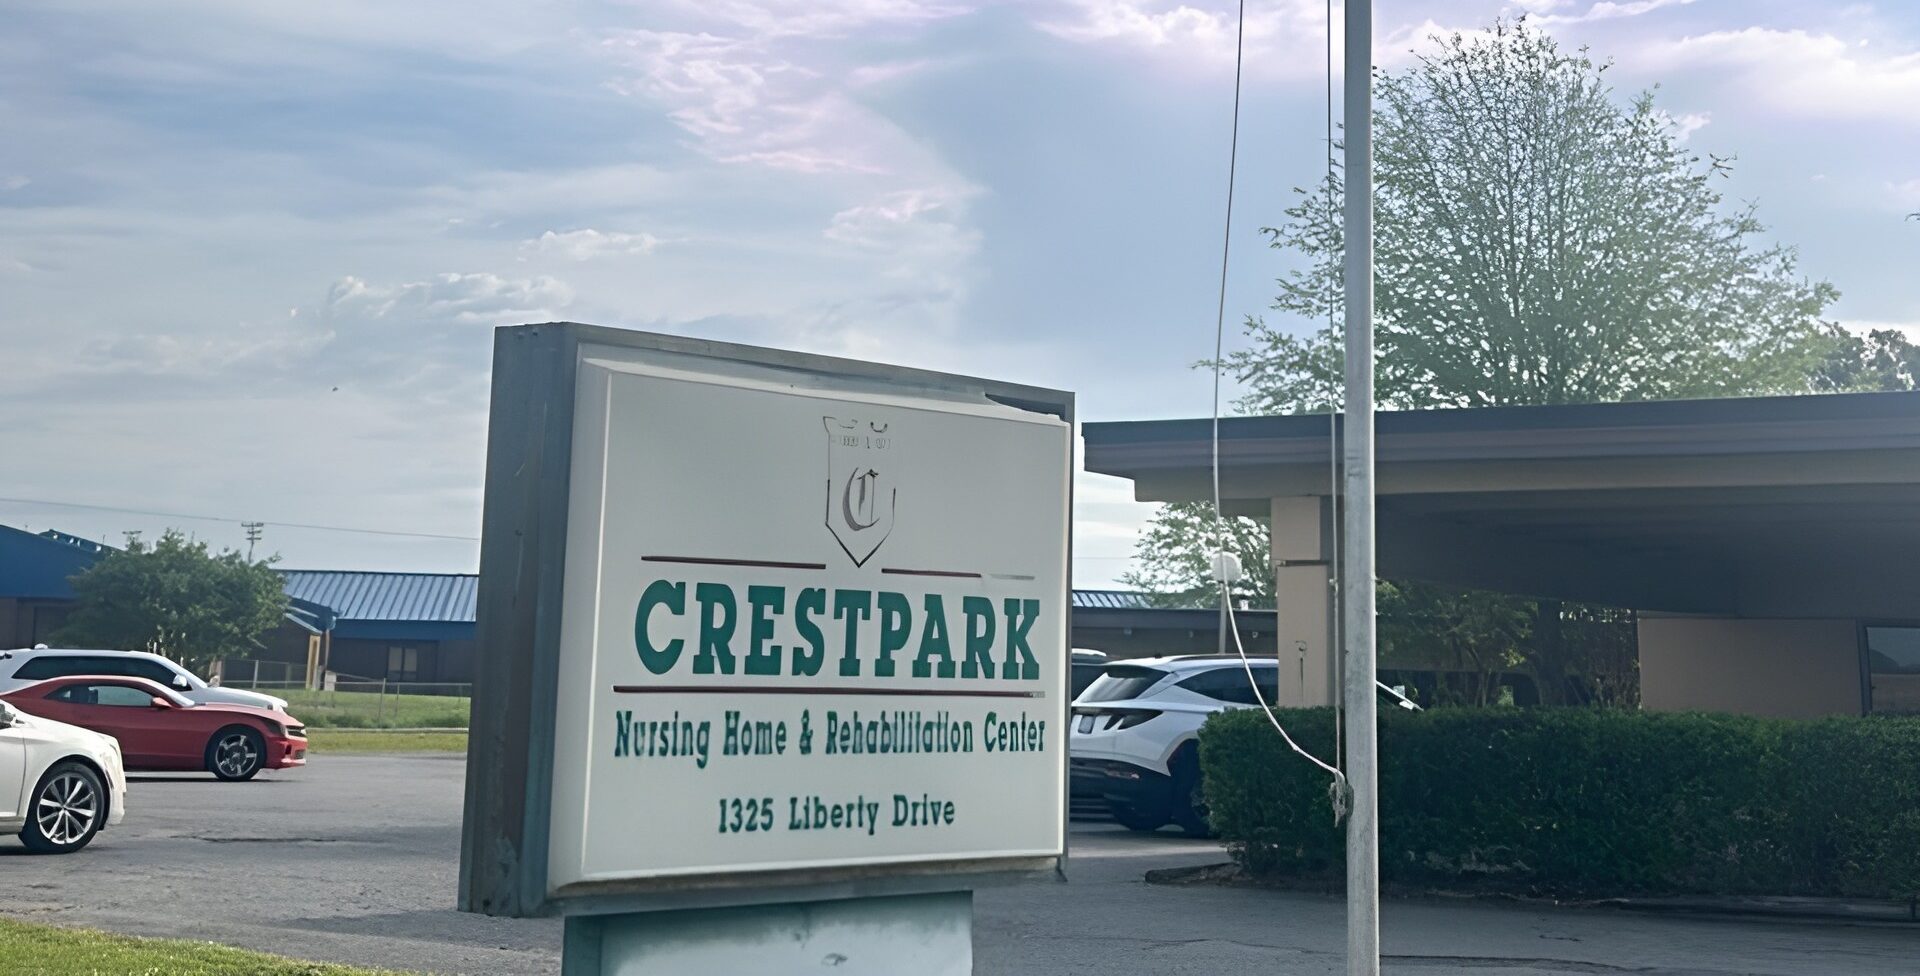
Experience top-notch care in Crestpark DeWitt LLC, a distinct community in DeWitt, AR, offering long-term care. A compassionate and well-trained team provides the highest quality of care tailored to residents’ unique needs around the clock. The community also accepts Medicare and Medicaid to ease financial burdens.

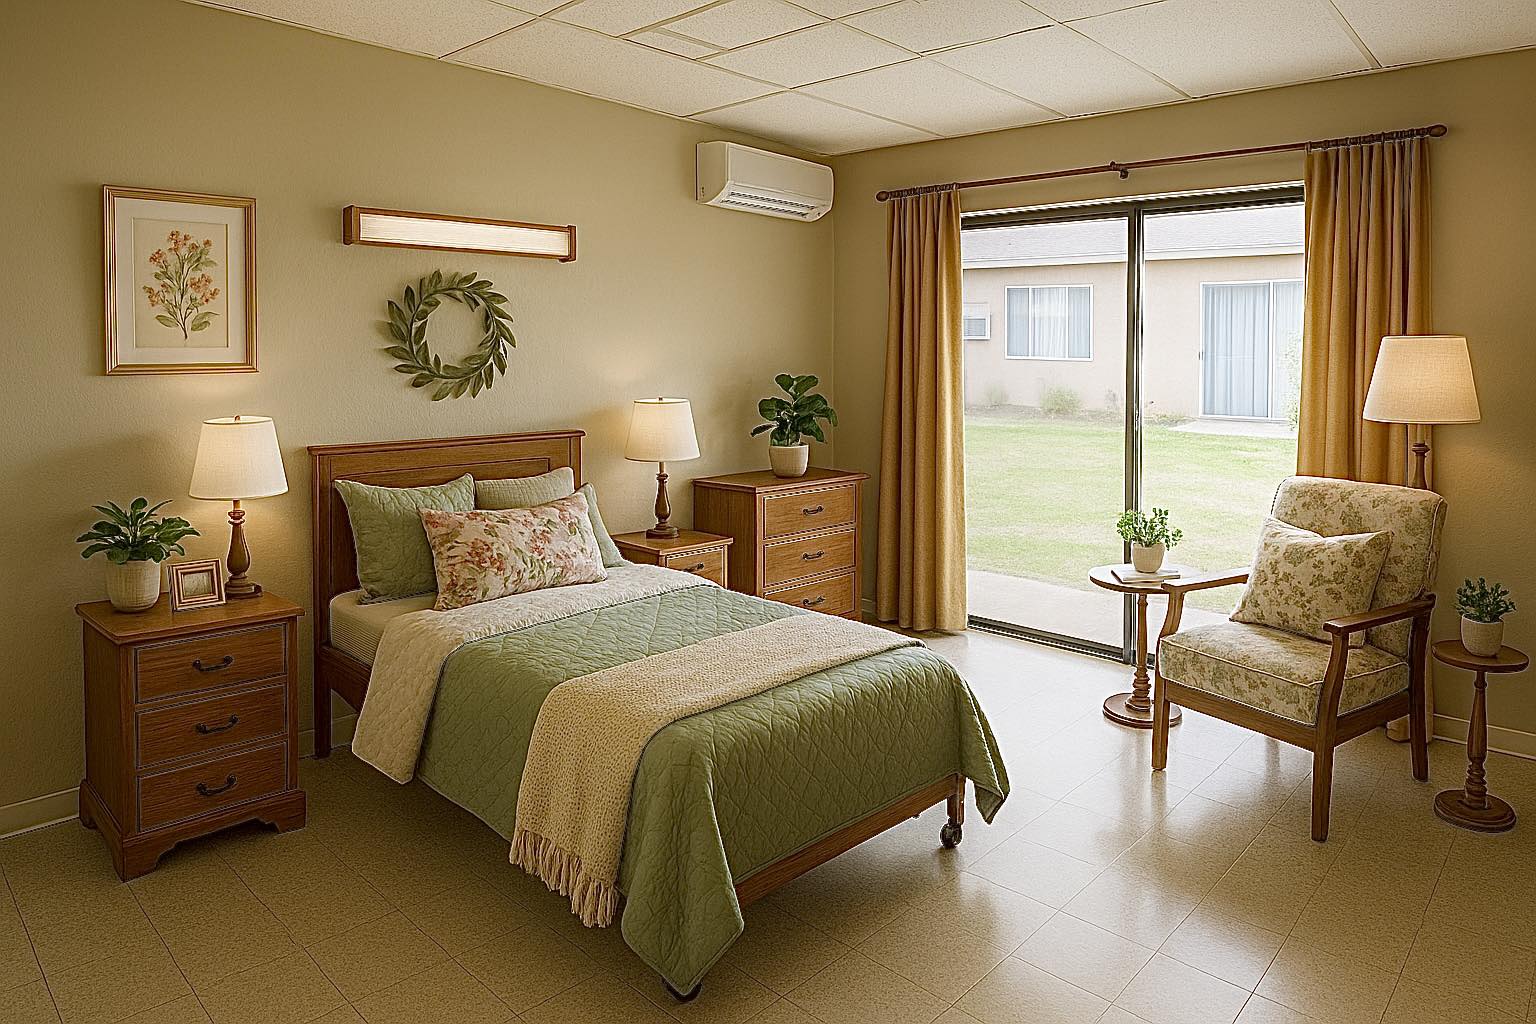
Aside from their healthcare needs, residents’ recreation and wellness are also taken care of with a jam-packed calendar of engaging activities and enriching programs. Healthy meals are important for residents’ wellness, so delicious and well-balanced dining options are also served to satisfy their dietary needs and preferences. With its comprehensive care options and state-of-the-art amenities, residents can keep their peace of mind and live a worry-free retirement.

Quality ratings

Measured by Centers for Medicare & Medicaid Services (CMS)

Overall rating Info The Overall CMS Rating combines results from health inspections, staffing levels and quality measures. Health inspections carry the most weight. Staffing and quality scores can increase or decrease the final rating based on performance compared to state and national standards.
Health Inspection Info Based on the results of the facility's three most recent standard inspections and any complaint investigations. CMS reviews the number, scope, and severity of deficiencies, with more recent findings weighted more heavily.
Staffing Info Measures average nursing staff hours per resident per day, including Registered Nurses (RNs) and total nursing staff. Ratings are adjusted based on the level of care residents require and are compared to state and national benchmarks.
Quality Measures Info Based on clinical and physical health indicators reported to CMS, such as hospital readmissions, falls, pressure ulcers, and improvements in mobility. These measures reflect how well residents' health needs are being managed.

Staffing hours breakdown

Info Daily nursing hours per resident by staff type, reported to CMS. Higher is generally better — compare this facility to state and national averages to see where staffing stands.

Hours per resident per day — compared to state averages

Total nursing care / resident Info Total adjusted nursing hours per resident per day, combining RN, LPN, and aide time. CMS adjusts this for case-mix so facilities can be fairly compared.
6h 5m per day
vs avg

0 of 5 metrics below state avg

Standout metric Nurse Aide is +33% above state avg
Staff type Hours / Day / Resident vs state avg
Registered Nurse (RN) Info RNs hold the highest nursing license and can assess residents, interpret test results, and direct care plans. More RN hours per day often signals stronger clinical oversight and faster response to health changes. 30m per day ▲ 25% State avg: 24m per day · National avg: 41m per day
LPN / LVN Info Licensed Practical Nurses (LPNs) or Licensed Vocational Nurses (LVNs) deliver routine hands-on care — medication administration, wound dressing, and monitoring vital signs. They work under RN supervision and make up a large share of daily bedside care. 1h 3m per day ▲ 11% State avg: 57m per day · National avg: 52m per day
Nurse Aide Info Certified Nurse Aides (CNAs) provide the most direct day-to-day assistance: bathing, dressing, feeding, and mobility. Nurse aide hours are typically the largest staffing category and directly affect residents' quality of life. 3h 38m per day ▲ 33% State avg: 2h 44m per day · National avg: 2h 21m per day
Weekend Total Nursing Info Combined nursing hours (RN + LPN + Nurse Aide) per resident per day on weekends. Staffing often drops on weekends — this figure reveals whether the facility maintains adequate coverage outside of weekday hours. 4h 34m per day ▲ 31% State avg: 3h 29m per day · National avg: 3h 26m per day
Weekend RN Info Registered nurse hours specifically on weekends. Facilities sometimes reduce RN presence on Saturdays and Sundays — a low weekend RN figure compared to weekday hours can indicate reduced clinical oversight when most administrative staff are absent. 16m per day ■ Avg State avg: 16m per day · National avg: 29m per day

Capacity and availability

Avg. Length of Stay
377 days
Bed community size
96-bed community Rank #147 / 330Bed count — State benchmarkedThis home is ranked 147th out of 330 homes in Arkansas. Shows this facility's certified or reported bed count compared to other Arkansas facilities. Larger communities may offer more amenities, programs, and on-site services for residents and families.Rankings are based only on facilities in Arkansas that report data for that category. Facilities without available data are excluded from the ranking.Click the rank badge to see the full State ranking.Click here to see the full State ranking.
A larger shared setting that may offer more common spaces and organized community services.
Walk Score
Walk Score: 7 / 100 Rank #354 / 419Walk Score — State benchmarkedThis home is ranked 354th out of 419 homes in Arkansas. Shows how walkable this facility's neighborhood is compared to the average Walk Score across Arkansas facilities. Higher scores benefit residents, families, and staff.Rankings are based only on facilities in Arkansas that report data for that category. Facilities without available data are excluded from the ranking.Click the rank badge to see the full State ranking.Click here to see the full State ranking.
Car-dependent. Most errands require a car, with limited nearby walkable options.

About this community

Occupancy

Occupancy rate
58%
Lower than the Arkansas average: 71.3%
Occupied beds
55 / 96
Average occupied beds in Arkansas homes 77 beds

License Details

Facility TypeSkilled Nursing Facility With Dual Certified Beds (medicaid / Medicare)
CountyArkansas
Business TypeLimited Liability Company
Certification TypeMedicaid / Medicare

Ownership & Operating Entity

Crestpark DeWitt, LLC is legally operated by Crestpark DeWitt, LLC, and administered by Wanda Lynn O.

Type Of Units

Medicaid and Medicare
96 units
Total beds
96 units

Contact Information

Fax870-946-3425

Contact Crestpark DeWitt, LLC

Inspection History

In Arkansas, the Department of Human Services, Office of Long Term Care is authorized to conduct unannounced inspections and issue official quality of care reports for all senior living providers.

Since 2022 · 4 years of data 48 deficiencies

Inspection Scorecard Info This scorecard compares key inspection, deficiency, and complaint metrics at this facility against the Arkansas state average. Metrics rated ≥15% worse than average are highlighted in red; those ≥15% better are highlighted in green.

Since 2022 vs. Arkansas state average
Overall vs. AR average 2 Worse Metrics worse than Arkansas average:
• Total deficiencies (129% above)
• Deficiencies per year (126% above)
0 Better No metrics in this bucket.
Latest Inspection October 3, 2024 Routine

Deficiencies Info Deficiencies are formal regulatory issues recorded during state inspections.

This Facility AR Average vs. AR Avg
Total deficiencies Info Formal regulatory issues recorded by inspectors across all inspection types. 48 21 This facility has 129% more total deficiencies than a typical Arkansas assisted living residence (48 vs. AR avg 21).↑ 129% worse
Deficiencies per year Info Average deficiencies per year since 2022. 12 5.3 This facility has 126% more deficiencies per year than a typical Arkansas assisted living residence (12 vs. AR avg 5.3).↑ 126% worse

Inspection Reports Summary Info An editor-reviewed summary of the themes and findings across this facility's recent inspection reports.

  • October 3, 2024 inspection found 14 deficiencies including medication errors, unsecured hazardous chemicals, incomplete PASARR screening, and failure to provide pneumonia vaccines to some residents.
  • October 19, 2023 annual inspection cited 6 deficiencies including inadequate RN staffing, unsafe food handling, malfunctioning dishwasher, and unclean resident rooms with pest droppings.
  • No complaints were substantiated in the record, and no immediate jeopardy or fines were issued during the inspections.

Health Inspection History

Inspections since 2022
Total health inspections 3

State average N/A


Last Health inspection on Oct 2024

Total health citations
29

State average N/A

Citations per inspection
9.67

State average N/A


Health citations are formal notices following inspections when they fail to comply with safety and care standards.

All 29 citations resulted from standard inspections.

Breakdown of citation severity (last 4 years)
Critical health citations
0
In line with State average

State average: N/A


Serious health citations
0
In line with State average

State average: N/A

0 critical citations State average: N/A

0 serious citations State average: N/A

29 moderate citations State average: N/A

0 minor citations State average: N/A
Citations history (last 4 years)
Administration moderate citation Oct 03, 2024
Corrected

Infection Control moderate citation Oct 03, 2024
Corrected

Infection Control moderate citation Oct 03, 2024
Corrected

Nutrition moderate citation Oct 03, 2024
Corrected

Staffing Data

Reporting period: July 1 – September 30, 2025 (Q3 2025). Source: CMS Payroll-Based Journal report.

Total staff 62
Employees 52
Contractors 10
Staff to resident ratio 1.72 : 1
0% compared with State average

State average ratio: 0 : 0

Avg staff/day 22
Average shift 7.8 hours
0% compared with State average

State average: 0 hours

Total staff hours (quarter) 15,841

Nursing staff breakdown

Q3 2025 · Jul 1 – Sep 30 More info This data comes from the CMS Payroll-Based Journal report covering July 1 – September 30, 2025.
Registered Nurse

Manages medical care and health needs.

RN Staff Info All 4 RN Staff are full-time employees. No contractors work on this role. 4
Average shift length Info Average shift length. Calculated as total hours divided by days worked and average staff per day. 8.5 hours
Licensed Practical Nurse

Assists with medical care and medications.

LPN Staff Info All 9 LPN Staff are full-time employees. No contractors work on this role. 9
Average shift length Info Average shift length. Calculated as total hours divided by days worked and average staff per day. 9.8 hours
Certified Nursing Assistant

Helps with daily care and mobility.

CNA Staff Info All 34 CNA Staff are full-time employees. No contractors work on this role. 34
Average shift length Info Average shift length. Calculated as total hours divided by days worked and average staff per day. 7.7 hours

Contractor staffing

Q3 2025 · Jul 1 – Sep 30 More info This data comes from the CMS Payroll-Based Journal report covering July 1 – September 30, 2025.

Total hours from contractors

1.6%

254 contractor hours this quarter

Qualified Social Worker: 2 Other Physician: 2 Physical Therapy Assistant: 1 Occupational Therapy Assistant: 1 Speech Language Pathologist: 1 Medical Director: 1 Respiratory Therapy Technician: 1 Occupational Therapy Aide: 1

Staff by category

Q3 2025 · Jul 1 – Sep 30 More info This data comes from the CMS Payroll-Based Journal report covering July 1 – September 30, 2025.
Certified Nursing Assistant 34 0 34 10,213 92 100% 7.7
Licensed Practical Nurse 9 0 9 2,985 92 100% 9.8
Registered Nurse 4 0 4 739 57 62% 8.5
Nurse Practitioner 1 0 1 672 84 91% 8
Administrator 2 0 2 528 66 72% 8
Dietitian 1 0 1 314 44 48% 7.1
Medication Aide/Technician 1 0 1 136 19 21% 7.2
Physical Therapy Assistant 0 1 1 97 44 48% 2.2
Speech Language Pathologist 0 1 1 82 48 52% 1.7
Occupational Therapy Assistant 0 1 1 24 3 3% 8
Occupational Therapy Aide 0 1 1 24 3 3% 8
Other Physician 0 2 2 12 6 7% 2
Medical Director 0 1 1 8 2 2% 4
Respiratory Therapy Technician 0 1 1 4 4 4% 1
Qualified Social Worker 0 2 2 4 3 3% 1.2
34 Certified Nursing Assistant
% of Days 100%
9 Licensed Practical Nurse
% of Days 100%
4 Registered Nurse
% of Days 62%
1 Nurse Practitioner
% of Days 91%
2 Administrator
% of Days 72%
1 Dietitian
% of Days 48%
1 Medication Aide/Technician
% of Days 21%
1 Physical Therapy Assistant
% of Days 48%
1 Speech Language Pathologist
% of Days 52%
1 Occupational Therapy Assistant
% of Days 3%
1 Occupational Therapy Aide
% of Days 3%
2 Other Physician
% of Days 7%
1 Medical Director
% of Days 2%
1 Respiratory Therapy Technician
% of Days 4%
2 Qualified Social Worker
% of Days 3%

Penalties and fines

Includes penalties issued in 2023

Federal penalties imposed by CMS for regulatory violations, including civil money penalties (fines) and denials of payment for new Medicare/Medicaid admissions.

Source: CMS Penalties Database (Data as of Jan 2026)

Total fines amount $9K
63% lower than State average

State average: $26K

Number of fines 2
36% more fines than State average

State average: 1.5

Payment Denials Info Serious action where Medicare and/or Medicaid temporarily stops payments for new residents until issues are fixed. 0
100% fewer payment denials than State average

State average: 0.2

Fines amount comparison
This facility $9K
State average $26K
Penalty History

Penalties are imposed by CMS for violations of federal nursing home regulations.

2 penalties in the past 3 years

Multiple penalties were reported in the last 3 years.

Civil Money Penalty Info Fines imposed for noncompliance, which can be assessed per day or per instance of violation. Dec 11, 2023
$6K
Civil Money Penalty Info Fines imposed for noncompliance, which can be assessed per day or per instance of violation. Oct 17, 2023
$3K

Last updated: Jan 2026

Quality of care over time

These measures show how residents usually do over time at this home, based on health outcomes and preventive care.

High-risk clinical events score Info A composite score based on pressure ulcers, falls with injury, weight loss, walking ability decline, and activities of daily living decline. 11.8
53% worse than State average

State average: 7.7

Functional decline score Info A composite score based on activities of daily living decline, walking ability decline, and incontinence. 14.8
11% worse than State average

State average: 13.3

Long-stay resident measures
Significantly below average State avg: 4.2 Info CMS star rating based on long-stay quality measure performance. 5 stars = significantly above average, 1 star = significantly below average.
Need for Help with Daily Activities Increased Info Percent of long-stay residents whose need for help with daily activities has increased 21.9%
90% worse than State average

State average: 11.5%

Walking Ability Worsened Info Percent of long-stay residents whose ability to move independently worsened 16.0%
20% worse than State average

State average: 13.4%

Low Risk Residents with Bowel/Bladder Incontinence Info Percent of low risk long-stay residents who lose control of their bowels or bladder 6.4%
57% better than State average

State average: 15.1%

Falls with Major Injury Info Percent of long-stay residents experiencing one or more falls with major injury 8.2%
109% worse than State average

State average: 3.9%

High Risk Residents with Pressure Ulcers Info Percent of long-stay high risk residents with pressure ulcers 5.0%
5% worse than State average

State average: 4.7%

Urinary Tract Infection Info Percent of long-stay residents with a urinary tract infection 21.8%
1593% worse than State average

State average: 1.3%

Lost Too Much Weight Info Percent of long-stay residents who lose too much weight 7.9%
57% worse than State average

State average: 5.0%

Depressive Symptoms Info Percent of long-stay residents who have depressive symptoms 9.8%
536% worse than State average

State average: 1.5%

Antipsychotic Use Info Percent of long-stay residents who received an antipsychotic medication 22.1%
111% worse than State average

State average: 10.5%

Pneumococcal Vaccine Info Percent of long-stay residents assessed and appropriately given the pneumococcal vaccine 100.0%
6% better than State average

State average: 94.4%

Influenza Vaccine Info Percent of long-stay residents assessed and appropriately given the seasonal influenza vaccine 100.0%
In line with State average

State average: 96.2%

Hospitalizations per 1,000 days Info Number of hospitalizations per 1,000 long-stay resident days. 3.93
99% worse than State average

State average: 1.97

ED visits per 1,000 days Info Number of outpatient emergency department visits per 1,000 long-stay resident days. 4.66
114% worse than State average

State average: 2.18

Short-stay resident measures
Pneumococcal Vaccine Info Percent of short-stay residents assessed and appropriately given the pneumococcal vaccine 100.0%
24% better than State average

State average: 80.9%

Breakdown by payment type

Medicare

53% of new residents, usually for short-term rehab.

Typical stay 27 days

Private pay

34% of new residents, often for short stays.

Typical stay 11 - 12 months

Medicaid

13% of new residents, often for long-term daily care.

Typical stay 5 - 6 years

Facility Characteristics

Source: CMS Long-Term Care Facility Characteristics (Data as of Jan 2026)

Total residents 36
Medicare
2
5.6% of residents
Medicaid
24
66.7% of residents
Private pay or other
10
27.8% of residents
Programs & Services
Residents Group

Residents meet regularly to discuss policies, care quality, and activities

Active Resident Council

Organized group of residents that meets regularly to discuss facility policies, quality of life, and activities.

Finances and operations

Based on CMS SNF Cost Report for fiscal year ending in 12/2023.

For-profit
Operated by a single business entity.
Net patient revenue Info Net patient revenue — what the home actually collects for resident care, after contractual allowances, bad debt and discounts are subtracted from its gross charges (CMS cost report, Worksheet G-3). It covers resident care only; money the home earns from other sources is shown separately as "Other income."
$4.1M
Net patient income Info Net patient income: net patient revenue minus the home's total operating expenses. A positive figure means it earns more from resident care than it spends to deliver it; a negative figure means the opposite. It excludes non-operating "other income."
-$432.6K
For-profit Operated by a single business entity.
Net patient revenue Info Net patient revenue — what the home actually collects for resident care, after contractual allowances, bad debt and discounts are subtracted from its gross charges (CMS cost report, Worksheet G-3). It covers resident care only; money the home earns from other sources is shown separately as "Other income."
$4.1M
Net patient income Info Net patient income: net patient revenue minus the home's total operating expenses. A positive figure means it earns more from resident care than it spends to deliver it; a negative figure means the opposite. It excludes non-operating "other income."
-$432.6K
Other income Info Money the home earns outside of resident care — such as investments, grants, rentals and other non-operating sources (CMS cost report, Worksheet G-3). It is tracked separately from net patient revenue: it is not part of that figure, and it is not included in net patient income.
$120.3K
Payroll costs Info Staff salaries plus wage-related costs — benefits such as payroll taxes, health insurance and retirement — from the home's own accounting records (CMS cost report, Worksheet A). Contract or agency labor is counted separately, under other operating costs.
$2.2M 53.3% of net patient revenue Info Payroll as a share of revenue: staff salaries and wage-related benefits divided by net patient revenue. A higher figure means more of each revenue dollar goes to staff pay.
Other operating costs Info Everything it costs to run the home apart from payroll — food, utilities, supplies, maintenance, contract labor and administration. Calculated as total operating expense minus payroll (staff salaries and wage-related benefits).
$2.4M
Total costs Info The home's total operating expense for the year — all the costs of running it, salaries included (CMS cost report, Worksheet G-3).
$4.5M

What does this home offer?

Housing options icon

Housing Options: Private/ Semi-Private Rooms

Building type icon
Building type icon

Building Type: Single-story

Who this home usually serves

TYPE OF STAY

Mostly short-term rehab stays

Most residents typically stay for a few weeks or months before returning home or moving on.

Most new residents arrive under Medicare (53% of admissions), and a typical Medicare stay runs around 27 days.

Admissions
38 total

Coverage residents most often arrive under.

Medicare 53%
Private pay 34%
Medicaid 13%
Discharges
39 total

Coverage residents most often leave under.

Medicare 46%
Private pay 23%
Medicaid 31%

Places of interest near Crestpark DeWitt, LLC

Address 2.4 miles from city center Info Estimated distance in miles from Dewitt's city center to Crestpark DeWitt, LLC's address, calculated via Google Maps.

Calculate Travel Distance to Crestpark DeWitt, LLC

Add your location

Address

Compare Nursing Homes around the area

The information below is reported by the Arkansas Department of Human Services, Office of Long Term Care.

Crestpark DeWitt, LLC
NH
Dewitt - 96 - 7 Private/ Semi-Private Rooms
Butterfield Trail Village
NH
AL
IL
Fayetteville (East Joyce Boulevard) - 87 A+ 39 Studio / 1 Bed / 2 Bed
Barnes Healthcare
NH
MC
Lonoke - 141 A+ 38 Private / Shared Rooms
The Green House Cottages of Poplar Grove
NH
HC
MC
RC
Little Rock (Leander) - 120 A+ 31 Private Rooms / Semi-Private Rooms
Timberlane Health & Rehab
NH
MC
RC
El Dorado - 106 A+ 33 -

Frequently Asked Questions about Crestpark DeWitt, LLC

Is Crestpark DeWitt, LLC in a walkable area?

Crestpark DeWitt, LLC has a walk score of 7. Car-dependent. Most errands require a car, with limited nearby walkable options.

What is the occupancy rate at Crestpark DeWitt, LLC?

Crestpark DeWitt, LLC's occupancy is 58%.

Does Crestpark DeWitt, LLC operate as a for-profit or non-profit?

Crestpark DeWitt, LLC is registered as a for-profit in AR.

Who is the administrator of Crestpark DeWitt, LLC?

Wanda Lynn O is the administrator of Crestpark DeWitt, LLC.

How many beds does Crestpark DeWitt, LLC have?

Crestpark DeWitt, LLC has 96 beds.

Are there photos of Crestpark DeWitt, LLC?

Yes — there are 5 photos of Crestpark DeWitt, LLC in the photo gallery on this page.

What is the address of Crestpark DeWitt, LLC?

Crestpark DeWitt, LLC is located at 1325 Liberty Drive, Dewitt, AR 72042.

Guides for Better Senior Living

Care Cost Calculator: See Prices in Your Area

Nursing Home Data Explorer

Don’t Wait Too Long: 7 Red Flag Signs Your Parent Needs Assisted Living Now

The True Cost of Assisted Living in 2025 – And How Families Are Paying For It

Understanding Senior Living Costs: Pricing Models, Discounts & Financial Assistance