Crystal Pines Rehabilitation & Health Care Center
Nursing Home, Hospice Care & Memory Care · Crystal Lake, IL
CMS overall rating Info CMS (the Centers for Medicare & Medicaid Services) is the federal agency that rates nursing home quality. Its Overall Rating runs from 1 to 5 stars, combining health inspections, staffing, and quality measures, with inspections weighted most heavily.

Crystal Pines Rehabilitation & Health Care Center

Nursing Home, Hospice Care & Memory Care · Crystal Lake, IL
CMS overall rating Info CMS (the Centers for Medicare & Medicaid Services) is the federal agency that rates nursing home quality. Its Overall Rating runs from 1 to 5 stars, combining health inspections, staffing, and quality measures, with inspections weighted most heavily.
Calculator: See prices in your area
Crystal Pines Rehabilitation & Health Care Center accepts Medicare, Medicaid, and private pay.

Overview of Crystal Pines Rehabilitation & Health Care Center

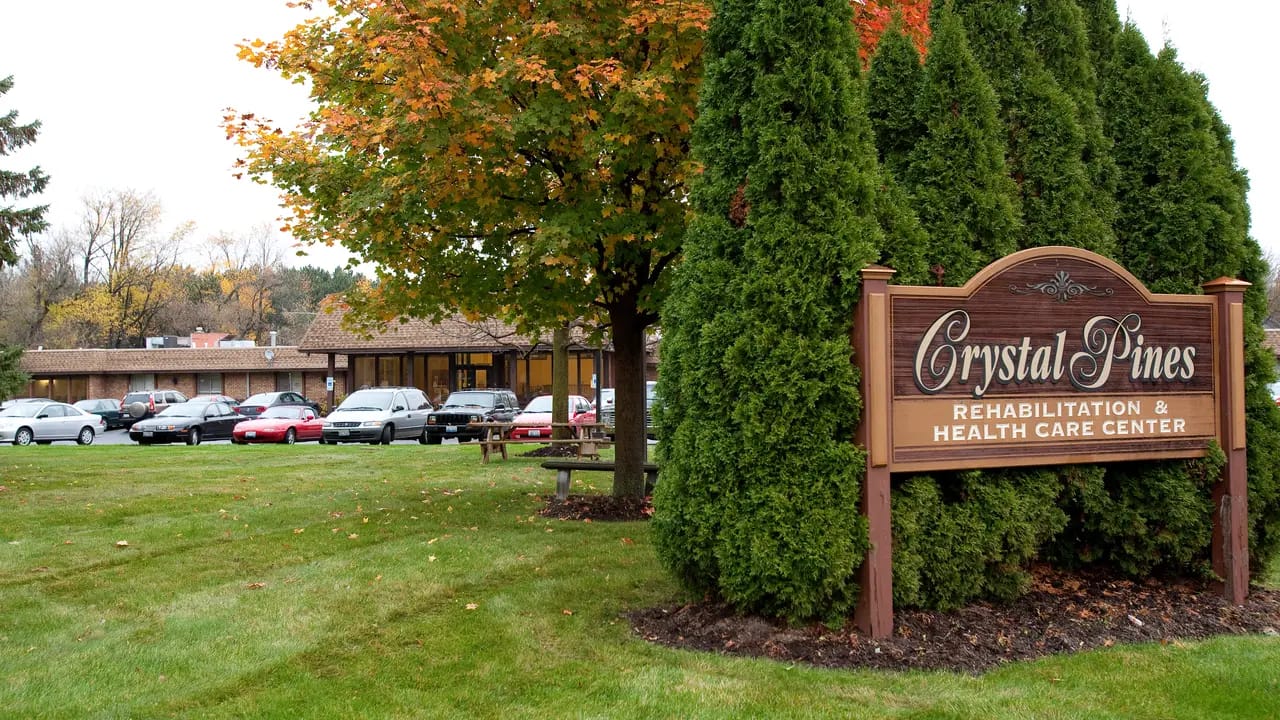
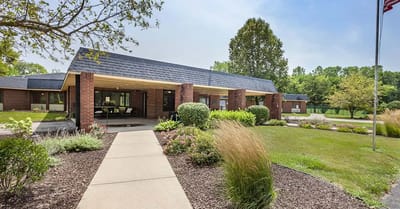
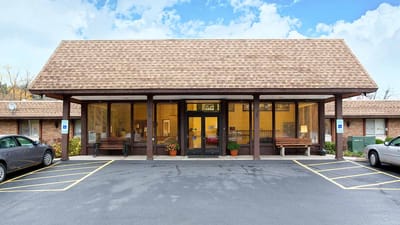
Crystal Pines Rehabilitation & Health Care Center is a nursing home in Crystal Lake, IL, offering skilled nursing and rehabilitation. The community also fosters comfort and healing with a compassionate and home-like environment. With 24-hour care, scheduled transportation, housekeeping services, and chef-prepared meals, residents receive the utmost attention and care. Focusing on residents’ recovery and rehabilitation, the community provides personalized care plans tailored to their unique needs and habits.

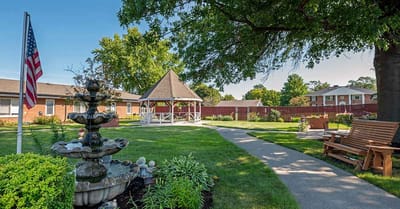
Exercise groups and recreational activities provide residents with more opportunities to explore new interests and make friends. A whirlpool spa, a barber and beauty salon, and top-notch rehabilitation equipment are also available for residents’ relaxation and wellness. Crystal Lake Park, restaurants, and shops are also located in the area, providing residents with quick access to their necessities and leisure. As one of the trusted options for senior living in Illinois, this nursing home ensures older adults can live to their potential in retirement.

Quality ratings

Measured by Centers for Medicare & Medicaid Services (CMS)

Overall rating Info The Overall CMS Rating combines results from health inspections, staffing levels and quality measures. Health inspections carry the most weight. Staffing and quality scores can increase or decrease the final rating based on performance compared to state and national standards.
▼ 60.3% Below IL avg. ▼ 60.3% Below IL avg.IL average: 2.5Click the badge to see the full State ranking.Click here to see the full State ranking.
Health Inspection Info Based on the results of the facility's three most recent standard inspections and any complaint investigations. CMS reviews the number, scope, and severity of deficiencies, with more recent findings weighted more heavily.
▼ 28.0% Below IL avg. ▼ 28.0% Below IL avg.IL average: 2.8Click the badge to see the full State ranking.Click here to see the full State ranking.
Staffing Info Measures average nursing staff hours per resident per day, including Registered Nurses (RNs) and total nursing staff. Ratings are adjusted based on the level of care residents require and are compared to state and national benchmarks.
▼ 53.2% Below IL avg. ▼ 53.2% Below IL avg.IL average: 2.1Click the badge to see the full State ranking.Click here to see the full State ranking.
Quality Measures Info Based on clinical and physical health indicators reported to CMS, such as hospital readmissions, falls, pressure ulcers, and improvements in mobility. These measures reflect how well residents' health needs are being managed.
▼ 29.0% Below IL avg. ▼ 29.0% Below IL avg.IL average: 2.8Click the badge to see the full State ranking.Click here to see the full State ranking.

Staffing hours breakdown

Info Daily nursing hours per resident by staff type, reported to CMS. Higher is generally better — compare this facility to state and national averages to see where staffing stands.

Hours per resident per day — compared to Illinois state averages

Total nursing care / resident Info This home is ranked 83rd out of 172 homes in Illinois for nurse hours. Total adjusted nursing hours per resident per day, combining RN, LPN, and aide time. CMS adjusts this for case-mix so facilities can be fairly compared.
2h 53m per day
Rank #83 / 172Nurse hours — State benchmarkedThis home is ranked 83rd out of 172 homes in Illinois. Shows adjusted nurse hours per resident per day benchmarked to the Illinois average, with a ranking across 172 Illinois facilities. More hours mean more direct care. The national average is about 3.5 hrs; below 3.0 is a red flag.Rankings are based only on facilities in Illinois that report data for that category. Facilities without available data are excluded from the ranking.Click the rank badge to see the full State ranking.Click here to see the full State ranking.
This facility Illinois avg (3h 6m per day)
vs Illinois avg
-7%

3 of 6 metrics below state avg

Standout metric Physical Therapist is +30% above state avg
Staff typeHours / Day / Residentvs state avg
Registered Nurse (RN) Info RNs hold the highest nursing license and can assess residents, interpret test results, and direct care plans. More RN hours per day often signals stronger clinical oversight and faster response to health changes. 47m per day ▲ 9% State avg: 43m per day · National avg: 41m per day
LPN / LVN Info Licensed Practical Nurses (LPNs) or Licensed Vocational Nurses (LVNs) deliver routine hands-on care — medication administration, wound dressing, and monitoring vital signs. They work under RN supervision and make up a large share of daily bedside care. 27m per day ▼ 31% State avg: 39m per day · National avg: 52m per day
Nurse Aide Info Certified Nurse Aides (CNAs) provide the most direct day-to-day assistance: bathing, dressing, feeding, and mobility. Nurse aide hours are typically the largest staffing category and directly affect residents' quality of life. 1h 55m per day ▼ 10% State avg: 2h 7m per day · National avg: 2h 20m per day
Weekend Total Nursing Info Combined nursing hours (RN + LPN + Nurse Aide) per resident per day on weekends. Staffing often drops on weekends — this figure reveals whether the facility maintains adequate coverage outside of weekday hours. 2h 57m per day ▼ 5% State avg: 3h 6m per day · National avg: 3h 27m per day
Physical Therapist Info Hours per resident per day provided by licensed Physical Therapists (PTs) or PT Assistants. PT services help residents recover mobility after injury or illness and are especially important for post-acute (short-stay) rehabilitation. 4m per day ▲ 30% State avg: 3m per day · National avg: 4m per day
Weekend RN Info Registered nurse hours specifically on weekends. Facilities sometimes reduce RN presence on Saturdays and Sundays — a low weekend RN figure compared to weekday hours can indicate reduced clinical oversight when most administrative staff are absent. 40m per day ▲ 19% State avg: 33m per day · National avg: 29m per day

Capacity and availability

This home usually has availability

Lower occupancy than the Illinois average: 69.3%
Occupancy rate
59.9% Rank #155 / 204Occupancy rate — State benchmarkedThis home is ranked 155th out of 204 homes in Illinois. Shows this facility's occupancy rate versus the Illinois average, with its Statewide rank out of 204. Higher occupancy signals strong local demand and financial stability.Rankings are based only on facilities in Illinois that report data for that category. Facilities without available data are excluded from the ranking.Click the rank badge to see the full State ranking.Click here to see the full State ranking.
Avg. Length of Stay
112 days
Bed community size
110-bed community Rank #101 / 426Bed count — State benchmarkedThis home is ranked 101st out of 426 homes in Illinois. Shows this facility's certified or reported bed count compared to other Illinois facilities. Larger communities may offer more amenities, programs, and on-site services for residents and families.Rankings are based only on facilities in Illinois that report data for that category. Facilities without available data are excluded from the ranking.Click the rank badge to see the full State ranking.Click here to see the full State ranking.
A larger shared setting that may offer more common spaces and organized community services.
Walk Score
Walk Score: 46 / 100 Rank #365 / 648Walk Score — State benchmarkedThis home is ranked 365th out of 648 homes in Illinois. Shows how walkable this facility's neighborhood is compared to the average Walk Score across Illinois facilities. Higher scores benefit residents, families, and staff.Rankings are based only on facilities in Illinois that report data for that category. Facilities without available data are excluded from the ranking.Click the rank badge to see the full State ranking.Click here to see the full State ranking.
Somewhat walkable. A few nearby services may be reachable on foot, but most trips require transportation.

Contact Crystal Pines Rehabilitation & Health Care Center

Staffing Data

Reporting period: October 1 – December 31, 2025 (Q4 2025). Source: CMS Payroll-Based Journal report.

Total staff 150
Employees 82
Contractors 68
Staff to resident ratio 1.92 : 1
7% more staff per resident than Illinois average
Illinois average ratio: 1.80 : 1 Illinois average ratio: 1.80 : 1See full Illinois ranking
Avg staff/day 42
Average shift 7.4 hours
0% compared with Illinois average
Illinois average: 7.6 hours Illinois average shift: 7.6 hoursSee full Illinois ranking
Total staff hours (quarter) 28,691

Nursing staff breakdown

Q4 2025 · Oct 1 – Dec 31 More info This data comes from the CMS Payroll-Based Journal report covering October 1 – December 31, 2025.
Registered Nurse

Manages medical care and health needs.

RN Staff Info 25 total: 14 full-time employees and 11 contractors. 25
Average shift length Info Average shift length. Calculated as total hours divided by days worked and average staff per day. 7.6 hours
Licensed Practical Nurse

Assists with medical care and medications.

LPN Staff Info 29 total: 11 full-time employees and 18 contractors. 29
Average shift length Info Average shift length. Calculated as total hours divided by days worked and average staff per day. 7.7 hours
Certified Nursing Assistant

Helps with daily care and mobility.

CNA Staff Info 73 total: 45 full-time employees and 28 contractors. 73
Average shift length Info Average shift length. Calculated as total hours divided by days worked and average staff per day. 7.8 hours

Contractor staffing

Q4 2025 · Oct 1 – Dec 31 More info This data comes from the CMS Payroll-Based Journal report covering October 1 – December 31, 2025.

Total hours from contractors

14.8%

4,243 contractor hours this quarter

Certified Nursing Assistant: 28 Licensed Practical Nurse: 18 Registered Nurse: 11 Speech Language Pathologist: 2 Respiratory Therapy Technician: 2 Occupational Therapy Aide: 2 Physical Therapy Aide: 2 Qualified Social Worker: 1 Physical Therapy Assistant: 1 Medical Director: 1

Staff by category

Q4 2025 · Oct 1 – Dec 31 More info This data comes from the CMS Payroll-Based Journal report covering October 1 – December 31, 2025.
Certified Nursing Assistant45287314,31492100%7.8
Registered Nurse1411254,96692100%7.6
Licensed Practical Nurse1118293,35492100%7.7
Other Dietary Services Staff6061,4329199%6.5
Administrator2021,0086470%8
Nurse Practitioner1015126470%8
Respiratory Therapy Technician0224956368%7.6
Dental Services Staff1014515661%8.1
Speech Language Pathologist0224116065%6.7
Physical Therapy Assistant0113735155%7.3
Clinical Nurse Specialist1013464145%8.4
Qualified Social Worker0113435358%6.5
Physical Therapy Aide0222905459%5.3
Mental Health Service Worker1012833538%8.1
Occupational Therapy Aide022924852%1.6
Medical Director011211516%1.4
73 Certified Nursing Assistant
% of Days 100%
25 Registered Nurse
% of Days 100%
29 Licensed Practical Nurse
% of Days 100%
6 Other Dietary Services Staff
% of Days 99%
2 Administrator
% of Days 70%
1 Nurse Practitioner
% of Days 70%
2 Respiratory Therapy Technician
% of Days 68%
1 Dental Services Staff
% of Days 61%
2 Speech Language Pathologist
% of Days 65%
1 Physical Therapy Assistant
% of Days 55%
1 Clinical Nurse Specialist
% of Days 45%
1 Qualified Social Worker
% of Days 58%
2 Physical Therapy Aide
% of Days 59%
1 Mental Health Service Worker
% of Days 38%
2 Occupational Therapy Aide
% of Days 52%
1 Medical Director
% of Days 16%

Penalties and fines

Includes penalties issued in 2023-2024

Federal penalties imposed by CMS for regulatory violations, including civil money penalties (fines) and denials of payment for new Medicare/Medicaid admissions.

Source: CMS Penalties Database (Data as of Jan 2026)

Total fines amount $72K Rank #110 / 173Federal fines — State benchmarkedThis home is ranked 110th out of 173 homes in Illinois. Shows this facility's cumulative CMS federal fine dollars versus the Illinois average among facilities with fines, and where it ranks among 173 facilities in the pool. Lower total dollars mean a better rank.Rankings are based only on facilities in Illinois that report data for that category. Facilities without available data are excluded from the ranking.Click the rank badge to see the full State ranking.Click here to see the full State ranking.
50% lower than Illinois average

Illinois average: $143K

Number of fines 4
35% more fines than Illinois average

Illinois average: 3.0

Payment Denials Info Serious action where Medicare and/or Medicaid temporarily stops payments for new residents until issues are fixed. 1
6% fewer payment denials than Illinois average

Illinois average: 1.1

Fines amount comparison
This facility $72K
Illinois average $143K
Penalty History

Penalties are imposed by CMS for violations of federal nursing home regulations.

4 penalties in the past 3 years

Multiple penalties were reported in the last 3 years.

Civil Money Penalty Info Fines imposed for noncompliance, which can be assessed per day or per instance of violation. Nov 14, 2024
$17K
Civil Money Penalty Info Fines imposed for noncompliance, which can be assessed per day or per instance of violation. Jun 5, 2024
$14K
Payment Denial Info Serious action where Medicare and/or Medicaid temporarily stops payments for new residents until issues are fixed. Jun 5, 2024
31 days
Civil Money Penalty Info Fines imposed for noncompliance, which can be assessed per day or per instance of violation. Jul 19, 2023
$22K

Last updated: Jan 2026

Quality of care over time

These measures show how residents usually do over time at this home, based on health outcomes and preventive care.

High-risk clinical events score Info A composite score based on pressure ulcers, falls with injury, weight loss, walking ability decline, and activities of daily living decline. 17.1
76% worse than Illinois average

Illinois average: 9.7

Functional decline score Info A composite score based on activities of daily living decline, walking ability decline, and incontinence. 32.8
76% worse than Illinois average

Illinois average: 18.6

Long-stay resident measures
Need for Help with Daily Activities Increased Info Percent of long-stay residents whose need for help with daily activities has increased 23.7%
53% worse than Illinois average

Illinois average: 15.5%

Walking Ability Worsened Info Percent of long-stay residents whose ability to move independently worsened 41.1%
123% worse than Illinois average

Illinois average: 18.4%

Low Risk Residents with Bowel/Bladder Incontinence Info Percent of low risk long-stay residents who lose control of their bowels or bladder 33.5%
55% worse than Illinois average

Illinois average: 21.6%

Falls with Major Injury Info Percent of long-stay residents experiencing one or more falls with major injury 3.1%
8% better than Illinois average

Illinois average: 3.4%

High Risk Residents with Pressure Ulcers Info Percent of long-stay high risk residents with pressure ulcers 6.9%
31% worse than Illinois average

Illinois average: 5.3%

Urinary Tract Infection Info Percent of long-stay residents with a urinary tract infection 3.6%
98% worse than Illinois average

Illinois average: 1.8%

Lost Too Much Weight Info Percent of long-stay residents who lose too much weight 10.8%
65% worse than Illinois average

Illinois average: 6.5%

Depressive Symptoms Info Percent of long-stay residents who have depressive symptoms 6.6%
86% better than Illinois average

Illinois average: 48.1%

Antipsychotic Use Info Percent of long-stay residents who received an antipsychotic medication 14.1%
30% better than Illinois average

Illinois average: 20.2%

Pneumococcal Vaccine Info Percent of long-stay residents assessed and appropriately given the pneumococcal vaccine 99.3%
11% better than Illinois average

Illinois average: 89.2%

Influenza Vaccine Info Percent of long-stay residents assessed and appropriately given the seasonal influenza vaccine 100.0%
9% better than Illinois average

Illinois average: 91.6%

Short-stay resident measures
Pneumococcal Vaccine Info Percent of short-stay residents assessed and appropriately given the pneumococcal vaccine 73.1%
7% better than Illinois average

Illinois average: 68.3%

Antipsychotic medication increase Info Percent of short-stay residents who newly received an antipsychotic medication 0.0%
100% better than Illinois average

Illinois average: 2.3%

Influenza Vaccine Info Percent of short-stay residents assessed and appropriately given the seasonal influenza vaccine 56.7%
10% worse than Illinois average

Illinois average: 63.0%

Breakdown by payment type

Medicare

72% of new residents, usually for short-term rehab.

Typical stay 15 days

Private pay

19% of new residents, often for short stays.

Typical stay 4 - 5 months

Medicaid

9% of new residents, often for long-term daily care.

Typical stay 2 - 3 years

Facility Characteristics

Source: CMS Long-Term Care Facility Characteristics (Data as of Jan 2026)

Total residents 78
Medicare
8
10.3% of residents
Medicaid
53
67.9% of residents
Private pay or other
17
21.8% of residents
Programs & Services
Residents Group

Residents meet regularly to discuss policies, care quality, and activities

Active Resident Council

Organized group of residents that meets regularly to discuss facility policies, quality of life, and activities.

Finances and operations

Based on CMS SNF Cost Report for fiscal year ending in 12/2023.

For-profit
Corporation
Net patient revenue Info Net patient revenue — what the home actually collects for resident care, after contractual allowances, bad debt and discounts are subtracted from its gross charges (CMS cost report, Worksheet G-3). It covers resident care only; money the home earns from other sources is shown separately as "Other income."
$7.3M
Net patient income Info Net patient income: net patient revenue minus the home's total operating expenses. A positive figure means it earns more from resident care than it spends to deliver it; a negative figure means the opposite. It excludes non-operating "other income."
-$1.0M
For-profit Corporation
Net patient revenue Info Net patient revenue — what the home actually collects for resident care, after contractual allowances, bad debt and discounts are subtracted from its gross charges (CMS cost report, Worksheet G-3). It covers resident care only; money the home earns from other sources is shown separately as "Other income."
$7.3M Rank #127 / 171Revenue — State benchmarkedThis home is ranked 127th out of 171 homes in Illinois. Shows this facility's annual revenue compared to the Illinois average. Higher revenue generally means more resources for staffing and capital — read alongside Payroll %.Rankings are based only on facilities in Illinois that report data for that category. Facilities without available data are excluded from the ranking.Click the rank badge to see the full State ranking.Click here to see the full State ranking.
Net patient income Info Net patient income: net patient revenue minus the home's total operating expenses. A positive figure means it earns more from resident care than it spends to deliver it; a negative figure means the opposite. It excludes non-operating "other income."
-$1.0M
Other income Info Money the home earns outside of resident care — such as investments, grants, rentals and other non-operating sources (CMS cost report, Worksheet G-3). It is tracked separately from net patient revenue: it is not part of that figure, and it is not included in net patient income.
$237.2K
Payroll costs Info Staff salaries plus wage-related costs — benefits such as payroll taxes, health insurance and retirement — from the home's own accounting records (CMS cost report, Worksheet A). Contract or agency labor is counted separately, under other operating costs. Rank #148 / 171Payroll — State benchmarkedThis home is ranked 148th out of 171 homes in Illinois. Shows total annual staff payroll benchmarked to the Illinois average. Higher payroll investment relative to peers often signals better staffing and less reliance on cheaper contract labor.Rankings are based only on facilities in Illinois that report data for that category. Facilities without available data are excluded from the ranking.Click the rank badge to see the full State ranking.Click here to see the full State ranking.
$3.5M 47.9% of net patient revenue Info Payroll as a share of revenue: staff salaries and wage-related benefits divided by net patient revenue. A higher figure means more of each revenue dollar goes to staff pay. Rank #117 / 171Payroll % — State benchmarkedThis home is ranked 117th out of 171 homes in Illinois. Shows payroll as a percentage of revenue versus the Illinois average. Well-run Illinois facilities typically land around 54–67% — the top third Statewide. Below 25% may signal understaffing or heavy agency use — read with Staffing ratings.Rankings are based only on facilities in Illinois that report data for that category. Facilities without available data are excluded from the ranking.Click the rank badge to see the full State ranking.Click here to see the full State ranking.
Other operating costs Info Everything it costs to run the home apart from payroll — food, utilities, supplies, maintenance, contract labor and administration. Calculated as total operating expense minus payroll (staff salaries and wage-related benefits).
$4.8M
Total costs Info The home's total operating expense for the year — all the costs of running it, salaries included (CMS cost report, Worksheet G-3).
$8.3M

What does this home offer?

Building type icon
Building type icon

Building Type: Single-story

On-site medical care and health services icon

On-site Medical Care and Health Services

Rehabilitative support icon

Rehabilitative Support

Beauty services icon

Beauty Services

Exercise program icon

Exercise Programs

Housekeeping icon
Housekeeping icon

Housekeeping Services

Social and recreational activities icon

Social and Recreational Activities

Transportation services icon

Transportation Services

Who this home usually serves

TYPE OF STAY

Mostly short-term rehab stays

Most residents typically stay for a few weeks or months before returning home or moving on.

Most new residents arrive under Medicare (72% of admissions), and a typical Medicare stay runs around 15 days.

Admissions
223 total

Coverage residents most often arrive under.

Medicare 72%
Private pay 19%
Medicaid 9%
Discharges
222 total

Coverage residents most often leave under.

Medicare 25%
Private pay 64%
Medicaid 10%

Places of interest near Crystal Pines Rehabilitation & Health Care Center

Address 0.8 miles from city center Info Estimated distance in miles from Crystal Lake's city center to Crystal Pines Rehabilitation & Health Care Center's address, calculated via Google Maps.

Calculate Travel Distance to Crystal Pines Rehabilitation & Health Care Center

Add your location

Address

Compare Nursing Homes around Crystal Lake

The information below is reported by the Illinois Department of Public Health, Office of Health Care Regulation.

2 facilities compared · CMS & IL Dept. of Health data

The Pearl of Crystal Lake
NH
MC
RC
Crystal Lake
97
Facility 97
IL AVG 86
Rank #132 / 426
65.3%
Facility 65.3%
IL AVG 69.3%
Rank #137 / 204
-6%
3.51
Facility 3.51
IL AVG 3.10
Rank #54 / 172
+39%+13%
$0
Facility $0
IL AVG $151.3k
Rank #1 / 173
30
Facility 30
IL AVG 36.8
Rank #79 / 172
3.8
Facility 3.8
IL AVG 3.7
Rank #103 / 172
-71-
2
Facility 2
IL AVG 51
Rank #629 / 648
Stephanie Dimitrenko
$9.8M
Facility $9.8M
IL AVG $12.2M
Rank #134 / 171
$4.3M
Facility $4.3M
IL AVG $4.8M
Rank #127 / 171
44.4%
Facility 44.4%
IL AVG 44.3%
Rank #54 / 171
145612
Crystal Pines Rehabilitation & Health Care Center
NH
HC
MC
Crystal Lake
110
Facility 110
IL AVG 86
Rank #101 / 426
59.9%
Facility 59.9%
IL AVG 69.3%
Rank #155 / 204
-14%
2.88
Facility 2.88
IL AVG 3.10
Rank #83 / 172
+18%-7%
$52.8k
Facility $52.8k
IL AVG $151.3k
Rank #110 / 173
43
Facility 43
IL AVG 36.8
Rank #117 / 172
3.3
Facility 3.3
IL AVG 3.7
Rank #69 / 172
681-
46
Facility 46
IL AVG 51
Rank #365 / 648
James Standish
$7.3M
Facility $7.3M
IL AVG $12.2M
Rank #127 / 171
$3.5M
Facility $3.5M
IL AVG $4.8M
Rank #148 / 171
47.9%
Facility 47.9%
IL AVG 44.3%
Rank #117 / 171
145257

Financial Assistance for
Nursing Home in Illinois

Crystal Pines Rehabilitation & Health Care Center is located in Crystal Lake, Illinois.
Here are the financial assistance programs available to residents in Illinois.

Get Financial aid guidance

Community Care Program

Illinois CCP

Age 60+
General Illinois resident, at risk of nursing home placement.
Income Limits (2025) ~$1,215/month individual
Asset Limits $17,500 individual, excludes home, car
IL

High demand in urban areas; waitlists possible.

Benefits
In-home care (3-5 hours/day) Adult day services ($65/day) Emergency home response systems ($30/month)

Illinois Respite Program

IL Respite (via NFCSP)

Age Caregiver of someone 60+ (or with dementia)
General Illinois resident.
Income Limits No strict limit; prioritizes low-income.
Asset Limits Not applicable.
IL

Limited slots; urban/rural balance.

Benefits
In-home respite (4-6 hours/day) Adult day care (~$65/day) Short-term facility care (up to 5 days)

Supportive Living Program (SLP)

Illinois Medicaid Supportive Living Program

Age 65+ or 22-64 with disability
General Illinois resident, Medicaid-eligible, needs moderate assistance (not nursing home-level).
Income Limits (2025) ~$2,829/month (300% FBR, individual); QIT allowed.
Asset Limits $2,000 (individual), $3,000 (couple) (excludes home, car).
IL

~200 SLP sites statewide; room/board not covered.

Benefits
Personal care (5-7 hours/day, e.g., bathing, mobility) Meals Housekeeping Medication management Respite (~240 hours/year)

Persons Who Are Elderly Waiver

Illinois Medicaid Elderly Waiver

Age 65+
General Illinois resident, Medicaid-eligible, nursing home-level care need.
Income Limits (2025) ~$2,829/month 300% FBR, individual
Asset Limits $2,000 (individual), $3,000 (couple).
IL

Part of HealthChoice Illinois; consumer-directed options available.

Benefits
Personal care (5-7 hours/day, e.g., dressing, eating) Homemaker Adult day care (~$60/day) Respite (240 hours/year) Home mods ($1,000 avg.)

Medicare Savings Program (MSP)

Illinois Medicare Savings Program

Age 65+ or disabled
General Illinois resident, Medicare Part A/B.
Income Limits (2025) ~$2,510/month (QMB), ~$3,380/month (SLMB), ~$3,598/month (QI)—individual.
Asset Limits $9,430 (individual), $14,130 (couple).
IL

Three tiers; no waitlist.

Benefits
Covers Part B premiums ($174.70/month) Deductibles ($240/year) Copays (~20%)

Optional State Supplementation (OSS)

Illinois Optional State Supplementation

Age 65+ or disabled
General Illinois resident, in approved facility, SSI recipient or low-income.
Income Limits (2025) ~$1,004/month including SSI
Asset Limits $2,000 (individual), $3,000 (couple).
IL

~$50-$500/month based on facility type.

Benefits
Cash (~$50-$500/month) for room/board in personal care homes or SLFs

VA Aid and Attendance (A&A) and Housebound Benefits

Illinois VA Aid and Attendance/Housebound

Age 65+ or disabled veteran/spouse
General Illinois resident, wartime service, need for ADL help (A&A) or homebound.
Income Limits (2025) Net income < ~$1,984/month (veteran with dependent, A&A); pension offsets income.
Asset Limits ~$155,356 net worth limit
IL

High veteran demand in urban/rural areas.

Benefits
Cash (~$1,433-$2,642/month veteran, ~$951-$1,318 spouse) for care costs (e.g., in-home, assisted living)

Frequently Asked Questions about Crystal Pines Rehabilitation & Health Care Center

Is Crystal Pines Rehabilitation & Health Care Center in a walkable area?

Crystal Pines Rehabilitation & Health Care Center has a walk score of 46. Somewhat walkable. A few nearby services may be reachable on foot, but most trips require transportation.

What is the occupancy rate at Crystal Pines Rehabilitation & Health Care Center?

Crystal Pines Rehabilitation & Health Care Center's occupancy is 59.9%.

What is the best email address for Crystal Pines Rehabilitation & Health Care Center?

The team at Crystal Pines Rehabilitation & Health Care Center can be reached at [email protected].

Does Crystal Pines Rehabilitation & Health Care Center operate as a for-profit or non-profit?

Crystal Pines Rehabilitation & Health Care Center is registered as a for-profit.

Are there photos of Crystal Pines Rehabilitation & Health Care Center?

Yes — there are 4 photos of Crystal Pines Rehabilitation & Health Care Center in the photo gallery on this page.

What is the address of Crystal Pines Rehabilitation & Health Care Center?

Crystal Pines Rehabilitation & Health Care Center is located at 335 Illinois St, Crystal Lake, IL 60014.

What is the phone number of Crystal Pines Rehabilitation & Health Care Center?

(815) 998-5587 will put you in contact with the team at Crystal Pines Rehabilitation & Health Care Center.

Guides for Better Senior Living

Care Cost Calculator: See Prices in Your Area

Nursing Home Data Explorer

Don’t Wait Too Long: 7 Red Flag Signs Your Parent Needs Assisted Living Now

The True Cost of Assisted Living in 2025 – And How Families Are Paying For It

Understanding Senior Living Costs: Pricing Models, Discounts & Financial Assistance