Cypress Point
Nursing Home & Hospice Care · Dexter, MO
CMS overall rating Info CMS (the Centers for Medicare & Medicaid Services) is the federal agency that rates nursing home quality. Its Overall Rating runs from 1 to 5 stars, combining health inspections, staffing, and quality measures, with inspections weighted most heavily.

Cypress Point

Nursing Home & Hospice Care · Dexter, MO
CMS overall rating Info CMS (the Centers for Medicare & Medicaid Services) is the federal agency that rates nursing home quality. Its Overall Rating runs from 1 to 5 stars, combining health inspections, staffing, and quality measures, with inspections weighted most heavily.
Calculator: See prices in your area
Cypress Point accepts Medicare, Medicaid, and private pay.

Overview of Cypress Point

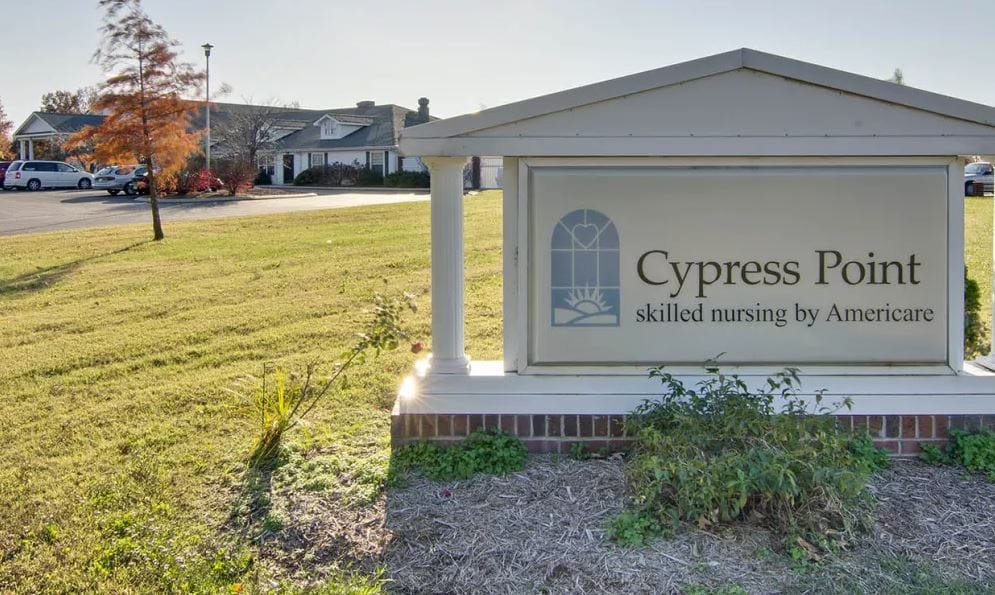
Ideally settled in the tranquil area of Dexter, MO, Cypress Point is a dedicated senior living community that offers rehabilitation, skilled nursing, hospice care, and home health care. Residents can comfortably recover in their bright and airy studio apartments with convenient access to 24-hour care and assistance. The community’s team of care professionals ensure residents fully recover and avoid being readmitted to the hospital through individualized care plans and a wide array of rehabilitation therapies.

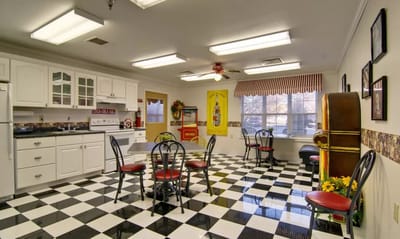
Residents can get back to their old hobbies or discover new ones with a wide array of planned activities and events conducted both on-site and offsite. The community also offers a wide range of health & wellness initiatives, including nutritious meals, and a selection of fun fitness programs and meditation classes. Here, residents are empowered to get back on their routines and fully recover with a range of services that focuses on all aspects of well-being.

Quality ratings

Measured by Centers for Medicare & Medicaid Services (CMS)

Overall rating Info The Overall CMS Rating combines results from health inspections, staffing levels and quality measures. Health inspections carry the most weight. Staffing and quality scores can increase or decrease the final rating based on performance compared to state and national standards.
▲ 61.0% Above MO avg. ▲ 61.0% Above MO avg.MO average: 2.5Click the badge to see the full State ranking.Click here to see the full State ranking.
Health Inspection Info Based on the results of the facility's three most recent standard inspections and any complaint investigations. CMS reviews the number, scope, and severity of deficiencies, with more recent findings weighted more heavily.
▲ 44.2% Above MO avg. ▲ 44.2% Above MO avg.MO average: 2.8Click the badge to see the full State ranking.Click here to see the full State ranking.
Staffing Info Measures average nursing staff hours per resident per day, including Registered Nurses (RNs) and total nursing staff. Ratings are adjusted based on the level of care residents require and are compared to state and national benchmarks.
▲ 82.8% Above MO avg. ▲ 82.8% Above MO avg.MO average: 2.2Click the badge to see the full State ranking.Click here to see the full State ranking.
Quality Measures Info Based on clinical and physical health indicators reported to CMS, such as hospital readmissions, falls, pressure ulcers, and improvements in mobility. These measures reflect how well residents' health needs are being managed.
▲ 50.5% Above MO avg. ▲ 50.5% Above MO avg.MO average: 2.7Click the badge to see the full State ranking.Click here to see the full State ranking.

Staffing hours breakdown

Info Daily nursing hours per resident by staff type, reported to CMS. Higher is generally better — compare this facility to state and national averages to see where staffing stands.

Hours per resident per day — compared to Missouri state averages

Total nursing care / resident Info This home is ranked 68th out of 282 homes in Missouri for nurse hours. Total adjusted nursing hours per resident per day, combining RN, LPN, and aide time. CMS adjusts this for case-mix so facilities can be fairly compared.
4h 18m per day
Rank #68 / 282Nurse hours — State benchmarkedThis home is ranked 68th out of 282 homes in Missouri. Shows adjusted nurse hours per resident per day benchmarked to the Missouri average, with a ranking across 282 Missouri facilities. More hours mean more direct care. The national average is about 3.5 hrs; below 3.0 is a red flag.Rankings are based only on facilities in Missouri that report data for that category. Facilities without available data are excluded from the ranking.Click the rank badge to see the full State ranking.Click here to see the full State ranking.
This facility Missouri avg (3h 44m per day)
vs Missouri avg
+15%

0 of 6 metrics below state avg

Standout metric Registered Nurse (RN) is +59% above state avg
Staff typeHours / Day / Residentvs state avg
Registered Nurse (RN) Info RNs hold the highest nursing license and can assess residents, interpret test results, and direct care plans. More RN hours per day often signals stronger clinical oversight and faster response to health changes. 44m per day ▲ 59% State avg: 28m per day · National avg: 41m per day
LPN / LVN Info Licensed Practical Nurses (LPNs) or Licensed Vocational Nurses (LVNs) deliver routine hands-on care — medication administration, wound dressing, and monitoring vital signs. They work under RN supervision and make up a large share of daily bedside care. 52m per day ▲ 27% State avg: 41m per day · National avg: 52m per day
Nurse Aide Info Certified Nurse Aides (CNAs) provide the most direct day-to-day assistance: bathing, dressing, feeding, and mobility. Nurse aide hours are typically the largest staffing category and directly affect residents' quality of life. 2h 24m per day ▲ 3% State avg: 2h 20m per day · National avg: 2h 21m per day
Weekend Total Nursing Info Combined nursing hours (RN + LPN + Nurse Aide) per resident per day on weekends. Staffing often drops on weekends — this figure reveals whether the facility maintains adequate coverage outside of weekday hours. 3h 11m per day ▲ 4% State avg: 3h 3m per day · National avg: 3h 26m per day
Physical Therapist Info Hours per resident per day provided by licensed Physical Therapists (PTs) or PT Assistants. PT services help residents recover mobility after injury or illness and are especially important for post-acute (short-stay) rehabilitation. 3m per day ▲ 30% State avg: 2m per day · National avg: 4m per day
Weekend RN Info Registered nurse hours specifically on weekends. Facilities sometimes reduce RN presence on Saturdays and Sundays — a low weekend RN figure compared to weekday hours can indicate reduced clinical oversight when most administrative staff are absent. 29m per day ▲ 43% State avg: 20m per day · National avg: 29m per day

Capacity and availability

This home is often near full

Higher occupancy than the Missouri average: 66.6%
Occupancy rate
98.7% Rank #9 / 434Occupancy rate — State benchmarkedThis home is ranked 9th out of 434 homes in Missouri. Shows this facility's occupancy rate versus the Missouri average, with its Statewide rank out of 434. Higher occupancy signals strong local demand and financial stability.Rankings are based only on facilities in Missouri that report data for that category. Facilities without available data are excluded from the ranking.Click the rank badge to see the full State ranking.Click here to see the full State ranking.
Avg. Length of Stay
93 days
Bed community size
79-bed community Rank #275 / 454Bed count — State benchmarkedThis home is ranked 275th out of 454 homes in Missouri. Shows this facility's certified or reported bed count compared to other Missouri facilities. Larger communities may offer more amenities, programs, and on-site services for residents and families.Rankings are based only on facilities in Missouri that report data for that category. Facilities without available data are excluded from the ranking.Click the rank badge to see the full State ranking.Click here to see the full State ranking.
A larger shared setting that may offer more common spaces and organized community services.
Walk Score
Walk Score: 43 / 100 Rank #312 / 563Walk Score — State benchmarkedThis home is ranked 312th out of 563 homes in Missouri. Shows how walkable this facility's neighborhood is compared to the average Walk Score across Missouri facilities. Higher scores benefit residents, families, and staff.Rankings are based only on facilities in Missouri that report data for that category. Facilities without available data are excluded from the ranking.Click the rank badge to see the full State ranking.Click here to see the full State ranking.
Somewhat walkable. A few nearby services may be reachable on foot, but most trips require transportation.

Contact Cypress Point

Staffing Data

Reporting period: October 1 – December 31, 2025 (Q4 2025). Source: CMS Payroll-Based Journal report.

Total staff 103
Employees 85
Contractors 18
Staff to resident ratio 1.51 : 1
11% fewer staff per resident than Missouri average
Missouri average ratio: 1.69 : 1 Missouri average ratio: 1.69 : 1See full Missouri ranking
Avg staff/day 39
Average shift 7.7 hours
5% worse than Missouri average
Missouri average: 8.1 hours Missouri average shift: 8.1 hoursSee full Missouri ranking
Total staff hours (quarter) 27,762

Nursing staff breakdown

Q4 2025 · Oct 1 – Dec 31 More info This data comes from the CMS Payroll-Based Journal report covering October 1 – December 31, 2025.
Registered Nurse

Manages medical care and health needs.

RN Staff Info All 10 RN Staff are full-time employees. No contractors work on this role. 10
Average shift length Info Average shift length. Calculated as total hours divided by days worked and average staff per day. 8.8 hours
Licensed Practical Nurse

Assists with medical care and medications.

LPN Staff Info All 14 LPN Staff are full-time employees. No contractors work on this role. 14
Average shift length Info Average shift length. Calculated as total hours divided by days worked and average staff per day. 8.5 hours
Certified Nursing Assistant

Helps with daily care and mobility.

CNA Staff Info All 55 CNA Staff are full-time employees. No contractors work on this role. 55
Average shift length Info Average shift length. Calculated as total hours divided by days worked and average staff per day. 7.5 hours

Contractor staffing

Q4 2025 · Oct 1 – Dec 31 More info This data comes from the CMS Payroll-Based Journal report covering October 1 – December 31, 2025.

Total hours from contractors

9.8%

2,720 contractor hours this quarter

Physical Therapy Aide: 5 Speech Language Pathologist: 4 Qualified Social Worker: 3 Respiratory Therapy Technician: 2 Physical Therapy Assistant: 1 Occupational Therapy Aide: 1 Medical Director: 1 Therapeutic Recreation Specialist: 1

Staff by category

Q4 2025 · Oct 1 – Dec 31 More info This data comes from the CMS Payroll-Based Journal report covering October 1 – December 31, 2025.
Certified Nursing Assistant5505514,15592100%7.5
Licensed Practical Nurse140144,63492100%8.5
Registered Nurse100103,90192100%8.8
Speech Language Pathologist0447896975%6.1
Physical Therapy Aide0557836672%6.9
Dietitian1014846065%8.1
Nurse Practitioner1014806065%8
RN Director of Nursing1014745964%8
Qualified Social Worker0334716672%6.2
Mental Health Service Worker1014425863%7.6
Administrator1014245358%8
Physical Therapy Assistant0113585863%6.2
Respiratory Therapy Technician0222565964%4.2
Medication Aide/Technician10148910%5.4
Occupational Therapy Aide0114067%6.6
Therapeutic Recreation Specialist0111933%6.2
Medical Director011633%2
55 Certified Nursing Assistant
% of Days 100%
14 Licensed Practical Nurse
% of Days 100%
10 Registered Nurse
% of Days 100%
4 Speech Language Pathologist
% of Days 75%
5 Physical Therapy Aide
% of Days 72%
1 Dietitian
% of Days 65%
1 Nurse Practitioner
% of Days 65%
1 RN Director of Nursing
% of Days 64%
3 Qualified Social Worker
% of Days 72%
1 Mental Health Service Worker
% of Days 63%
1 Administrator
% of Days 58%
1 Physical Therapy Assistant
% of Days 63%
2 Respiratory Therapy Technician
% of Days 64%
1 Medication Aide/Technician
% of Days 10%
1 Occupational Therapy Aide
% of Days 7%
1 Therapeutic Recreation Specialist
% of Days 3%
1 Medical Director
% of Days 3%

Penalties and fines

Includes penalties issued in 2025

Federal penalties imposed by CMS for regulatory violations, including civil money penalties (fines) and denials of payment for new Medicare/Medicaid admissions.

Source: CMS Penalties Database (Data as of Jan 2026)

Total fines amount $74K Rank #247 / 289Federal fines — State benchmarkedThis home is ranked 247th out of 289 homes in Missouri. Shows this facility's cumulative CMS federal fine dollars versus the Missouri average among facilities with fines, and where it ranks among 289 facilities in the pool. Lower total dollars mean a better rank.Rankings are based only on facilities in Missouri that report data for that category. Facilities without available data are excluded from the ranking.Click the rank badge to see the full State ranking.Click here to see the full State ranking.
In line with Missouri average

Missouri average: $73K

Number of fines 1
59% fewer fines than Missouri average

Missouri average: 2.4

Payment Denials Info Serious action where Medicare and/or Medicaid temporarily stops payments for new residents until issues are fixed. 0
100% fewer payment denials than Missouri average

Missouri average: 0.7

Fines amount comparison
This facility $74K
Missouri average $73K
Penalty History

Penalties are imposed by CMS for violations of federal nursing home regulations.

1 penalty in the past 3 years

Mar 5, 2025 · $74K

Civil Money Penalty Info Fines imposed for noncompliance, which can be assessed per day or per instance of violation. Mar 5, 2025
$74K

Last updated: Jan 2026

Quality of care over time

These measures show how residents usually do over time at this home, based on health outcomes and preventive care.

High-risk clinical events score Info A composite score based on pressure ulcers, falls with injury, weight loss, walking ability decline, and activities of daily living decline. 7.9
28% better than Missouri average

Missouri average: 10.9

Functional decline score Info A composite score based on activities of daily living decline, walking ability decline, and incontinence. 8.0
59% better than Missouri average

Missouri average: 19.5

Long-stay resident measures
Significantly above average Missouri avg: 2.7 Info CMS star rating based on long-stay quality measure performance. 5 stars = significantly above average, 1 star = significantly below average.
Need for Help with Daily Activities Increased Info Percent of long-stay residents whose need for help with daily activities has increased 9.8%
50% better than Missouri average

Missouri average: 19.8%

Walking Ability Worsened Info Percent of long-stay residents whose ability to move independently worsened 6.0%
71% better than Missouri average

Missouri average: 20.6%

Low Risk Residents with Bowel/Bladder Incontinence Info Percent of low risk long-stay residents who lose control of their bowels or bladder 8.1%
55% better than Missouri average

Missouri average: 18.1%

Falls with Major Injury Info Percent of long-stay residents experiencing one or more falls with major injury 5.2%
28% worse than Missouri average

Missouri average: 4.0%

High Risk Residents with Pressure Ulcers Info Percent of long-stay high risk residents with pressure ulcers 4.6%
9% better than Missouri average

Missouri average: 5.0%

Urinary Tract Infection Info Percent of long-stay residents with a urinary tract infection 0.0%
100% better than Missouri average

Missouri average: 2.7%

Lost Too Much Weight Info Percent of long-stay residents who lose too much weight 13.9%
150% worse than Missouri average

Missouri average: 5.6%

Depressive Symptoms Info Percent of long-stay residents who have depressive symptoms 4.8%
63% better than Missouri average

Missouri average: 12.8%

Antipsychotic Use Info Percent of long-stay residents who received an antipsychotic medication 10.5%
52% better than Missouri average

Missouri average: 22.0%

Pneumococcal Vaccine Info Percent of long-stay residents assessed and appropriately given the pneumococcal vaccine 100.0%
17% better than Missouri average

Missouri average: 85.2%

Influenza Vaccine Info Percent of long-stay residents assessed and appropriately given the seasonal influenza vaccine 98.4%
8% better than Missouri average

Missouri average: 90.9%

Hospitalizations per 1,000 days Info Number of hospitalizations per 1,000 long-stay resident days. 1.28
38% better than Missouri average

Missouri average: 2.08

ED visits per 1,000 days Info Number of outpatient emergency department visits per 1,000 long-stay resident days. 1.58
33% better than Missouri average

Missouri average: 2.35

Short-stay resident measures
Above average Missouri avg: 2.1 Info CMS star rating based on short-stay quality measure performance. 5 stars = much above average, 1 star = much below average.
Pneumococcal Vaccine Info Percent of short-stay residents assessed and appropriately given the pneumococcal vaccine 98.5%
48% better than Missouri average

Missouri average: 66.6%

Antipsychotic medication increase Info Percent of short-stay residents who newly received an antipsychotic medication 0.0%
100% better than Missouri average

Missouri average: 2.2%

Influenza Vaccine Info Percent of short-stay residents assessed and appropriately given the seasonal influenza vaccine 89.4%
41% better than Missouri average

Missouri average: 63.5%

Re-hospitalized after SNF stay Info Percentage of short-stay residents who were re-hospitalized after their nursing home admission. 29.0%
15% worse than Missouri average

Missouri average: 25.3%

Emergency department visits Info Percentage of short-stay residents who had an outpatient emergency department visit. 20.1%
50% worse than Missouri average

Missouri average: 13.4%

Falls with major injury Info Percentage of SNF residents who experience falls with major injury during their stay. 0.8%
In line with Missouri average

Missouri average: 0.8%

Ability to care for self at discharge Info Percentage of residents at or above expected ability to care for themselves at discharge. 55.1%
In line with Missouri average

Missouri average: 53.7%

Successful return to home or community Info Rate of successful return to home or community from a skilled nursing facility. 60.4%
19% better than Missouri average

Missouri average: 50.6%

Breakdown by payment type

Medicare

60% of new residents, usually for short-term rehab.

Typical stay 1 - 2 months

Private pay

29% of new residents, often for short stays.

Typical stay 3 - 4 months

Medicaid

10% of new residents, often for long-term daily care.

Typical stay 11 - 12 months

Facility Characteristics

Source: CMS Long-Term Care Facility Characteristics (Data as of Jan 2026)

Total residents 68
Medicare
16
23.5% of residents
Medicaid
25
36.8% of residents
Private pay or other
27
39.7% of residents
Programs & Services
Residents Group

Residents meet regularly to discuss policies, care quality, and activities

Active Resident Council

Organized group of residents that meets regularly to discuss facility policies, quality of life, and activities.

Finances and operations

Based on CMS SNF Cost Report for fiscal year ending in 12/2023.

For-profit
Corporation
Net patient revenue Info Net patient revenue — what the home actually collects for resident care, after contractual allowances, bad debt and discounts are subtracted from its gross charges (CMS cost report, Worksheet G-3). It covers resident care only; money the home earns from other sources is shown separately as "Other income."
$7.7M
Net patient income Info Net patient income: net patient revenue minus the home's total operating expenses. A positive figure means it earns more from resident care than it spends to deliver it; a negative figure means the opposite. It excludes non-operating "other income."
$922.4K
For-profit Corporation
Net patient revenue Info Net patient revenue — what the home actually collects for resident care, after contractual allowances, bad debt and discounts are subtracted from its gross charges (CMS cost report, Worksheet G-3). It covers resident care only; money the home earns from other sources is shown separately as "Other income."
$7.7M Rank #111 / 292Revenue — State benchmarkedThis home is ranked 111th out of 292 homes in Missouri. Shows this facility's annual revenue compared to the Missouri average. Higher revenue generally means more resources for staffing and capital — read alongside Payroll %.Rankings are based only on facilities in Missouri that report data for that category. Facilities without available data are excluded from the ranking.Click the rank badge to see the full State ranking.Click here to see the full State ranking.
Net patient income Info Net patient income: net patient revenue minus the home's total operating expenses. A positive figure means it earns more from resident care than it spends to deliver it; a negative figure means the opposite. It excludes non-operating "other income."
$922.4K
Other income Info Money the home earns outside of resident care — such as investments, grants, rentals and other non-operating sources (CMS cost report, Worksheet G-3). It is tracked separately from net patient revenue: it is not part of that figure, and it is not included in net patient income.
$563
Payroll costs Info Staff salaries plus wage-related costs — benefits such as payroll taxes, health insurance and retirement — from the home's own accounting records (CMS cost report, Worksheet A). Contract or agency labor is counted separately, under other operating costs. Rank #150 / 292Payroll — State benchmarkedThis home is ranked 150th out of 292 homes in Missouri. Shows total annual staff payroll benchmarked to the Missouri average. Higher payroll investment relative to peers often signals better staffing and less reliance on cheaper contract labor.Rankings are based only on facilities in Missouri that report data for that category. Facilities without available data are excluded from the ranking.Click the rank badge to see the full State ranking.Click here to see the full State ranking.
$3.6M 46.5% of net patient revenue Info Payroll as a share of revenue: staff salaries and wage-related benefits divided by net patient revenue. A higher figure means more of each revenue dollar goes to staff pay. Rank #214 / 292Payroll % — State benchmarkedThis home is ranked 214th out of 292 homes in Missouri. Shows payroll as a percentage of revenue versus the Missouri average. Well-run Missouri facilities typically land around 60–71% — the top third Statewide. Below 25% may signal understaffing or heavy agency use — read with Staffing ratings.Rankings are based only on facilities in Missouri that report data for that category. Facilities without available data are excluded from the ranking.Click the rank badge to see the full State ranking.Click here to see the full State ranking.
Other operating costs Info Everything it costs to run the home apart from payroll — food, utilities, supplies, maintenance, contract labor and administration. Calculated as total operating expense minus payroll (staff salaries and wage-related benefits).
$3.2M
Total costs Info The home's total operating expense for the year — all the costs of running it, salaries included (CMS cost report, Worksheet G-3).
$6.8M

What does this home offer?

Pets allowed icon
Pets allowed icon

Pets Allowed

Room sizes icon
Room sizes icon

Room Sizes: 256 / 500 sq. ft.

Housing options icon

Housing Options: Studio

Building type icon
Building type icon

Building Type: Single-story

Transportation services icon

Transportation Services

Fitness and recreation icon

Fitness and Recreation

Who this home usually serves

TYPE OF STAY

Mostly short-term rehab stays

Most residents typically stay for a few weeks or months before returning home or moving on.

Most new residents arrive under Medicare (60% of admissions), and a typical Medicare stay runs around 1 - 2 months.

Admissions
253 total

Coverage residents most often arrive under.

Medicare 60%
Private pay 29%
Medicaid 10%
Discharges
256 total

Coverage residents most often leave under.

Medicare 49%
Private pay 30%
Medicaid 20%

Places of interest near Cypress Point

Address 801 Bailiff Dr, Dexter, MO 63841

Calculate Travel Distance to Cypress Point

Add your location

Address

Compare Nursing Homes around Sikeston

The information below is reported by the Missouri Department of Health and Senior Services, Division of Regulation and Licensure.

5 facilities compared · CMS & MO Dept. of Health data

Delta South Nursing &Amp; Rehabilitation
NH
HC
PC
RC
Sikeston
60
Facility 60
MO AVG 97
Rank #343 / 454
88.3%
Facility 88.3%
MO AVG 66.6%
Rank #52 / 434
+33%
4.01
Facility 4.01
MO AVG 3.74
Rank #103 / 282
+81%+7%
$0
Facility $0
MO AVG $76.9k
Rank #1 / 289
34
Facility 34
MO AVG 36.5
Rank #163 / 287
11.3
Facility 11.3
MO AVG 5.7
Rank #282 / 287
-49-
73
Facility 73
MO AVG 45
Rank #70 / 563
Delta South Skilled Nursing And Rehabilitation LLC
$4.2M
Facility $4.2M
MO AVG $8.4M
Rank #221 / 292
$2.6M
Facility $2.6M
MO AVG $3.3M
Rank #212 / 292
62.1%
Facility 62.1%
MO AVG 45.6%
Rank #134 / 292
265862
Daybreak Nursing Center
NH
AL
HC
NC
PC
RC
Sikeston
70
Facility 70
MO AVG 97
Rank #305 / 454
94.3%
Facility 94.3%
MO AVG 66.6%
Rank #21 / 434
+42%
2.86
Facility 2.86
MO AVG 3.74
Rank #241 / 282
+8%-23%
$0
Facility $0
MO AVG $76.9k
Rank #1 / 289
15
Facility 15
MO AVG 36.5
Rank #48 / 287
5.0
Facility 5.0
MO AVG 5.7
Rank #127 / 287
-64A+
73
Facility 73
MO AVG 45
Rank #70 / 563
Dalen Hutchinson
$4.1M
Facility $4.1M
MO AVG $8.4M
Rank #220 / 292
$2.1M
Facility $2.1M
MO AVG $3.3M
Rank #230 / 292
52%
Facility 52%
MO AVG 45.6%
Rank #184 / 292
265548
Cypress Point
NH
HC
Dexter
79
Facility 79
MO AVG 97
Rank #275 / 454
98.7%
Facility 98.7%
MO AVG 66.6%
Rank #9 / 434
+48%
4.30
Facility 4.30
MO AVG 3.74
Rank #68 / 282
+26%+15%
$73.7k
Facility $73.7k
MO AVG $76.9k
Rank #247 / 289
13
Facility 13
MO AVG 36.5
Rank #34 / 287
2.6
Facility 2.6
MO AVG 5.7
Rank #18 / 287
164-
43
Facility 43
MO AVG 45
Rank #312 / 563
John Langley
$7.7M
Facility $7.7M
MO AVG $8.4M
Rank #111 / 292
$3.6M
Facility $3.6M
MO AVG $3.3M
Rank #150 / 292
46.5%
Facility 46.5%
MO AVG 45.6%
Rank #214 / 292
265367
Hunter Acres Caring Center
NH
MC
NC
Sikeston
120
Facility 120
MO AVG 97
Rank #89 / 454
72.5%
Facility 72.5%
MO AVG 66.6%
Rank #171 / 434
+9%
3.27
Facility 3.27
MO AVG 3.74
Rank #206 / 282
-52%-12%
$10.0k
Facility $10.0k
MO AVG $76.9k
Rank #172 / 289
19
Facility 19
MO AVG 36.5
Rank #72 / 287
4.8
Facility 4.8
MO AVG 5.7
Rank #120 / 287
190-
73
Facility 73
MO AVG 45
Rank #70 / 563
Lisa Kelley
$6.1M
Facility $6.1M
MO AVG $8.4M
Rank #115 / 292
$2.9M
Facility $2.9M
MO AVG $3.3M
Rank #163 / 292
48%
Facility 48%
MO AVG 45.6%
Rank #239 / 292
265387
Sikeston Convalescent Center
NH
MC
Sikeston
120
Facility 120
MO AVG 97
Rank #89 / 454
60.0%
Facility 60.0%
MO AVG 66.6%
Rank #276 / 434
-10%
3.96
Facility 3.96
MO AVG 3.74
Rank #103 / 282
-32%+6%
$13.6k
Facility $13.6k
MO AVG $76.9k
Rank #184 / 289
31
Facility 31
MO AVG 36.5
Rank #146 / 287
5.2
Facility 5.2
MO AVG 5.7
Rank #143 / 287
171-
73
Facility 73
MO AVG 45
Rank #70 / 563
Daryl Wade
$5.6M
Facility $5.6M
MO AVG $8.4M
Rank #112 / 292
$2.4M
Facility $2.4M
MO AVG $3.3M
Rank #186 / 292
43.2%
Facility 43.2%
MO AVG 45.6%
Rank #271 / 292
265479

Financial Assistance for
Nursing Home in Missouri

Cypress Point is located in Dexter, Missouri.
Here are the financial assistance programs available to residents in Missouri.

Get Financial aid guidance

Aged and Disabled Waiver

Missouri Medicaid A&D Waiver

Age 65+ or disabled
General Missouri resident, Medicaid- eligible, nursing home-level care need.
Income Limits (2025) ~$2,829/month 300% FBR, individual
Asset Limits $2,000 (individual), $3,000 (couple).
MO

Rural access prioritized.

Benefits
Personal care (5-7 hours/day) Respite (240 hours/year) Adult day care (~$65/day) Home health services

Missouri Supplemental Nursing Care (SNC)

MO SNC

Age 65+
General Missouri resident, in approved facility.
Income Limits ~$1,215/month individual
Asset Limits $2,000 individual
MO

Supplements SSI; facility-based only.

Benefits
Monthly cash payment (~$156-$292/month) for care costs

Structured Family Caregiving Waiver (SFCW)

Missouri Structured Family Caregiving Waiver

Age 65+
General Missouri resident, MO HealthNet-eligible, NFLOC, dementia diagnosis, live with caregiver.
Income Limits (2025) ~$2,901/month (300% FBR, individual); QIT required.
Asset Limits $5,909.25 (individual), $11,818.45 (couple).
MO

Caregiver must be family; small program size.

Benefits
Cash stipend ($1,000-$1,500/month) to family caregiver Respite Training Supplies ($500/year)

MO HealthNet Aged, Blind, and Disabled (ABD)

Missouri MO HealthNet ABD

Age 65+ or disabled
General Missouri resident, MO HealthNet-eligible, needs help with 1+ ADL.
Income Limits (2025) ~$1,690/month (individual, projected); spenddown allowed.
Asset Limits $5,909.25 (individual), $11,818.45 (couple).
MO

Less intensive than waivers; statewide access.

Benefits
Personal care (2-4 hours/day) Homemaker services Limited respite Medical equipment

Medicare Savings Program (MSP)

Missouri Medicare Savings Program

Age 65+ or disabled
General Missouri resident, Medicare Part A/B.
Income Limits (2025) ~$2,510/month (QMB), ~$3,380/month (SLMB), ~$3,598/month (QI)—individual.
Asset Limits $9,430 (individual), $14,130 (couple).
MO

Three tiers; no waitlist; includes Extra Help for Part D.

Benefits
Covers Part B premiums ($174.70/month) Deductibles ($240/year) Copays (~20%)

Missouri Caregiver Program (Customized Caregiver Training & Relief)

Missouri Caregiver Program

Age
General Caregivers of 60+ with dementia, Missouri resident, functional needs (2+ ADLs).
Income Limits (2025) No strict cap; prioritizes low-income ~$24,980/year individual
Asset Limits Not assessed; need-based.
MO

Administered via AAAs and Alzheimer’s Association; rural focus.

Benefits
Respite (4-6 hours/week) Training Assistive tech ($500/year) Supplies

VA Aid and Attendance (A&A) and Housebound Benefits

Missouri VA Aid and Attendance/Housebound

Age 65+ or disabled veteran/spouse
General Missouri resident, wartime service, need for ADL help (A&A) or homebound.
Income Limits (2025) Net income < ~$1,984/month (veteran with dependent, A&A); pension offsets income.
Asset Limits ~$155,356 net worth limit
MO

High veteran demand in rural/urban areas.

Benefits
Cash (~$1,433-$2,642/month veteran, ~$951-$1,318 spouse) for care costs (e.g., in-home, assisted living)

Frequently Asked Questions about Cypress Point

Is Cypress Point in a walkable area?

Cypress Point has a walk score of 43. Somewhat walkable. A few nearby services may be reachable on foot, but most trips require transportation.

What is the occupancy rate at Cypress Point?

Cypress Point's occupancy is 98.7%.

Does Cypress Point operate as a for-profit or non-profit?

Cypress Point is registered as a for-profit.

Are there photos of Cypress Point?

Yes — there are 4 photos of Cypress Point in the photo gallery on this page.

What is the address of Cypress Point?

Cypress Point is located at 801 Bailiff Dr, Dexter, MO 63841.

What is the phone number of Cypress Point?

(573) 624-8908 will put you in contact with the team at Cypress Point.

Is Cypress Point Medicare or Medicaid certified?

Yes — Cypress Point is a CMS-certified provider of Medicare and Medicaid.

Guides for Better Senior Living

Care Cost Calculator: See Prices in Your Area

Nursing Home Data Explorer

Don’t Wait Too Long: 7 Red Flag Signs Your Parent Needs Assisted Living Now

The True Cost of Assisted Living in 2025 – And How Families Are Paying For It

Understanding Senior Living Costs: Pricing Models, Discounts & Financial Assistance