Dells Nursing and Rehab Center Inc.
CMS overall rating Info CMS (the Centers for Medicare & Medicaid Services) is the federal agency that rates nursing home quality. Its Overall Rating runs from 1 to 5 stars, combining health inspections, staffing, and quality measures, with inspections weighted most heavily.

Dells Nursing and Rehab Center Inc.

CMS overall rating Info CMS (the Centers for Medicare & Medicaid Services) is the federal agency that rates nursing home quality. Its Overall Rating runs from 1 to 5 stars, combining health inspections, staffing, and quality measures, with inspections weighted most heavily.
Calculator: See prices in your area
Dells Nursing and Rehab Center Inc. accepts Medicare, Medicaid, and private pay.

Overview of Dells Nursing and Rehab Center INC.

Dells Nursing and Rehab Center Inc. specializes in quality long-term care in a family-focused environment. The facility is committed to providing a secure and comfortable lifestyle for its residents. Family involvement and community integration are encouraged.

Quality ratings

Measured by Centers for Medicare & Medicaid Services (CMS)

Overall rating Info The Overall CMS Rating combines results from health inspections, staffing levels and quality measures. Health inspections carry the most weight. Staffing and quality scores can increase or decrease the final rating based on performance compared to state and national standards.
▲ 47.3% Above SD avg. ▲ 47.3% Above SD avg.SD average: 2.7Click the badge to see the full State ranking.Click here to see the full State ranking.
Health Inspection Info Based on the results of the facility's three most recent standard inspections and any complaint investigations. CMS reviews the number, scope, and severity of deficiencies, with more recent findings weighted more heavily.
▲ 47.9% Above SD avg. ▲ 47.9% Above SD avg.SD average: 2.7Click the badge to see the full State ranking.Click here to see the full State ranking.
Staffing Info Measures average nursing staff hours per resident per day, including Registered Nurses (RNs) and total nursing staff. Ratings are adjusted based on the level of care residents require and are compared to state and national benchmarks.
▲ 20.6% Above SD avg. ▲ 20.6% Above SD avg.SD average: 3.3Click the badge to see the full State ranking.Click here to see the full State ranking.
Quality Measures Info Based on clinical and physical health indicators reported to CMS, such as hospital readmissions, falls, pressure ulcers, and improvements in mobility. These measures reflect how well residents' health needs are being managed.
▲ 10.0% Above SD avg. ▲ 10.0% Above SD avg.SD average: 2.7Click the badge to see the full State ranking.Click here to see the full State ranking.

Staffing hours breakdown

Info Daily nursing hours per resident by staff type, reported to CMS. Higher is generally better — compare this facility to state and national averages to see where staffing stands.

Hours per resident per day — compared to South Dakota state averages

Total nursing care / resident Info This home is ranked 23rd out of 65 homes in South Dakota for nurse hours. Total adjusted nursing hours per resident per day, combining RN, LPN, and aide time. CMS adjusts this for case-mix so facilities can be fairly compared.
4h 0m per day
Rank #23 / 65Nurse hours — State benchmarkedThis home is ranked 23rd out of 65 homes in South Dakota. Shows adjusted nurse hours per resident per day benchmarked to the South Dakota average, with a ranking across 65 South Dakota facilities. More hours mean more direct care. The national average is about 3.5 hrs; below 3.0 is a red flag.Ranking totals vary by category as each rank only includes facilities that report data for that metric. Homes missing that data point aren't included in the ranking.Click the rank badge to see the full State ranking.Click here to see the full State ranking.
This facility South Dakota avg (4h 20m per day)
vs South Dakota avg
-8%

4 of 6 metrics below state avg

Standout metric Physical Therapist is +23% above state avg
Staff typeHours / Day / Residentvs state avg
Registered Nurse (RN) Info RNs hold the highest nursing license and can assess residents, interpret test results, and direct care plans. More RN hours per day often signals stronger clinical oversight and faster response to health changes. 47m per day ■ Avg State avg: 48m per day · National avg: 41m per day
LPN / LVN Info Licensed Practical Nurses (LPNs) or Licensed Vocational Nurses (LVNs) deliver routine hands-on care — medication administration, wound dressing, and monitoring vital signs. They work under RN supervision and make up a large share of daily bedside care. 12m per day ▼ 59% State avg: 29m per day · National avg: 52m per day
Nurse Aide Info Certified Nurse Aides (CNAs) provide the most direct day-to-day assistance: bathing, dressing, feeding, and mobility. Nurse aide hours are typically the largest staffing category and directly affect residents' quality of life. 2h 7m per day ▼ 19% State avg: 2h 37m per day · National avg: 2h 20m per day
Weekend Total Nursing Info Combined nursing hours (RN + LPN + Nurse Aide) per resident per day on weekends. Staffing often drops on weekends — this figure reveals whether the facility maintains adequate coverage outside of weekday hours. 2h 42m per day ▼ 19% State avg: 3h 19m per day · National avg: 3h 26m per day
Physical Therapist Info Hours per resident per day provided by licensed Physical Therapists (PTs) or PT Assistants. PT services help residents recover mobility after injury or illness and are especially important for post-acute (short-stay) rehabilitation. 4m per day ▲ 23% State avg: 3m per day · National avg: 4m per day
Weekend RN Info Registered nurse hours specifically on weekends. Facilities sometimes reduce RN presence on Saturdays and Sundays — a low weekend RN figure compared to weekday hours can indicate reduced clinical oversight when most administrative staff are absent. 28m per day ▼ 10% State avg: 31m per day · National avg: 28m per day

Capacity and availability

Avg. Length of Stay
456 days
Bed community size
46-bed community Rank #80 / 117Bed count — State benchmarkedThis home is ranked 80th out of 117 homes in South Dakota. Shows this facility's certified or reported bed count compared to other South Dakota facilities. Larger communities may offer more amenities, programs, and on-site services for residents and families.Ranking totals vary by category as each rank only includes facilities that report data for that metric. Homes missing that data point aren't included in the ranking.Click the rank badge to see the full State ranking.Click here to see the full State ranking.
A moderately sized community that may balance personal attention with shared amenities and social activities.
Walk Score
Walk Score: 60 / 100 Rank #39 / 159Walk Score — State benchmarkedThis home is ranked 39th out of 159 homes in South Dakota. Shows how walkable this facility's neighborhood is compared to the average Walk Score across South Dakota facilities. Higher scores benefit residents, families, and staff.Ranking totals vary by category as each rank only includes facilities that report data for that metric. Homes missing that data point aren't included in the ranking.Click the rank badge to see the full State ranking.Click here to see the full State ranking.
Moderately walkable. Some errands can be accomplished on foot, with a mix of nearby amenities.

About this community

Occupancy

Occupancy rate
89%
Rank #22 / 62Occupancy rate — State benchmarkedThis home is ranked 22nd out of 62 homes in South Dakota. Shows this facility's occupancy rate versus the South Dakota average, with its Statewide rank out of 62. Higher occupancy signals strong local demand and financial stability.Ranking totals vary by category as each rank only includes facilities that report data for that metric. Homes missing that data point aren't included in the ranking.Click the rank badge to see the full State ranking.Click here to see the full State ranking.
Higher than the South Dakota average: 79.9%
Occupied beds
41 / 46
Average occupied beds in South Dakota homes 51 beds

License Details

Facility TypeNursing Home
StatusActive
IssuanceJuly 1, 2025
CountyMinnehaha
License Number10613
CMS Certification Number435129

Ownership & Operating Entity

Dells Nursing and Rehab Center Inc. is administrated by Calyn Togel.

Therapy & Rehabilitation

2 services
Rehabilitation Services
Short-Term Rehab

Amenities & Lifestyle

Specific Programsshort-term rehab services including physical, occupational, and speech therapy, extensive long-term services including 24-hour quality nursing care, dietary services, and a variety of social activities.

Dining & Nutrition

Food DescriptionThe dietary services include family dining, open breakfast, homemade meals, and meal selections for all meals.

Contact Dells Nursing and Rehab Center Inc.

Health Inspection History

Inspections since 2024
Total health inspections 4

South Dakota average 4.5


Last Health inspection on Jun 2025
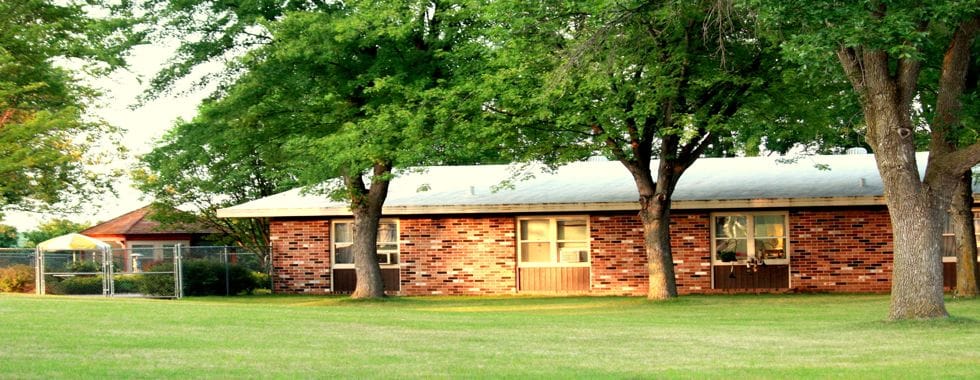
Total health citations
17 Rank #35 / 67Health citations — State benchmarkedThis home is ranked 35th out of 67 homes in South Dakota. Shows this facility's total health deficiency citations benchmarked to the South Dakota State average, with a ranking across all 67 SD facilities. Lower citation counts earn a better rank.Ranking totals vary by category as each rank only includes facilities that report data for that metric. Homes missing that data point aren't included in the ranking.Click the rank badge to see the full State ranking.Click here to see the full State ranking.

South Dakota average 14.8

Citations per inspection
4.25 Rank #51 / 67Citations per inspection — State benchmarkedThis home is ranked 51st out of 67 homes in South Dakota. Shows average deficiency citations per CMS inspection for this facility versus the South Dakota mean across 67 facilities with citation data. Lower is better.Ranking totals vary by category as each rank only includes facilities that report data for that metric. Homes missing that data point aren't included in the ranking.Click the rank badge to see the full State ranking.Click here to see the full State ranking.

South Dakota average 3.34


Health citations are formal notices following inspections when they fail to comply with safety and care standards.

13 of 17 citations resulted from standard inspections; 3 of 17 resulted from complaint investigations; and 1 of 17 came from combined inspections (standard and complaint).

Breakdown of citation severity (last 2 years)
Critical health citations
0
100% better than South Dakota average

South Dakota average: 0.3


Serious health citations
2
11% worse than South Dakota average

South Dakota average: 1.8

0 critical citations South Dakota average: 0.3

2 serious citations South Dakota average: 1.8

15 moderate citations South Dakota average: 12.6

0 minor citations South Dakota average: 0
Citations history (last 2 years)
Infection Control moderate citation Jun 26, 2025
Corrected

Resident Rights moderate citation Jun 26, 2025
Corrected

Abuse/Neglect moderate citation Jan 16, 2025
Corrected

Abuse/Neglect moderate citation Jan 16, 2025
Corrected

Staffing Data

Reporting period: October 1 – December 31, 2025 (Q4 2025). Source: CMS Payroll-Based Journal report.

Total staff 82
Employees 44
Contractors 38
Staff to resident ratio 2.05 : 1
6% more staff per resident than South Dakota average
South Dakota average ratio: 1.93 : 1 South Dakota average ratio: 1.93 : 1See full South Dakota ranking
Avg staff/day 20
Average shift 7.8 hours
0% compared with South Dakota average
South Dakota average: 7.7 hours South Dakota average shift: 7.7 hoursSee full South Dakota ranking
Total staff hours (quarter) 14,353

Nursing staff breakdown

Q4 2025 · Oct 1 – Dec 31 More info This data comes from the CMS Payroll-Based Journal report covering October 1 – December 31, 2025.
Registered Nurse

Manages medical care and health needs.

RN Staff Info 8 total: 5 full-time employees and 3 contractors. 8
Average shift length Info Average shift length. Calculated as total hours divided by days worked and average staff per day. 10.4 hours
Licensed Practical Nurse

Assists with medical care and medications.

LPN Staff Info 4 total: 1 full-time employee and 3 contractors. 4
Average shift length Info Average shift length. Calculated as total hours divided by days worked and average staff per day. 10.5 hours
Certified Nursing Assistant

Helps with daily care and mobility.

CNA Staff Info 35 total: 23 full-time employees and 12 contractors. 35
Average shift length Info Average shift length. Calculated as total hours divided by days worked and average staff per day. 8.1 hours

Contractor staffing

Q4 2025 · Oct 1 – Dec 31 More info This data comes from the CMS Payroll-Based Journal report covering October 1 – December 31, 2025.

Total hours from contractors

50.8%

7,298 contractor hours this quarter

Certified Nursing Assistant: 12 Speech Language Pathologist: 5 Respiratory Therapy Technician: 4 Registered Nurse: 3 Licensed Practical Nurse: 3 Physical Therapy Assistant: 3 Physical Therapy Aide: 2 Qualified Social Worker: 2 Medication Aide/Technician: 1 Medical Director: 1 Occupational Therapy Aide: 1 Other Physician: 1

Staff by category

Q4 2025 · Oct 1 – Dec 31 More info This data comes from the CMS Payroll-Based Journal report covering October 1 – December 31, 2025.
Certified Nursing Assistant2312357,16792100%8.1
Registered Nurse5382,4509199%10.4
Other Dietary Services Staff100101,2348896%6.4
Medication Aide/Technician3148368795%6.3
Licensed Practical Nurse1347556166%10.5
Nurse Practitioner1015206571%8
Physical Therapy Aide0224406773%6.6
Speech Language Pathologist0552704549%4.7
Administrator1012563235%8
Respiratory Therapy Technician0442333841%5.9
Physical Therapy Assistant033823942%1.9
Qualified Social Worker022623033%2
Occupational Therapy Aide0112467%4
Medical Director0111233%4
Other Physician0111233%4
35 Certified Nursing Assistant
% of Days 100%
8 Registered Nurse
% of Days 99%
10 Other Dietary Services Staff
% of Days 96%
4 Medication Aide/Technician
% of Days 95%
4 Licensed Practical Nurse
% of Days 66%
1 Nurse Practitioner
% of Days 71%
2 Physical Therapy Aide
% of Days 73%
5 Speech Language Pathologist
% of Days 49%
1 Administrator
% of Days 35%
4 Respiratory Therapy Technician
% of Days 41%
3 Physical Therapy Assistant
% of Days 42%
2 Qualified Social Worker
% of Days 33%
1 Occupational Therapy Aide
% of Days 7%
1 Medical Director
% of Days 3%
1 Other Physician
% of Days 3%

Penalties and fines

Includes penalties issued in 2024

Federal penalties imposed by CMS for regulatory violations, including civil money penalties (fines) and denials of payment for new Medicare/Medicaid admissions.

Source: CMS Penalties Database (Data as of Jan 2026)

Total fines amount $68K Rank #67 / 67Federal fines — State benchmarkedThis home is ranked 67th out of 67 homes in South Dakota. Shows this facility's cumulative CMS federal fine dollars versus the South Dakota average among facilities with fines, and where it ranks among 67 facilities in the pool. Lower total dollars mean a better rank.Ranking totals vary by category as each rank only includes facilities that report data for that metric. Homes missing that data point aren't included in the ranking.Click the rank badge to see the full State ranking.Click here to see the full State ranking.
71% higher than South Dakota average

South Dakota average: $40K

Number of fines 3
48% more fines than South Dakota average

South Dakota average: 2.0

Payment Denials Info Serious action where Medicare and/or Medicaid temporarily stops payments for new residents until issues are fixed. 0
In line with South Dakota average

South Dakota average: 0.0

Fines amount comparison
This facility $68K
South Dakota average $40K
Penalty History

Penalties are imposed by CMS for violations of federal nursing home regulations.

2 penalties in the past 3 years

Multiple penalties were reported in the last 3 years.

Civil Money Penalty Info Fines imposed for noncompliance, which can be assessed per day or per instance of violation. Aug 8, 2024
$25K
Civil Money Penalty Info Fines imposed for noncompliance, which can be assessed per day or per instance of violation. Feb 12, 2024
$40K

Last updated: Jan 2026

Quality of care over time

These measures show how residents usually do over time at this home, based on health outcomes and preventive care.

High-risk clinical events score Info A composite score based on pressure ulcers, falls with injury, weight loss, walking ability decline, and activities of daily living decline. 15.5
29% worse than South Dakota average

South Dakota average: 12.0

Functional decline score Info A composite score based on activities of daily living decline, walking ability decline, and incontinence. 23.1
In line with South Dakota average

South Dakota average: 23.9

Long-stay resident measures
Significantly below average South Dakota avg: 2.6 Info CMS star rating based on long-stay quality measure performance. 5 stars = significantly above average, 1 star = significantly below average.
Need for Help with Daily Activities Increased Info Percent of long-stay residents whose need for help with daily activities has increased 18.8%
16% better than South Dakota average

South Dakota average: 22.3%

Walking Ability Worsened Info Percent of long-stay residents whose ability to move independently worsened 24.5%
7% worse than South Dakota average

South Dakota average: 22.8%

Low Risk Residents with Bowel/Bladder Incontinence Info Percent of low risk long-stay residents who lose control of their bowels or bladder 26.2%
In line with South Dakota average

South Dakota average: 26.7%

Falls with Major Injury Info Percent of long-stay residents experiencing one or more falls with major injury 23.9%
375% worse than South Dakota average

South Dakota average: 5.0%

High Risk Residents with Pressure Ulcers Info Percent of long-stay high risk residents with pressure ulcers 1.2%
74% better than South Dakota average

South Dakota average: 4.5%

Urinary Tract Infection Info Percent of long-stay residents with a urinary tract infection 1.3%
63% better than South Dakota average

South Dakota average: 3.5%

Lost Too Much Weight Info Percent of long-stay residents who lose too much weight 9.3%
70% worse than South Dakota average

South Dakota average: 5.5%

Depressive Symptoms Info Percent of long-stay residents who have depressive symptoms 0.0%
100% better than South Dakota average

South Dakota average: 4.1%

Antipsychotic Use Info Percent of long-stay residents who received an antipsychotic medication 35.9%
47% worse than South Dakota average

South Dakota average: 24.4%

Pneumococcal Vaccine Info Percent of long-stay residents assessed and appropriately given the pneumococcal vaccine 98.7%
In line with South Dakota average

South Dakota average: 95.7%

Influenza Vaccine Info Percent of long-stay residents assessed and appropriately given the seasonal influenza vaccine 86.4%
11% worse than South Dakota average

South Dakota average: 96.9%

Hospitalizations per 1,000 days Info Number of hospitalizations per 1,000 long-stay resident days. 1.67
11% worse than South Dakota average

South Dakota average: 1.51

ED visits per 1,000 days Info Number of outpatient emergency department visits per 1,000 long-stay resident days. 2.13
15% worse than South Dakota average

South Dakota average: 1.85

Short-stay resident measures
Average South Dakota avg: 2.6 Info CMS star rating based on short-stay quality measure performance. 5 stars = much above average, 1 star = much below average.
Pneumococcal Vaccine Info Percent of short-stay residents assessed and appropriately given the pneumococcal vaccine 92.3%
9% better than South Dakota average

South Dakota average: 84.4%

Antipsychotic medication increase Info Percent of short-stay residents who newly received an antipsychotic medication 6.7%
280% worse than South Dakota average

South Dakota average: 1.8%

Falls with major injury Info Percentage of SNF residents who experience falls with major injury during their stay. 8.1%
953% worse than South Dakota average

South Dakota average: 0.8%

Ability to care for self at discharge Info Percentage of residents at or above expected ability to care for themselves at discharge. 39.3%
27% worse than South Dakota average

South Dakota average: 53.7%

Successful return to home or community Info Rate of successful return to home or community from a skilled nursing facility. 36.0%
29% worse than South Dakota average

South Dakota average: 50.6%

Breakdown by payment type

Medicare

55% of new residents, usually for short-term rehab.

Typical stay 1 - 2 months

Private pay

31% of new residents, often for short stays.

Typical stay 2 years

Medicaid

14% of new residents, often for long-term daily care.

Typical stay 6 years

Facility Characteristics

Source: CMS Long-Term Care Facility Characteristics (Data as of Jan 2026)

Total residents 40
Medicare
2
5% of residents
Medicaid
23
57.5% of residents
Private pay or other
15
37.5% of residents
Programs & Services
Family Member Group

Family members meet regularly to discuss policies, care quality, and activities

Active Family Council

Organized group of family members that meets regularly to discuss facility policies, resident care, and activities.

Finances and operations

Based on CMS SNF Cost Report for fiscal year ending in 12/2023.

Voluntary non-profit community
Operated by a church.
Net patient revenue Info Net patient revenue — what the home actually collects for resident care, after contractual allowances, bad debt and discounts are subtracted from its gross charges (CMS cost report, Worksheet G-3). It covers resident care only; money the home earns from other sources is shown separately as "Other income."
$3.4M
Net patient income Info Net patient income: net patient revenue minus the home's total operating expenses. A positive figure means it earns more from resident care than it spends to deliver it; a negative figure means the opposite. It excludes non-operating "other income."
-$240.8K
Voluntary non-profit community Operated by a church.
Net patient revenue Info Net patient revenue — what the home actually collects for resident care, after contractual allowances, bad debt and discounts are subtracted from its gross charges (CMS cost report, Worksheet G-3). It covers resident care only; money the home earns from other sources is shown separately as "Other income."
$3.4M Rank #56 / 63Revenue — State benchmarkedThis home is ranked 56th out of 63 homes in South Dakota. Shows this facility's annual revenue compared to the South Dakota average. Higher revenue generally means more resources for staffing and capital — read alongside Payroll %.Ranking totals vary by category as each rank only includes facilities that report data for that metric. Homes missing that data point aren't included in the ranking.Click the rank badge to see the full State ranking.Click here to see the full State ranking.
Net patient income Info Net patient income: net patient revenue minus the home's total operating expenses. A positive figure means it earns more from resident care than it spends to deliver it; a negative figure means the opposite. It excludes non-operating "other income."
-$240.8K
Other income Info Money the home earns outside of resident care — such as investments, grants, rentals and other non-operating sources (CMS cost report, Worksheet G-3). It is tracked separately from net patient revenue: it is not part of that figure, and it is not included in net patient income.
$58.5K
Payroll costs Info Staff salaries plus wage-related costs — benefits such as payroll taxes, health insurance and retirement — from the home's own accounting records (CMS cost report, Worksheet A). Contract or agency labor is counted separately, under other operating costs. Rank #45 / 63Payroll — State benchmarkedThis home is ranked 45th out of 63 homes in South Dakota. Shows total annual staff payroll benchmarked to the South Dakota average. Higher payroll investment relative to peers often signals better staffing and less reliance on cheaper contract labor.Ranking totals vary by category as each rank only includes facilities that report data for that metric. Homes missing that data point aren't included in the ranking.Click the rank badge to see the full State ranking.Click here to see the full State ranking.
$1.6M 48.3% of net patient revenue Info Payroll as a share of revenue: staff salaries and wage-related benefits divided by net patient revenue. A higher figure means more of each revenue dollar goes to staff pay. Rank #2 / 63Payroll % — State benchmarkedThis home is ranked 2nd out of 63 homes in South Dakota. Shows payroll as a percentage of revenue versus the South Dakota average. Well-run South Dakota facilities typically land around 64–73% — the top third Statewide. Below 25% may signal understaffing or heavy agency use — read with Staffing ratings.Ranking totals vary by category as each rank only includes facilities that report data for that metric. Homes missing that data point aren't included in the ranking.Click the rank badge to see the full State ranking.Click here to see the full State ranking.
Other operating costs Info Everything it costs to run the home apart from payroll — food, utilities, supplies, maintenance, contract labor and administration. Calculated as total operating expense minus payroll (staff salaries and wage-related benefits).
$2.0M
Total costs Info The home's total operating expense for the year — all the costs of running it, salaries included (CMS cost report, Worksheet G-3).
$3.6M

Who this home usually serves

TYPE OF STAY

Mostly short-term rehab stays

Most residents typically stay for a few weeks or months before returning home or moving on.

Most new residents arrive under Medicare (55% of admissions), and a typical Medicare stay runs around 1 - 2 months.

Admissions
29 total

Coverage residents most often arrive under.

Medicare 55%
Private pay 31%
Medicaid 14%
Discharges
34 total

Coverage residents most often leave under.

Medicare 41%
Private pay 38%
Medicaid 21%

Places of interest near Dells Nursing and Rehab Center Inc.

Address 324.9 miles from city center Info Estimated distance in miles from Dell Rapids's city center to Dells Nursing and Rehab Center Inc.'s address, calculated via Google Maps.

Calculate Travel Distance to Dells Nursing and Rehab Center Inc.

Add your location

Address

Compare Nursing Home around South Dakota

The information below is reported by the South Dakota Department of Health, Office of Health Care Facilities Licensure.

5 facilities compared · CMS & SD Dept. of Health data

Avera Maryhouse
NH
AL
HC
Pierre
67
Facility 67
SD AVG 69
Rank #49 / 117
--
5.30
Facility 5.30
SD AVG 4.34
Rank #7 / 65
+18%+22%
$0
Facility $0
SD AVG $38.5k
Rank #1 / 67
9
Facility 9
SD AVG 14.8
Rank #17 / 67
2.3
Facility 2.3
SD AVG 3.3
Rank #20 / 67
-59-
60
Facility 60
SD AVG 39
Rank #39 / 159
----435034
Dells Nursing and Rehab Center Inc.
NH
Dell Rapids
46
Facility 46
SD AVG 69
Rank #80 / 117
88.5%
Facility 88.5%
SD AVG 79.9%
Rank #22 / 62
+11%
4.01
Facility 4.01
SD AVG 4.34
Rank #23 / 65
-12%-8%
$173.0k
Facility $173.0k
SD AVG $38.5k
Rank #67 / 67
17
Facility 17
SD AVG 14.8
Rank #35 / 67
4.3
Facility 4.3
SD AVG 3.3
Rank #51 / 67
241-
60
Facility 60
SD AVG 39
Rank #39 / 159
Stroschein Properties LLC
$3.4M
Facility $3.4M
SD AVG $6.7M
Rank #56 / 63
$1.6M
Facility $1.6M
SD AVG $2.6M
Rank #45 / 63
48.3%
Facility 48.3%
SD AVG 40.8%
Rank #2 / 63
435129
Bethesda Home of Aberdeen
NH
AL
HC
NC
RC
Aberdeen (Melrose Addition)
86
Facility 86
SD AVG 69
Rank #27 / 117
92.8%
Facility 92.8%
SD AVG 79.9%
Rank #10 / 62
+16%
4.38
Facility 4.38
SD AVG 4.34
Rank #19 / 65
-22%+1%
$0
Facility $0
SD AVG $38.5k
Rank #1 / 67
7
Facility 7
SD AVG 14.8
Rank #9 / 67
2.3
Facility 2.3
SD AVG 3.3
Rank #20 / 67
-85-
12
Facility 12
SD AVG 39
Rank #127 / 159
Scott Eisenbeisz
$9.7M
Facility $9.7M
SD AVG $6.7M
Rank #17 / 63
$7.2M
Facility $7.2M
SD AVG $2.6M
Rank #5 / 63
74.3%
Facility 74.3%
SD AVG 40.8%
Rank #6 / 63
435073
Fountain Springs Healthcare Center
NH
AL
IL
Rapid City
10
Facility 10
SD AVG 69
Rank #116 / 117
87.3%
Facility 87.3%
SD AVG 79.9%
Rank #24 / 62
+9%
3.82
Facility 3.82
SD AVG 4.34
Rank #33 / 65
-2%-12%
$22.5k
Facility $22.5k
SD AVG $38.5k
Rank #40 / 67
11
Facility 11
SD AVG 14.8
Rank #21 / 67
1.6
Facility 1.6
SD AVG 3.3
Rank #12 / 67
282-
16
Facility 16
SD AVG 39
Rank #120 / 159
-
$6.8M
Facility $6.8M
SD AVG $6.7M
Rank #26 / 63
$3.1M
Facility $3.1M
SD AVG $2.6M
Rank #27 / 63
45.6%
Facility 45.6%
SD AVG 40.8%
Rank #31 / 63
435110
Avera Mother Joseph Manor Retirement Community
NH
AL
HC
IL
Aberdeen
81
Facility 81
SD AVG 69
Rank #32 / 117
--
4.62
Facility 4.62
SD AVG 4.34
Rank #14 / 65
-24%+6%
$8.8k
Facility $8.8k
SD AVG $38.5k
Rank #18 / 67
12
Facility 12
SD AVG 14.8
Rank #26 / 67
1.7
Facility 1.7
SD AVG 3.3
Rank #13 / 67
376-
31
Facility 31
SD AVG 39
Rank #93 / 159
----435042

Financial Assistance for
Nursing Home in South Dakota

Dells Nursing and Rehab Center Inc. is located in Dell Rapids, South Dakota.
Here are the financial assistance programs available to residents in South Dakota.

Get Financial aid guidance

Home and Community Based Services Waiver

SD Medicaid HCBS Waiver

Age 65+ or disabled
General South Dakota resident, Medicaid-eligible, nursing home-level care need.
Income Limits (2025) ~$2,829/month 300% FBR, individual
Asset Limits $2,000 (individual), $3,000 (couple).
SD

Sparse population aids rural access; limited providers.

Benefits
Personal care (5-7 hours/day) Respite (240 hours/year) Adult day care (~$60/day) Home aides

South Dakota Elderly Services Program

SD ESP

Age 60+
General South Dakota resident, at risk of decline.
Income Limits ~$1,732/month individual, varies
Asset Limits $5,000 individual
SD

Limited funding; rural focus.

Benefits
In-home care (2-4 hours/week) Respite (up to 5 days/year) Transportation (~5 trips/month)

Medicare Savings Program (MSP)

South Dakota Medicare Savings Program

Age 65+ or disabled
General SD resident, Medicare Part A/B.
Income Limits (2025) ~$2,510/month (QMB), ~$3,380/month (SLMB), ~$3,598/month (QI)—individual.
Asset Limits $9,430 (individual), $14,130 (couple).
SD

Three tiers; includes Extra Help for Part D; no waitlist.

Benefits
Covers Part B premiums ($174.70/month) Deductibles ($240/year) Copays (~20%)

Low-Income Home Energy Assistance Program (LIEAP)

South Dakota LIEAP

Age 60+ prioritized
General SD resident, low-income household.
Income Limits (2025) ~$3,970/month individual, 185% FPL
Asset Limits Not assessed; income-focused.
SD

Covers gas, electric, propane; weatherization add-on available.

Benefits
Heating/cooling aid ($300-$1,000/season) Emergency aid ($500 max)

Family Caregiver Support Program (FCSP)

South Dakota Family Caregiver Support Program

Age
General Caregivers of 60+ needing care or 55+ caregivers of others; SD resident; functional needs (2+ ADLs).
Income Limits (2025) No strict cap; prioritizes low-income ~$24,980/year
Asset Limits Not assessed; need-based.
SD

Rural emphasis; includes grandparent caregivers.

Benefits
Respite (4-6 hours/week or 5 days/year) Adult day care ($60/day) Training Supplies (~$500/year)

VA Aid and Attendance (A&A) and Housebound Benefits

South Dakota VA Aid and Attendance/Housebound

Age 65+ or disabled veteran/spouse
General SD resident, wartime service, need for ADL help (A&A) or homebound.
Income Limits (2025) Net income < ~$1,984/month (veteran with dependent, A&A); pension offsets income.
Asset Limits ~$155,356 net worth limit
SD

Supports rural veterans; high demand near Sioux Falls VA.

Benefits
Cash (~$1,433-$2,642/month veteran, ~$951-$1,318 spouse) for care costs (e.g., in-home, assisted living)

Property Tax Reduction Program

South Dakota Property Tax Reduction from Municipal Taxes

Age 65+ (or disabled) by Jan 1
General SD resident entire prior year, homeowner/renter.
Income Limits (2025) ~$20,192/year (single), ~$24,679/year (multiple-member household).
Asset Limits Not assessed; income-focused.
SD

Refunds up to $575; ~10,000 seniors benefit annually.

Benefits
Tax refund (~$250-$575/year based on income)

Senior Farmers’ Market Nutrition Program (SFMNP)

South Dakota SFMNP

Age 60+
General SD resident, low-income.
Income Limits (2025) ~$2,322/month individual, 185% FPL
Asset Limits Not assessed.
SD

Vouchers (~$50/season); serves ~5,000 annually via 6 AAAs.

Benefits
Vouchers (~$50/season) for fresh produce at approved markets

Freeze on Assessments for Dwellings of Disabled and Senior Citizens

South Dakota Property Tax Freeze

Age 65+ (or disabled)
General SD resident 200+ days prior year, homeowner.
Income Limits (2025) ~$35,000/year (single), ~$45,000/year (multiple-member household).
Asset Limits Property value < $250,000 (single), $300,000 (multiple).
SD

Saves ~$300-$600/year avg.; applies to primary residence.

Benefits
Assessment freeze (~$300-$600/year savings)

Older Americans Act (OAA) Services

South Dakota OAA Services

Age 60+
General SD resident (or spouse of any age); no income/asset limits.
Income Limits (2025) None; donations encouraged for some services.
Asset Limits Not assessed.
SD

6 AAAs; rural focus due to sparse population.

Benefits
Meals (home-delivered or congregate, ~$5-$7/meal value) Transportation Homemaker services (~4 hours/week) Respite (~5 days/year) Legal aid

Frequently Asked Questions about Dells Nursing and Rehab Center Inc.

Is Dells Nursing and Rehab Center Inc. in a walkable area?

Dells Nursing and Rehab Center Inc. has a walk score of 60. Moderately walkable. Some errands can be accomplished on foot, with a mix of nearby amenities.

What is the license number of Dells Nursing and Rehab Center Inc.?

According to SD state health department records, Dells Nursing and Rehab Center Inc.'s license number is 10613.

What is the occupancy rate at Dells Nursing and Rehab Center Inc.?

Dells Nursing and Rehab Center Inc.'s occupancy is 89%.

Who is the administrator of Dells Nursing and Rehab Center Inc.?

Calyn Togel is the administrator of Dells Nursing and Rehab Center Inc..

How many beds does Dells Nursing and Rehab Center Inc. have?

Dells Nursing and Rehab Center Inc. has 46 beds.

Are there photos of Dells Nursing and Rehab Center Inc.?

Yes — there is 1 photo of Dells Nursing and Rehab Center Inc. in the photo gallery on this page.

What is the address of Dells Nursing and Rehab Center Inc.?

Dells Nursing and Rehab Center Inc. is located at 1400 Thresher Dr.

Guides for Better Senior Living

Care Cost Calculator: See Prices in Your Area

Nursing Home Data Explorer

Don’t Wait Too Long: 7 Red Flag Signs Your Parent Needs Assisted Living Now

The True Cost of Assisted Living in 2025 – And How Families Are Paying For It

Understanding Senior Living Costs: Pricing Models, Discounts & Financial Assistance