Bethany Home Sioux Falls/Bethany Home-Brandon
Nursing Home, Assisted Living, Independent Living & Memory Care · Sioux Falls, SD
CMS overall rating Info CMS (the Centers for Medicare & Medicaid Services) is the federal agency that rates nursing home quality. Its Overall Rating runs from 1 to 5 stars, combining health inspections, staffing, and quality measures, with inspections weighted most heavily.

Bethany Home Sioux Falls/Bethany Home-Brandon

Nursing Home, Assisted Living, Independent Living & Memory Care · Sioux Falls, SD
CMS overall rating Info CMS (the Centers for Medicare & Medicaid Services) is the federal agency that rates nursing home quality. Its Overall Rating runs from 1 to 5 stars, combining health inspections, staffing, and quality measures, with inspections weighted most heavily.
Calculator: See prices in your area
Bethany Home Sioux Falls/Bethany Home-Brandon accepts Medicare, Medicaid, and private pay.

Overview of Bethany Home Sioux Falls/bethany Home-Brandon

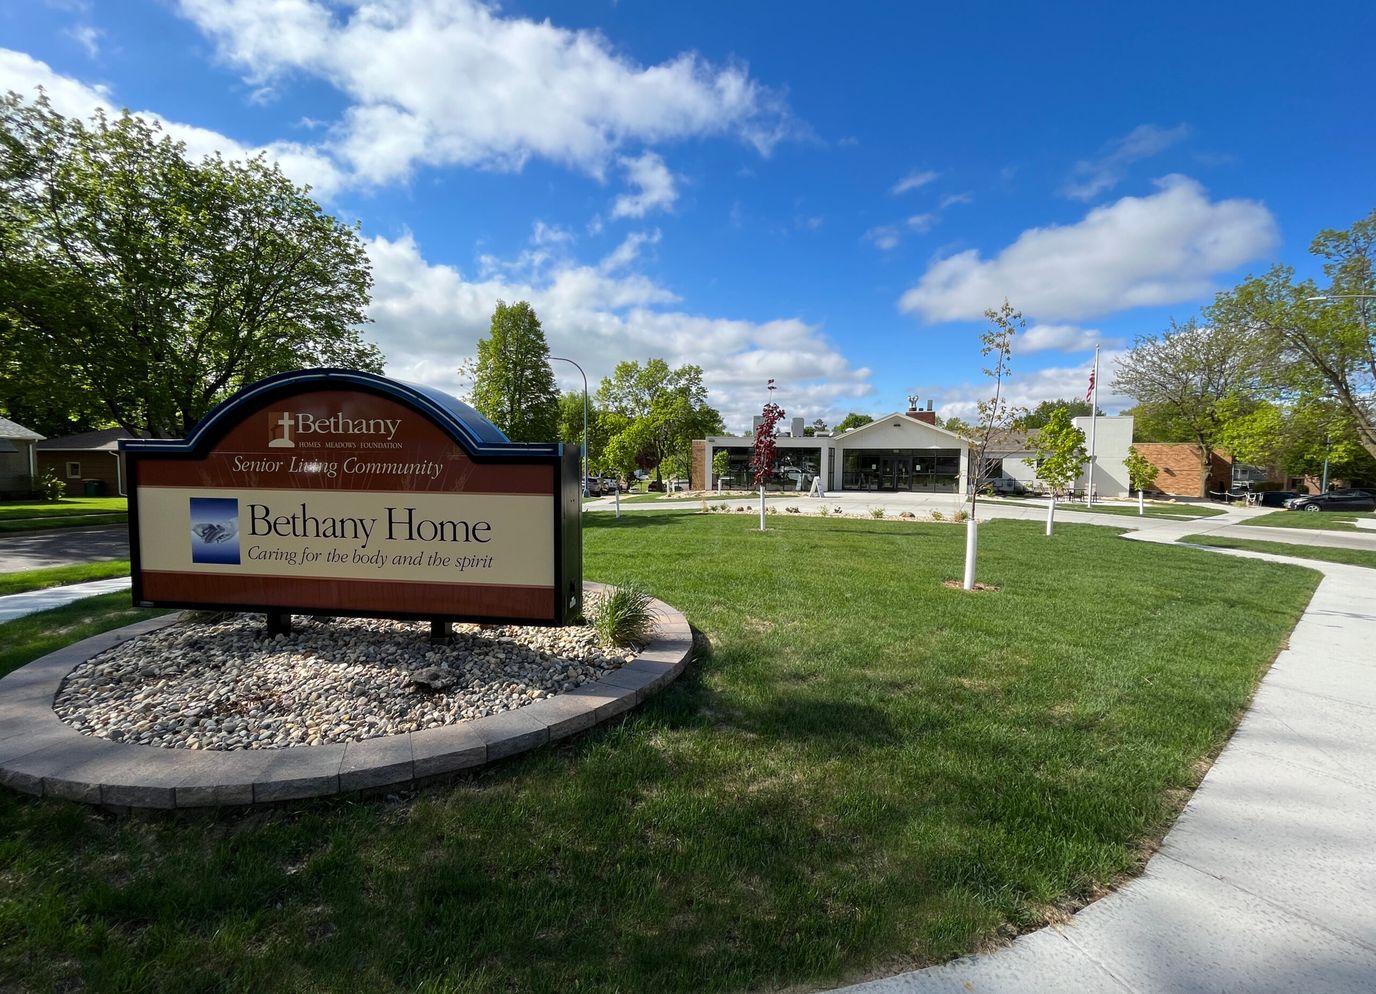
Bethany Home Sioux Falls / Bethany Home-Brandon is a faith-based nursing home in Sioux Falls, South Dakota, offering a continuum of care that includes independent living, assisted living, skilled nursing services, and rehabilitation. The 112-bed community is administered by Amanda Peterson in Minnehaha County, guided by a Christian mission. It also emphasizes support for residents’ physical, emotional, social, and spiritual well-being while also offering independent homes and apartment living as part of its larger campus environment.

The community is currently operating at 78.5%, which is slightly lower than the state average of 79.9%, and suggests availability. Additionally, Medicare accounts for 89% of new residents, with an average stay of 25 days, reflecting a focus on short-term rehabilitation. Meanwhile, private pay new residents are approximately 10%, with an average stay of 7 to 8 months, and 2% of new residents are Medicaid-eligible, with a typical stay of 6 years.

Since 2022, the community has undergone four total health inspections, with the latest conducted in October 2025, which is notably lower than the state average. A total of 13 health citations have been recorded throughout its operational history, which is also lower than the state average, and has been corrected. No penalties have been issued in the past three years.

Confirmed services include skilled nursing care and rehabilitation therapy, along with independent living options designed for older adults who remain largely self-sufficient but prefer a supportive community setting. Its faith-centered approach is a defining aspect of the community’s culture and may be particularly meaningful for individuals and families seeking care rooted in Christian values and holistic support.

Located on the south side of Sioux Falls, the community sits in a moderately walkable area with a Walk Score of 65, allowing access to some nearby services and amenities on foot. Service to the Brandon area also provides additional convenience for families throughout eastern Minnehaha County.

Bethany Home Sioux Falls / Bethany Home-Brandon is an ideal option for families seeking values-based care within a setting that supports aging across different levels of assistance and medical support. The ability to transition from independent living to higher levels of care within the same community can help reduce disruption and provide continuity for older adults as healthcare needs progress.

Quality ratings

Measured by Centers for Medicare & Medicaid Services (CMS)

Overall rating Info The Overall CMS Rating combines results from health inspections, staffing levels and quality measures. Health inspections carry the most weight. Staffing and quality scores can increase or decrease the final rating based on performance compared to state and national standards.
▲ 84.1% Above SD avg. ▲ 84.1% Above SD avg.SD average: 2.7Click the badge to see the full State ranking.Click here to see the full State ranking.
Health Inspection Info Based on the results of the facility's three most recent standard inspections and any complaint investigations. CMS reviews the number, scope, and severity of deficiencies, with more recent findings weighted more heavily.
▲ 47.9% Above SD avg. ▲ 47.9% Above SD avg.SD average: 2.7Click the badge to see the full State ranking.Click here to see the full State ranking.
Staffing Info Measures average nursing staff hours per resident per day, including Registered Nurses (RNs) and total nursing staff. Ratings are adjusted based on the level of care residents require and are compared to state and national benchmarks.
▲ 50.8% Above SD avg. ▲ 50.8% Above SD avg.SD average: 3.3Click the badge to see the full State ranking.Click here to see the full State ranking.
Quality Measures Info Based on clinical and physical health indicators reported to CMS, such as hospital readmissions, falls, pressure ulcers, and improvements in mobility. These measures reflect how well residents' health needs are being managed.
▼ 26.6% Below SD avg. ▼ 26.6% Below SD avg.SD average: 2.7Click the badge to see the full State ranking.Click here to see the full State ranking.

Staffing hours breakdown

Info Daily nursing hours per resident by staff type, reported to CMS. Higher is generally better — compare this facility to state and national averages to see where staffing stands.

Hours per resident per day — compared to South Dakota state averages

Total nursing care / resident Info This home is ranked 5th out of 65 homes in South Dakota for nurse hours. Total adjusted nursing hours per resident per day, combining RN, LPN, and aide time. CMS adjusts this for case-mix so facilities can be fairly compared.
5h 28m per day
Rank #5 / 65Nurse hours — State benchmarkedThis home is ranked 5th out of 65 homes in South Dakota. Shows adjusted nurse hours per resident per day benchmarked to the South Dakota average, with a ranking across 65 South Dakota facilities. More hours mean more direct care. The national average is about 3.5 hrs; below 3.0 is a red flag.Rankings are based only on facilities in South Dakota that report data for that category. Facilities without available data are excluded from the ranking.Click the rank badge to see the full State ranking.Click here to see the full State ranking.
This facility South Dakota avg (4h 20m per day)
vs South Dakota avg
+26%

2 of 6 metrics below state avg

Standout metric Physical Therapist is +116% above state avg
Staff typeHours / Day / Residentvs state avg
Registered Nurse (RN) Info RNs hold the highest nursing license and can assess residents, interpret test results, and direct care plans. More RN hours per day often signals stronger clinical oversight and faster response to health changes. 47m per day ▼ 4% State avg: 49m per day · National avg: 41m per day
LPN / LVN Info Licensed Practical Nurses (LPNs) or Licensed Vocational Nurses (LVNs) deliver routine hands-on care — medication administration, wound dressing, and monitoring vital signs. They work under RN supervision and make up a large share of daily bedside care. 55m per day ▲ 94% State avg: 29m per day · National avg: 52m per day
Nurse Aide Info Certified Nurse Aides (CNAs) provide the most direct day-to-day assistance: bathing, dressing, feeding, and mobility. Nurse aide hours are typically the largest staffing category and directly affect residents' quality of life. 3h 34m per day ▲ 39% State avg: 2h 34m per day · National avg: 2h 20m per day
Weekend Total Nursing Info Combined nursing hours (RN + LPN + Nurse Aide) per resident per day on weekends. Staffing often drops on weekends — this figure reveals whether the facility maintains adequate coverage outside of weekday hours. 4h 38m per day ▲ 37% State avg: 3h 23m per day · National avg: 3h 27m per day
Physical Therapist Info Hours per resident per day provided by licensed Physical Therapists (PTs) or PT Assistants. PT services help residents recover mobility after injury or illness and are especially important for post-acute (short-stay) rehabilitation. 7m per day ▲ 116% State avg: 3m per day · National avg: 4m per day
Weekend RN Info Registered nurse hours specifically on weekends. Facilities sometimes reduce RN presence on Saturdays and Sundays — a low weekend RN figure compared to weekday hours can indicate reduced clinical oversight when most administrative staff are absent. 24m per day ▼ 22% State avg: 31m per day · National avg: 29m per day

Capacity and availability

Avg. Length of Stay
90 days
Bed community size
112-bed community Rank #11 / 117Bed count — State benchmarkedThis home is ranked 11th out of 117 homes in South Dakota. Shows this facility's certified or reported bed count compared to other South Dakota facilities. Larger communities may offer more amenities, programs, and on-site services for residents and families.Rankings are based only on facilities in South Dakota that report data for that category. Facilities without available data are excluded from the ranking.Click the rank badge to see the full State ranking.Click here to see the full State ranking.
A larger shared setting that may offer more common spaces and organized community services.
Walk Score
Walk Score: 65 / 100 Rank #25 / 159Walk Score — State benchmarkedThis home is ranked 25th out of 159 homes in South Dakota. Shows how walkable this facility's neighborhood is compared to the average Walk Score across South Dakota facilities. Higher scores benefit residents, families, and staff.Rankings are based only on facilities in South Dakota that report data for that category. Facilities without available data are excluded from the ranking.Click the rank badge to see the full State ranking.Click here to see the full State ranking.
Moderately walkable. Some errands can be accomplished on foot, with a mix of nearby amenities.

About this community

Occupancy

Occupancy rate
79%
Rank #39 / 62Occupancy rate — State benchmarkedThis home is ranked 39th out of 62 homes in South Dakota. Shows this facility's occupancy rate versus the South Dakota average, with its Statewide rank out of 62. Higher occupancy signals strong local demand and financial stability.Rankings are based only on facilities in South Dakota that report data for that category. Facilities without available data are excluded from the ranking.Click the rank badge to see the full State ranking.Click here to see the full State ranking.
Similar to the South Dakota average: 79.9%
Occupied beds
88 / 112
Average occupied beds in South Dakota homes 51 beds

License Details

Facility TypeNursing Home
StatusActive
IssuanceJuly 1, 2025
ExpirationJune 30, 2026 Expires in 7 days
CountyMinnehaha
License Number10677

Ownership & Operating Entity

Bethany Home Sioux Falls/Bethany Home-Brandon is administered by Amanda Peterson.

Therapy & Rehabilitation

1 service
Rehabilitation Services

Additional Services

1 service
Skilled Nursing Care

Amenities & Lifestyle

Specific ProgramsIndependent Homes & Apartments

Contact Bethany Home Sioux Falls/Bethany Home-Brandon

Health Inspection History

Inspections since 2022
Total health inspections 4

South Dakota average 4.5


Last Health inspection on Oct 2025

Total health citations
13 Rank #28 / 67Health citations — State benchmarkedThis home is ranked 28th out of 67 homes in South Dakota. Shows this facility's total health deficiency citations benchmarked to the South Dakota State average, with a ranking across all 67 SD facilities. Lower citation counts earn a better rank.Rankings are based only on facilities in South Dakota that report data for that category. Facilities without available data are excluded from the ranking.Click the rank badge to see the full State ranking.Click here to see the full State ranking.

South Dakota average 14.8

Citations per inspection
3.25 Rank #36 / 67Citations per inspection — State benchmarkedThis home is ranked 36th out of 67 homes in South Dakota. Shows average deficiency citations per CMS inspection for this facility versus the South Dakota mean across 67 facilities with citation data. Lower is better.Rankings are based only on facilities in South Dakota that report data for that category. Facilities without available data are excluded from the ranking.Click the rank badge to see the full State ranking.Click here to see the full State ranking.

South Dakota average 3.34


Health citations are formal notices following inspections when they fail to comply with safety and care standards.

11 of 13 citations resulted from standard inspections; and 2 of 13 resulted from complaint investigations.

Breakdown of citation severity (last 4 years)
Critical health citations
0
100% better than South Dakota average

South Dakota average: 0.3


Serious health citations
1
44% better than South Dakota average

South Dakota average: 1.8

0 critical citations South Dakota average: 0.3

1 serious citation South Dakota average: 1.8

12 moderate citations South Dakota average: 12.6

0 minor citations South Dakota average: 0
Citations history (last 4 years)
Quality of Care serious citation Oct 29, 2025

Abuse/Neglect moderate citation Nov 07, 2024
Corrected

Nutrition moderate citation Nov 07, 2024
Corrected

Nutrition moderate citation Nov 07, 2024
Corrected

Staffing Data

Reporting period: October 1 – December 31, 2025 (Q4 2025). Source: CMS Payroll-Based Journal report.

Total staff 96
Employees 71
Contractors 25
Staff to resident ratio 2.46 : 1
28% more staff per resident than South Dakota average
South Dakota average ratio: 1.93 : 1 South Dakota average ratio: 1.93 : 1See full South Dakota ranking
Avg staff/day 35
Average shift 7.2 hours
6% worse than South Dakota average
South Dakota average: 7.7 hours South Dakota average shift: 7.7 hoursSee full South Dakota ranking
Total staff hours (quarter) 23,036

Nursing staff breakdown

Q4 2025 · Oct 1 – Dec 31 More info This data comes from the CMS Payroll-Based Journal report covering October 1 – December 31, 2025.
Registered Nurse

Manages medical care and health needs.

RN Staff Info All 9 RN Staff are full-time employees. No contractors work on this role. 9
Average shift length Info Average shift length. Calculated as total hours divided by days worked and average staff per day. 6.6 hours
Licensed Practical Nurse

Assists with medical care and medications.

LPN Staff Info All 12 LPN Staff are full-time employees. No contractors work on this role. 12
Average shift length Info Average shift length. Calculated as total hours divided by days worked and average staff per day. 8.7 hours
Certified Nursing Assistant

Helps with daily care and mobility.

CNA Staff Info All 45 CNA Staff are full-time employees. No contractors work on this role. 45
Average shift length Info Average shift length. Calculated as total hours divided by days worked and average staff per day. 7.9 hours

Contractor staffing

Q4 2025 · Oct 1 – Dec 31 More info This data comes from the CMS Payroll-Based Journal report covering October 1 – December 31, 2025.

Total hours from contractors

7.7%

1,778 contractor hours this quarter

Respiratory Therapy Technician: 6 Qualified Social Worker: 5 Speech Language Pathologist: 4 Physical Therapy Assistant: 4 Physical Therapy Aide: 3 Occupational Therapy Aide: 1 Occupational Therapy Assistant: 1 Medical Director: 1

Staff by category

Q4 2025 · Oct 1 – Dec 31 More info This data comes from the CMS Payroll-Based Journal report covering October 1 – December 31, 2025.
Certified Nursing Assistant4504513,97892100%7.9
Licensed Practical Nurse120123,62492100%8.7
Registered Nurse9092,09292100%6.6
Administrator1015286672%8
Clinical Nurse Specialist2025116571%4
Nurse Practitioner1014926368%7.8
Respiratory Therapy Technician0664336874%4.9
Physical Therapy Assistant0443956368%6
Qualified Social Worker0553836672%3.7
Speech Language Pathologist0442135863%2.8
Physical Therapy Aide0331965964%3
Occupational Therapy Aide0111311820%7.3
Dietitian1013255%6.4
Occupational Therapy Assistant0112633%8.5
Medical Director011211%2
45 Certified Nursing Assistant
% of Days 100%
12 Licensed Practical Nurse
% of Days 100%
9 Registered Nurse
% of Days 100%
1 Administrator
% of Days 72%
2 Clinical Nurse Specialist
% of Days 71%
1 Nurse Practitioner
% of Days 68%
6 Respiratory Therapy Technician
% of Days 74%
4 Physical Therapy Assistant
% of Days 68%
5 Qualified Social Worker
% of Days 72%
4 Speech Language Pathologist
% of Days 63%
3 Physical Therapy Aide
% of Days 64%
1 Occupational Therapy Aide
% of Days 20%
1 Dietitian
% of Days 5%
1 Occupational Therapy Assistant
% of Days 3%
1 Medical Director
% of Days 1%

Penalties and fines

Federal penalties imposed by CMS for regulatory violations, including civil money penalties (fines) and denials of payment for new Medicare/Medicaid admissions.

Source: CMS Penalties Database

No penalties in the past 3 years

No civil money penalties or payment denials were reported in the last 3 years.

Quality of care over time

These measures show how residents usually do over time at this home, based on health outcomes and preventive care.

High-risk clinical events score Info A composite score based on pressure ulcers, falls with injury, weight loss, walking ability decline, and activities of daily living decline. 13.7
14% worse than South Dakota average

South Dakota average: 12.0

Functional decline score Info A composite score based on activities of daily living decline, walking ability decline, and incontinence. 29.8
24% worse than South Dakota average

South Dakota average: 23.9

Long-stay resident measures
Need for Help with Daily Activities Increased Info Percent of long-stay residents whose need for help with daily activities has increased 24.3%
9% worse than South Dakota average

South Dakota average: 22.3%

Walking Ability Worsened Info Percent of long-stay residents whose ability to move independently worsened 28.3%
24% worse than South Dakota average

South Dakota average: 22.8%

Low Risk Residents with Bowel/Bladder Incontinence Info Percent of low risk long-stay residents who lose control of their bowels or bladder 36.6%
37% worse than South Dakota average

South Dakota average: 26.7%

Falls with Major Injury Info Percent of long-stay residents experiencing one or more falls with major injury 7.4%
47% worse than South Dakota average

South Dakota average: 5.0%

High Risk Residents with Pressure Ulcers Info Percent of long-stay high risk residents with pressure ulcers 5.4%
20% worse than South Dakota average

South Dakota average: 4.5%

Urinary Tract Infection Info Percent of long-stay residents with a urinary tract infection 0.9%
75% better than South Dakota average

South Dakota average: 3.5%

Lost Too Much Weight Info Percent of long-stay residents who lose too much weight 2.9%
46% better than South Dakota average

South Dakota average: 5.5%

Depressive Symptoms Info Percent of long-stay residents who have depressive symptoms 5.7%
40% worse than South Dakota average

South Dakota average: 4.1%

Antipsychotic Use Info Percent of long-stay residents who received an antipsychotic medication 10.7%
56% better than South Dakota average

South Dakota average: 24.4%

Pneumococcal Vaccine Info Percent of long-stay residents assessed and appropriately given the pneumococcal vaccine 96.7%
In line with South Dakota average

South Dakota average: 95.7%

Influenza Vaccine Info Percent of long-stay residents assessed and appropriately given the seasonal influenza vaccine 63.6%
34% worse than South Dakota average

South Dakota average: 96.9%

Short-stay resident measures
Pneumococcal Vaccine Info Percent of short-stay residents assessed and appropriately given the pneumococcal vaccine 92.9%
10% better than South Dakota average

South Dakota average: 84.4%

Antipsychotic medication increase Info Percent of short-stay residents who newly received an antipsychotic medication 1.6%
12% better than South Dakota average

South Dakota average: 1.8%

Influenza Vaccine Info Percent of short-stay residents assessed and appropriately given the seasonal influenza vaccine 86.6%
11% better than South Dakota average

South Dakota average: 78.2%

Breakdown by payment type

Medicare

89% of new residents, usually for short-term rehab.

Typical stay 25 days

Private pay

10% of new residents, often for short stays.

Typical stay 7 - 8 months

Medicaid

2% of new residents, often for long-term daily care.

Typical stay 6 years

Facility Characteristics

Source: CMS Long-Term Care Facility Characteristics (Data as of Jan 2026)

Total residents 39
Medicare
7
17.9% of residents
Medicaid
21
53.8% of residents
Private pay or other
11
28.2% of residents
Programs & Services
Residents Group

Residents meet regularly to discuss policies, care quality, and activities

Nurse Aide Training

State-approved Nurse Aide Training and Competency Evaluation Program on-site

Active Resident Council

Organized group of residents that meets regularly to discuss facility policies, quality of life, and activities.

Finances and operations

Based on CMS SNF Cost Report for fiscal year ending in 06/2024.

Governmental community
Operated by a subsidized facility district.
Net patient revenue Info Net patient revenue — what the home actually collects for resident care, after contractual allowances, bad debt and discounts are subtracted from its gross charges (CMS cost report, Worksheet G-3). It covers resident care only; money the home earns from other sources is shown separately as "Other income."
$5.9M
Net patient income Info Net patient income: net patient revenue minus the home's total operating expenses. A positive figure means it earns more from resident care than it spends to deliver it; a negative figure means the opposite. It excludes non-operating "other income."
-$1.2M
Governmental community Operated by a subsidized facility district.
Net patient revenue Info Net patient revenue — what the home actually collects for resident care, after contractual allowances, bad debt and discounts are subtracted from its gross charges (CMS cost report, Worksheet G-3). It covers resident care only; money the home earns from other sources is shown separately as "Other income."
$5.9M Rank #39 / 63Revenue — State benchmarkedThis home is ranked 39th out of 63 homes in South Dakota. Shows this facility's annual revenue compared to the South Dakota average. Higher revenue generally means more resources for staffing and capital — read alongside Payroll %.Rankings are based only on facilities in South Dakota that report data for that category. Facilities without available data are excluded from the ranking.Click the rank badge to see the full State ranking.Click here to see the full State ranking.
Net patient income Info Net patient income: net patient revenue minus the home's total operating expenses. A positive figure means it earns more from resident care than it spends to deliver it; a negative figure means the opposite. It excludes non-operating "other income."
-$1.2M
Other income Info Money the home earns outside of resident care — such as investments, grants, rentals and other non-operating sources (CMS cost report, Worksheet G-3). It is tracked separately from net patient revenue: it is not part of that figure, and it is not included in net patient income.
$307.9K
Payroll costs Info Staff salaries plus wage-related costs — benefits such as payroll taxes, health insurance and retirement — from the home's own accounting records (CMS cost report, Worksheet A). Contract or agency labor is counted separately, under other operating costs. Rank #22 / 63Payroll — State benchmarkedThis home is ranked 22nd out of 63 homes in South Dakota. Shows total annual staff payroll benchmarked to the South Dakota average. Higher payroll investment relative to peers often signals better staffing and less reliance on cheaper contract labor.Rankings are based only on facilities in South Dakota that report data for that category. Facilities without available data are excluded from the ranking.Click the rank badge to see the full State ranking.Click here to see the full State ranking.
$4.1M 68.6% of net patient revenue Info Payroll as a share of revenue: staff salaries and wage-related benefits divided by net patient revenue. A higher figure means more of each revenue dollar goes to staff pay. Rank #12 / 63Payroll % — State benchmarkedThis home is ranked 12th out of 63 homes in South Dakota. Shows payroll as a percentage of revenue versus the South Dakota average. Well-run South Dakota facilities typically land around 64–73% — the top third Statewide. Below 25% may signal understaffing or heavy agency use — read with Staffing ratings.Rankings are based only on facilities in South Dakota that report data for that category. Facilities without available data are excluded from the ranking.Click the rank badge to see the full State ranking.Click here to see the full State ranking.
Other operating costs Info Everything it costs to run the home apart from payroll — food, utilities, supplies, maintenance, contract labor and administration. Calculated as total operating expense minus payroll (staff salaries and wage-related benefits).
$3.1M
Total costs Info The home's total operating expense for the year — all the costs of running it, salaries included (CMS cost report, Worksheet G-3).
$7.1M

Who this home usually serves

TYPE OF STAY

Mostly short-term rehab stays

Most residents typically stay for a few weeks or months before returning home or moving on.

Most new residents arrive under Medicare (89% of admissions), and a typical Medicare stay runs around 25 days.

Admissions
167 total

Coverage residents most often arrive under.

Medicare 89%
Private pay 10%
Medicaid 2%
Discharges
167 total

Coverage residents most often leave under.

Medicare 86%
Private pay 8%
Medicaid 6%

Places of interest near Bethany Home Sioux Falls/Bethany Home-Brandon

Address 161.7 miles from city center Info Estimated distance in miles from Sioux Falls's city center to Bethany Home Sioux Falls/Bethany Home-Brandon's address, calculated via Google Maps.

Calculate Travel Distance to Bethany Home Sioux Falls/Bethany Home-Brandon

Add your location

Address

Compare Nursing Homes around Sioux Falls

The information below is reported by the South Dakota Department of Health, Office of Health Care Facilities Licensure.

5 facilities compared · CMS & SD Dept. of Health data

Tuff Memorial Home
NH
Sioux Falls
48
Facility 48
SD AVG 69
Rank #76 / 117
78.0% -2%4.78 -24%0%$44.4k133.3-38-
8
Facility 8
SD AVG 39
Rank #139 / 159
Alex Dysthe$4.0M$2.7M67.9%245548
Bethany Home Sioux Falls/Bethany Home-Brandon
NH
AL
IL
MC
Sioux Falls
112
Facility 112
SD AVG 69
Rank #11 / 117
78.5%
Facility 78.5%
SD AVG 79.9%
Rank #39 / 62
-2%
5.47
Facility 5.47
SD AVG 4.34
Rank #5 / 65
-15%+26%
$0
Facility $0
SD AVG $38.5k
Rank #1 / 67
13
Facility 13
SD AVG 14.8
Rank #28 / 67
3.3
Facility 3.3
SD AVG 3.3
Rank #36 / 67
143-
65
Facility 65
SD AVG 39
Rank #25 / 159
Augustana Lutheran Church
$5.9M
Facility $5.9M
SD AVG $6.7M
Rank #39 / 63
$4.1M
Facility $4.1M
SD AVG $2.6M
Rank #22 / 63
68.6%
Facility 68.6%
SD AVG 40.8%
Rank #12 / 63
435096
Good Samaritan Society Sioux Falls Center
NH
Sioux Falls
98
Facility 98
SD AVG 69
Rank #23 / 117
73.2%
Facility 73.2%
SD AVG 79.9%
Rank #43 / 62
-8%
3.93
Facility 3.93
SD AVG 4.34
Rank #28 / 65
+21%-9%
$11.3k
Facility $11.3k
SD AVG $38.5k
Rank #26 / 67
14
Facility 14
SD AVG 14.8
Rank #30 / 67
4.7
Facility 4.7
SD AVG 3.3
Rank #53 / 67
180-
19
Facility 19
SD AVG 39
Rank #114 / 159
Luke Wanous
$8.1M
Facility $8.1M
SD AVG $6.7M
Rank #15 / 63
$4.5M
Facility $4.5M
SD AVG $2.6M
Rank #11 / 63
56%
Facility 56%
SD AVG 40.8%
Rank #18 / 63
435046
Good Samaritan Society Sioux Falls Village
NH
AL
IL
MC
Sioux Falls
177
Facility 177
SD AVG 69
Rank #3 / 117
89.8%
Facility 89.8%
SD AVG 79.9%
Rank #20 / 62
+12%
4.02
Facility 4.02
SD AVG 4.34
Rank #23 / 65
+5%-7%
$72.8k
Facility $72.8k
SD AVG $38.5k
Rank #56 / 67
43
Facility 43
SD AVG 14.8
Rank #65 / 67
6.1
Facility 6.1
SD AVG 3.3
Rank #63 / 67
5161-
2
Facility 2
SD AVG 39
Rank #148 / 159
Dana Bachmeier
$19.5M
Facility $19.5M
SD AVG $6.7M
Rank #1 / 63
$10.5M
Facility $10.5M
SD AVG $2.6M
Rank #4 / 63
54.1%
Facility 54.1%
SD AVG 40.8%
Rank #32 / 63
435045
Avantara Norton
NH
HC
Sioux Falls
110
Facility 110
SD AVG 69
Rank #12 / 117
91.5%
Facility 91.5%
SD AVG 79.9%
Rank #15 / 62
+14%
3.53
Facility 3.53
SD AVG 4.34
Rank #41 / 65
+53%-19%
$153.6k
Facility $153.6k
SD AVG $38.5k
Rank #63 / 67
75
Facility 75
SD AVG 14.8
Rank #66 / 67
4.2
Facility 4.2
SD AVG 3.3
Rank #48 / 67
1899-
61
Facility 61
SD AVG 39
Rank #37 / 159
Jeremy Klinkhammer
$10.3M
Facility $10.3M
SD AVG $6.7M
Rank #9 / 63
$4.4M
Facility $4.4M
SD AVG $2.6M
Rank #9 / 63
42.4%
Facility 42.4%
SD AVG 40.8%
Rank #39 / 63
435039

Financial Assistance for
Nursing Home in South Dakota

Bethany Home Sioux Falls/Bethany Home-Brandon is located in Sioux Falls, South Dakota.
Here are the financial assistance programs available to residents in South Dakota.

Get Financial aid guidance

Home and Community Based Services Waiver

SD Medicaid HCBS Waiver

Age 65+ or disabled
General South Dakota resident, Medicaid-eligible, nursing home-level care need.
Income Limits (2025) ~$2,829/month 300% FBR, individual
Asset Limits $2,000 (individual), $3,000 (couple).
SD

Sparse population aids rural access; limited providers.

Benefits
Personal care (5-7 hours/day) Respite (240 hours/year) Adult day care (~$60/day) Home aides

South Dakota Elderly Services Program

SD ESP

Age 60+
General South Dakota resident, at risk of decline.
Income Limits ~$1,732/month individual, varies
Asset Limits $5,000 individual
SD

Limited funding; rural focus.

Benefits
In-home care (2-4 hours/week) Respite (up to 5 days/year) Transportation (~5 trips/month)

Medicare Savings Program (MSP)

South Dakota Medicare Savings Program

Age 65+ or disabled
General SD resident, Medicare Part A/B.
Income Limits (2025) ~$2,510/month (QMB), ~$3,380/month (SLMB), ~$3,598/month (QI)—individual.
Asset Limits $9,430 (individual), $14,130 (couple).
SD

Three tiers; includes Extra Help for Part D; no waitlist.

Benefits
Covers Part B premiums ($174.70/month) Deductibles ($240/year) Copays (~20%)

Low-Income Home Energy Assistance Program (LIEAP)

South Dakota LIEAP

Age 60+ prioritized
General SD resident, low-income household.
Income Limits (2025) ~$3,970/month individual, 185% FPL
Asset Limits Not assessed; income-focused.
SD

Covers gas, electric, propane; weatherization add-on available.

Benefits
Heating/cooling aid ($300-$1,000/season) Emergency aid ($500 max)

Family Caregiver Support Program (FCSP)

South Dakota Family Caregiver Support Program

Age
General Caregivers of 60+ needing care or 55+ caregivers of others; SD resident; functional needs (2+ ADLs).
Income Limits (2025) No strict cap; prioritizes low-income ~$24,980/year
Asset Limits Not assessed; need-based.
SD

Rural emphasis; includes grandparent caregivers.

Benefits
Respite (4-6 hours/week or 5 days/year) Adult day care ($60/day) Training Supplies (~$500/year)

VA Aid and Attendance (A&A) and Housebound Benefits

South Dakota VA Aid and Attendance/Housebound

Age 65+ or disabled veteran/spouse
General SD resident, wartime service, need for ADL help (A&A) or homebound.
Income Limits (2025) Net income < ~$1,984/month (veteran with dependent, A&A); pension offsets income.
Asset Limits ~$155,356 net worth limit
SD

Supports rural veterans; high demand near Sioux Falls VA.

Benefits
Cash (~$1,433-$2,642/month veteran, ~$951-$1,318 spouse) for care costs (e.g., in-home, assisted living)

Property Tax Reduction Program

South Dakota Property Tax Reduction from Municipal Taxes

Age 65+ (or disabled) by Jan 1
General SD resident entire prior year, homeowner/renter.
Income Limits (2025) ~$20,192/year (single), ~$24,679/year (multiple-member household).
Asset Limits Not assessed; income-focused.
SD

Refunds up to $575; ~10,000 seniors benefit annually.

Benefits
Tax refund (~$250-$575/year based on income)

Senior Farmers’ Market Nutrition Program (SFMNP)

South Dakota SFMNP

Age 60+
General SD resident, low-income.
Income Limits (2025) ~$2,322/month individual, 185% FPL
Asset Limits Not assessed.
SD

Vouchers (~$50/season); serves ~5,000 annually via 6 AAAs.

Benefits
Vouchers (~$50/season) for fresh produce at approved markets

Freeze on Assessments for Dwellings of Disabled and Senior Citizens

South Dakota Property Tax Freeze

Age 65+ (or disabled)
General SD resident 200+ days prior year, homeowner.
Income Limits (2025) ~$35,000/year (single), ~$45,000/year (multiple-member household).
Asset Limits Property value < $250,000 (single), $300,000 (multiple).
SD

Saves ~$300-$600/year avg.; applies to primary residence.

Benefits
Assessment freeze (~$300-$600/year savings)

Older Americans Act (OAA) Services

South Dakota OAA Services

Age 60+
General SD resident (or spouse of any age); no income/asset limits.
Income Limits (2025) None; donations encouraged for some services.
Asset Limits Not assessed.
SD

6 AAAs; rural focus due to sparse population.

Benefits
Meals (home-delivered or congregate, ~$5-$7/meal value) Transportation Homemaker services (~4 hours/week) Respite (~5 days/year) Legal aid

Frequently Asked Questions about Bethany Home Sioux Falls/Bethany Home-Brandon

Is Bethany Home Sioux Falls/Bethany Home-Brandon in a walkable area?

Bethany Home Sioux Falls/Bethany Home-Brandon has a walk score of 65. Moderately walkable. Some errands can be accomplished on foot, with a mix of nearby amenities.

What is the license number of Bethany Home Sioux Falls/Bethany Home-Brandon?

According to SD state health department records, Bethany Home Sioux Falls/Bethany Home-Brandon's license number is 10677.

When does Bethany Home Sioux Falls/Bethany Home-Brandon's license expire?

According to SD state health department records, Bethany Home Sioux Falls/Bethany Home-Brandon's license expires on June 30, 2026.

What is the occupancy rate at Bethany Home Sioux Falls/Bethany Home-Brandon?

Bethany Home Sioux Falls/Bethany Home-Brandon's occupancy is 79%.

Who is the administrator of Bethany Home Sioux Falls/Bethany Home-Brandon?

Amanda Peterson is the administrator of Bethany Home Sioux Falls/Bethany Home-Brandon.

How many beds does Bethany Home Sioux Falls/Bethany Home-Brandon have?

Bethany Home Sioux Falls/Bethany Home-Brandon has 112 beds.

Are there photos of Bethany Home Sioux Falls/Bethany Home-Brandon?

Yes — there are 2 photos of Bethany Home Sioux Falls/Bethany Home-Brandon in the photo gallery on this page.

Guides for Better Senior Living

Care Cost Calculator: See Prices in Your Area

Nursing Home Data Explorer

Don’t Wait Too Long: 7 Red Flag Signs Your Parent Needs Assisted Living Now

The True Cost of Assisted Living in 2025 – And How Families Are Paying For It

Understanding Senior Living Costs: Pricing Models, Discounts & Financial Assistance