Occupancy rate
76%

We arrange tours, appointments, and even moving support so you don’t have to
Thank you for your interest!
Our team will be in touch shortly to help with next steps.
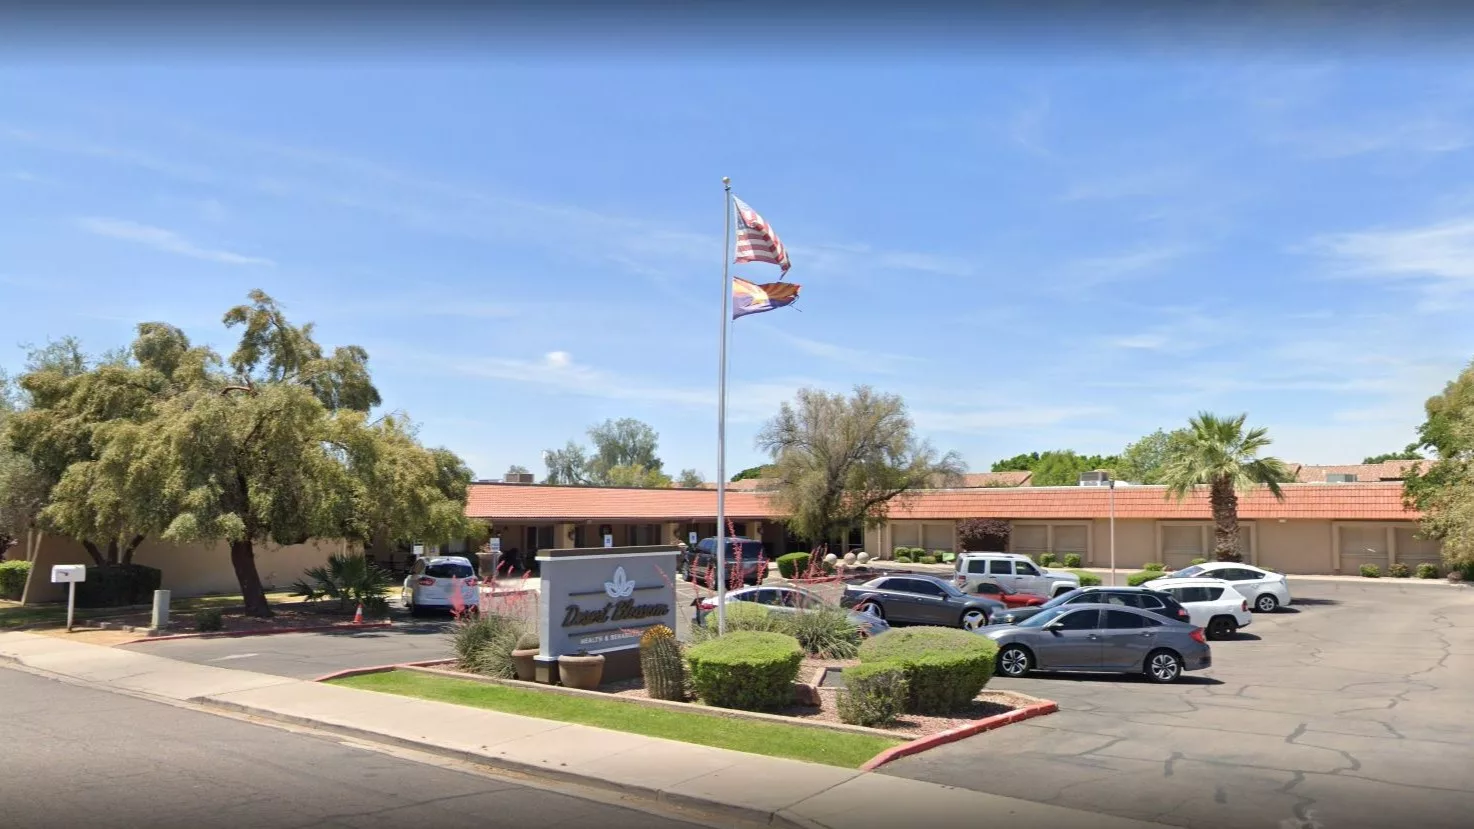
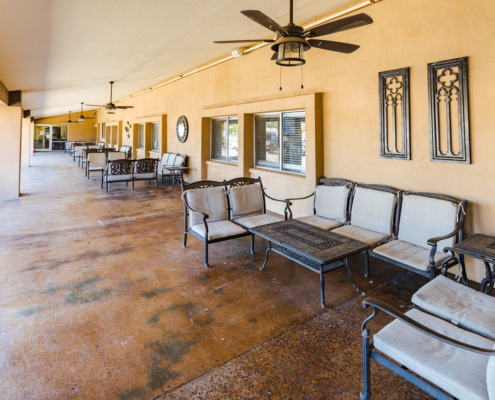
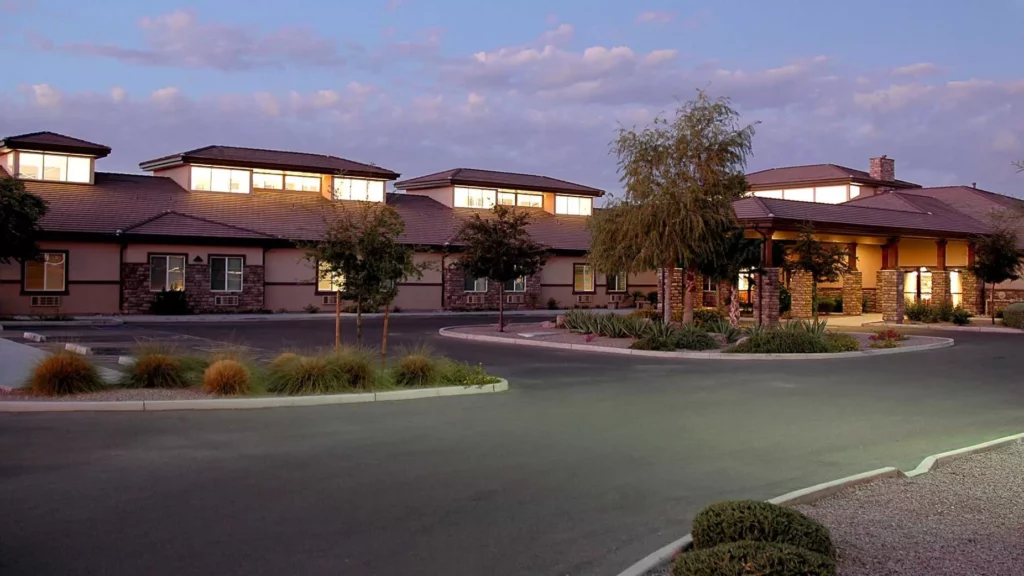
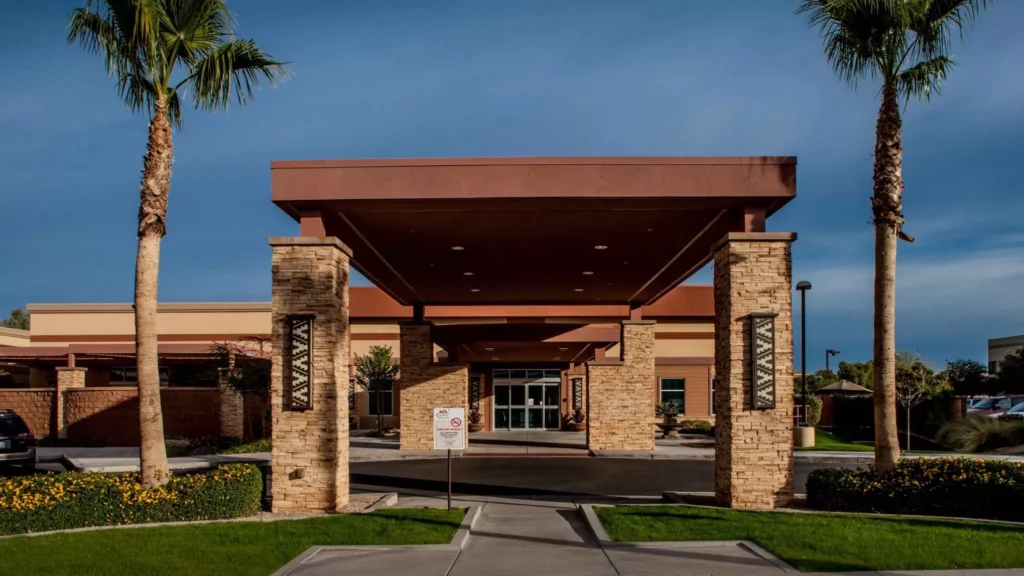
Sister company to Citadel Post Acute, Desert Blossom is also the premier short-term and long-term rehabilitation center in the city. The nursing home offers a definite solution to all your needs, ensuring that comfort and relaxation are being prioritized– with the staff ready and dedicated to supporting all your needs throughout. Desert Blossom is a community where residents are sure to thrive.
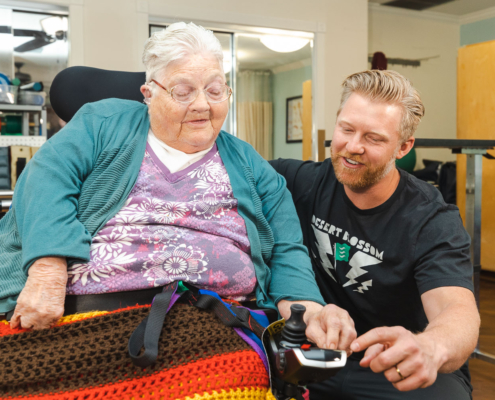
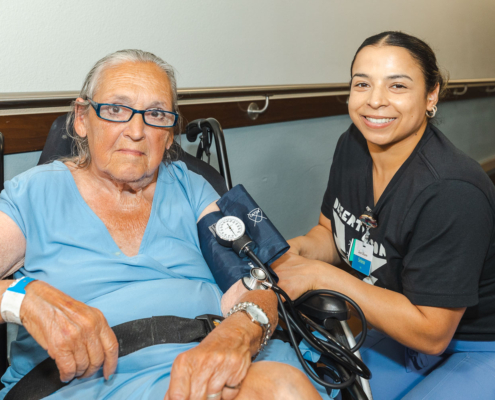
Desert Blossom nursing and rehab experience is centered on skilled nursing, wellness, and therapy. Residents can feel confident knowing that is filled with a caliber of service that is safe, comfortable, and therapeutic. Seniors are encouraged to maintain a lifestyle of independence and individuality by staying active and engaged with social, recreational, and stimulating activities.
Offers a balance of services and community atmosphere.
Lower occupancy suggests more openings may be available.
Most residents stay long-term, while a smaller portion are admitted for short-term rehab.
9% of new residents, usually for short-term rehab.
74% of new residents, often for short stays.
18% of new residents, often for long-term daily care.
Desert Blossom Health and Rehabilitation is legally operated by Desert Blossom Health & Rehab Center, and administrated by DAVID BUSH.
In Arizona, the Department of Health Services, Bureau of Long Term Care Licensing performs regular onsite inspections and investigates complaints for all licensed residential and nursing facilities.
18 complaint inspections
Arizona average: 6 complaint visits
Arizona average: 5 inspections
Formal expressions of dissatisfaction or concern made by residents, or their families regarding various aspects of the care, services, and environment provided.
Arizona average: 6 complaints
Violations indicate regulatory issues. A higher number implies the facility had several areas requiring improvement.
Arizona average: 12 violations
Deficiencies indicate regulatory issues. A higher number implies the facility had several areas requiring improvement.
The most recent inspection on June 5, 2025, was a complaint investigation that found no deficiencies. Earlier inspections showed a mixed pattern, with several reports citing deficiencies related mainly to assisted nutrition and hydration, care plans, documentation, medication policies, and environmental issues. Complaint investigations were consistently unsubstantiated, with no enforcement actions or fines listed in the available reports. Prior Life Safety Code surveys noted few deficiencies, which were addressed through accepted plans of correction. The overall trend suggests improvement, as recent inspections have not identified any deficiencies following earlier citations.
Arizona average 6.3
Last Health inspection on Jul 2025
Arizona average 23.2
Arizona average 3.82
Health citations are formal notices following inspections when they fail to comply with safety and care standards.
9 of 18 citations resulted from standard inspections; 6 of 18 resulted from complaint investigations; and 3 of 18 came from combined inspections (standard and complaint).
Arizona average: 0.1
Arizona average: 0.6
Data sourced from CMS Health Deficiencies reports. Citation severity codes range from A (least serious) to L (most serious). Immediate Jeopardy (J-L) citations indicate situations where the facility's noncompliance has placed residents at risk of death or serious harm.
Assisted Living A licensed, long-term care setting for seniors or individuals with disabilities who need help with daily activities — like bathing, dressing, and medication management — but not 24-hour skilled nursing. Offers housing, meals, and around-the-clock support while aiming to maximize resident independence.
Nursing Home Licensed facility providing 24/7 skilled nursing care for residents with complex, ongoing medical needs. Staffed by RNs, LPNs, and CNAs. Inspected and star-rated annually by CMS. Accepts Medicare (short-term rehab) and Medicaid (long-term care).
Assisted Living A licensed, long-term care setting for seniors or individuals with disabilities who need help with daily activities — like bathing, dressing, and medication management — but not 24-hour skilled nursing. Offers housing, meals, and around-the-clock support while aiming to maximize resident independence.
Memory Care Secured, specialized care for people living with Alzheimer's or dementia. Staff trained in cognitive impairment, with higher staff-to-resident ratios and an environment designed to reduce confusion and wandering risk.
Nursing Home Licensed facility providing 24/7 skilled nursing care for residents with complex, ongoing medical needs. Staffed by RNs, LPNs, and CNAs. Inspected and star-rated annually by CMS. Accepts Medicare (short-term rehab) and Medicaid (long-term care).
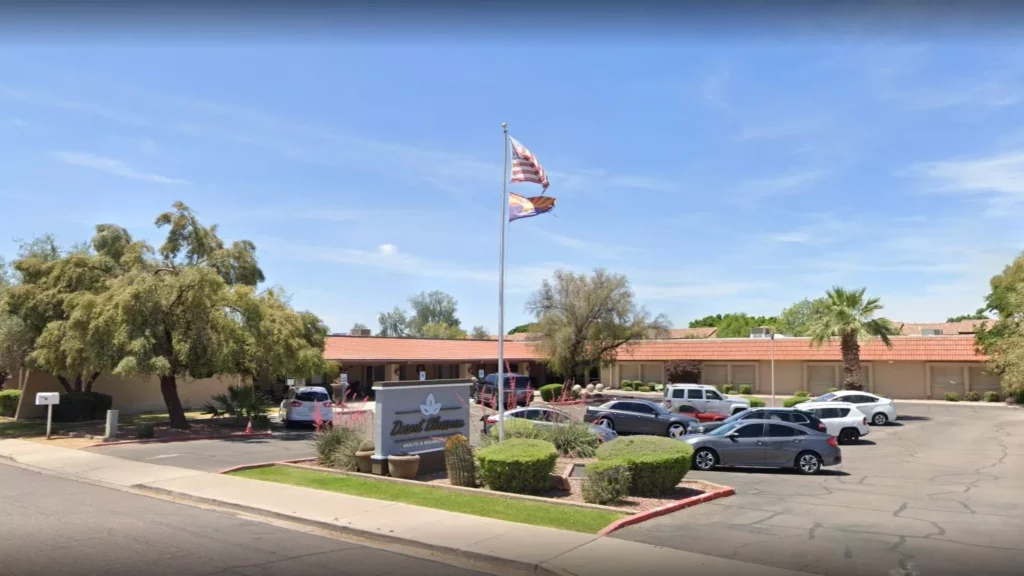
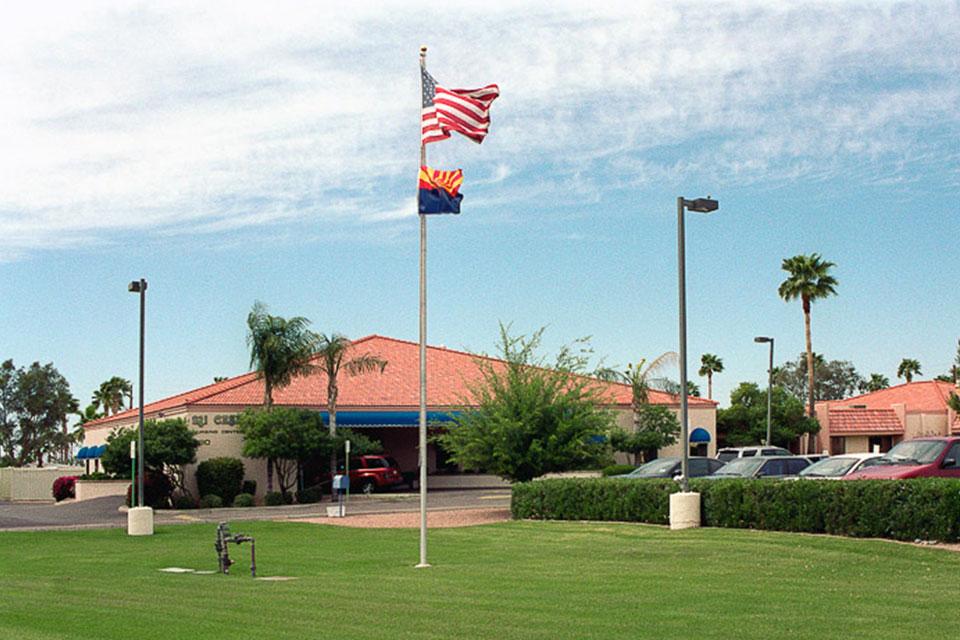
![]() 7.2 miles from city center — 1.05 miles to nearest hospital (Banner Baywood Medical Center | Mesa, AZ | Baywood Ave.)
7.2 miles from city center — 1.05 miles to nearest hospital (Banner Baywood Medical Center | Mesa, AZ | Baywood Ave.)
![]() 60 S 58th St, Mesa, AZ 85206
60 S 58th St, Mesa, AZ 85206
Add your location
This data corresponds to Q2 2025 and is based on CMS Payroll-Based Journal.
Arizona average ratio: 1.83:1
Arizona average: 8.5 hours
Manages medical care and health needs.
No contractors work on this role.
Assists with medical care and medications.
No contractors work on this role.
Helps with daily care and mobility.
No contractors work on this role.
Total hours from contractors
0 contractor hours this quarter
No contractor roles were reported this quarter.
| Certified Nursing Assistant | 47 | 0 | 47 | 14,309 | 91 | 100% | 9 |
| Licensed Practical Nurse | 31 | 0 | 31 | 6,718 | 91 | 100% | 9.4 |
| Registered Nurse | 12 | 0 | 12 | 3,002 | 91 | 100% | 10.6 |
| Dental Services Staff | 8 | 0 | 8 | 2,340 | 84 | 92% | 8.2 |
| Clinical Nurse Specialist | 6 | 0 | 6 | 1,701 | 74 | 81% | 8.8 |
| Speech Language Pathologist | 6 | 0 | 6 | 1,362 | 65 | 71% | 7.2 |
| Physical Therapy Aide | 3 | 0 | 3 | 900 | 68 | 75% | 6 |
| Physical Therapy Assistant | 2 | 0 | 2 | 722 | 66 | 73% | 7.2 |
| Respiratory Therapy Technician | 3 | 0 | 3 | 653 | 75 | 82% | 6.9 |
| Other Dietary Services Staff | 2 | 0 | 2 | 604 | 80 | 88% | 7.5 |
| Nurse Practitioner | 1 | 0 | 1 | 585 | 65 | 71% | 9 |
| RN Director of Nursing | 1 | 0 | 1 | 547 | 60 | 66% | 9.1 |
| Administrator | 1 | 0 | 1 | 520 | 65 | 71% | 8 |
| Dietitian | 1 | 0 | 1 | 471 | 64 | 70% | 7.4 |
| Qualified Social Worker | 2 | 0 | 2 | 456 | 60 | 66% | 7 |
| Medication Aide/Technician | 1 | 0 | 1 | 277 | 35 | 38% | 7.9 |
| Nurse Aide in Training | 1 | 0 | 1 | 120 | 13 | 14% | 9.2 |
| Occupational Therapy Aide | 1 | 0 | 1 | 8 | 2 | 2% | 3.9 |
Source: CMS Long-Term Care Facility Characteristics (Data as of Jan 2026)
Residents meet regularly to discuss policies, care quality, and activities
Organized group of residents that meets regularly to discuss facility policies, quality of life, and activities.
Data sourced from CMS Long-Term Care Facility Characteristics quarterly report. Payer mix reflects the current resident census by primary payment source.
These measures show how residents usually do over time at this home, based on health outcomes and preventive care.
Arizona average: 7.6
Arizona average: 16.1
Arizona average: 11.2%
Arizona average: 15.8%
Arizona average: 20.8%
Arizona average: 2.1%
Arizona average: 5.1%
Arizona average: 1.3%
Arizona average: 5.4%
Arizona average: 4.5%
Arizona average: 10.3%
Arizona average: 97.2%
Arizona average: 94.6%
Arizona average: 91.5%
Arizona average: 1.0%
Arizona average: 87.3%
Arizona average: 24.6%
Arizona average: 10.7%
Arizona average: 0.8%
Arizona average: 53.7%
Arizona average: 50.6%
Quality measures are calculated from Minimum Data Set (MDS) assessments. For most measures, lower percentages indicate better care quality.
Federal penalties imposed by CMS for regulatory violations, including civil money penalties (fines) and denials of payment for new Medicare/Medicaid admissions.
Source: CMS Penalties Database (Data as of Jan 2026)
Arizona average: $30K
Arizona average: 1.7
Arizona average: 0.1
Penalties are imposed by CMS for violations of federal nursing home regulations.
Last updated: Jan 2026
Historical financial and operational data for Desert Blossom Health and Rehabilitation based on CMS SNF Cost Reports.
Loading trend charts...
Care Cost Calculator: See Prices in Your Area
Nursing Home Data Explorer
Don’t Wait Too Long: 7 Red Flag Signs Your Parent Needs Assisted Living Now
The True Cost of Assisted Living in 2025 – And How Families Are Paying For It
Understanding Senior Living Costs: Pricing Models, Discounts & Financial Assistance

Touring a community? Use this expert-backed checklist to stay organized, ask the right questions, and find the perfect fit.
We'll send you a PDF version of the touring checklist.