


Total health inspections
3
Ohio average 6.7
Last Health inspection on Nov 2022
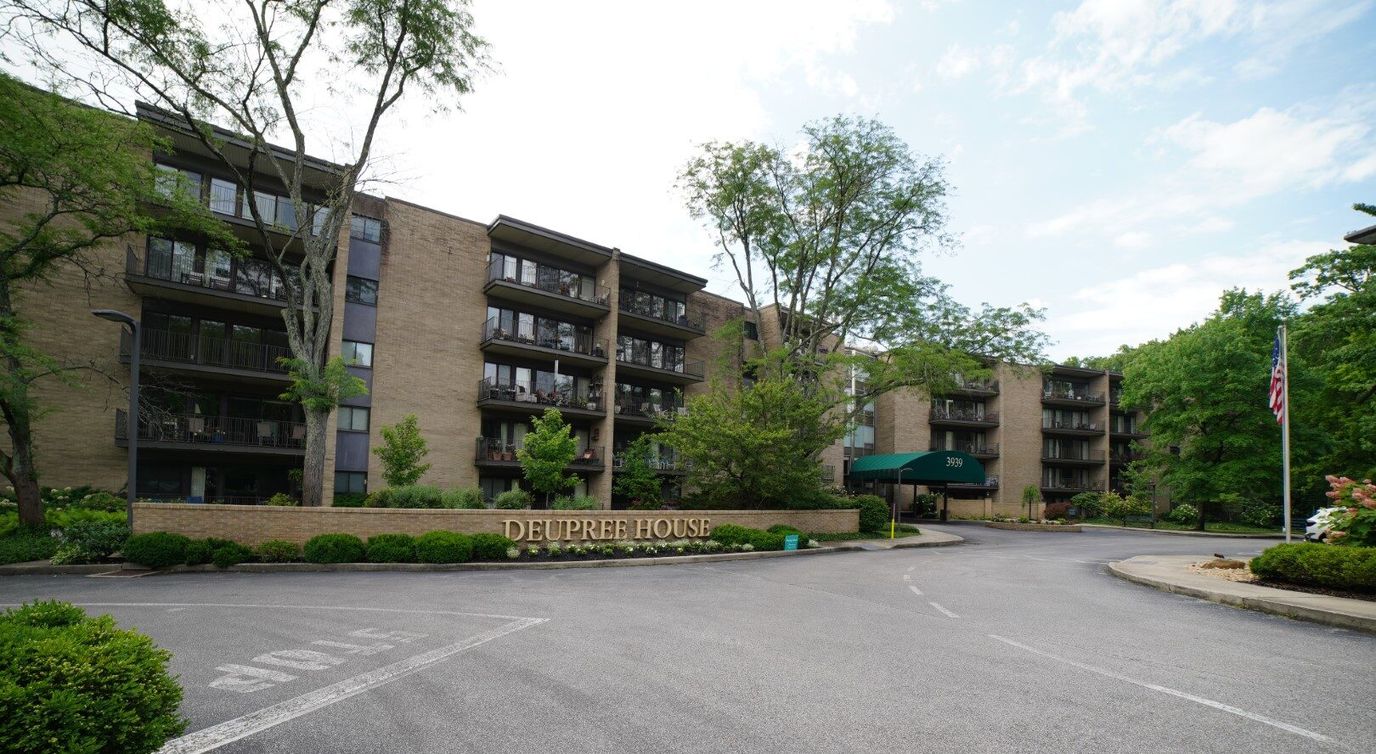
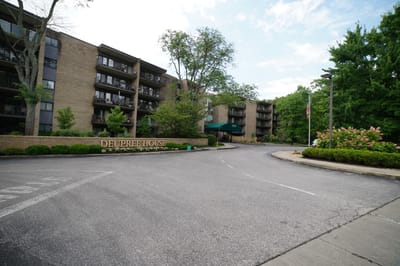
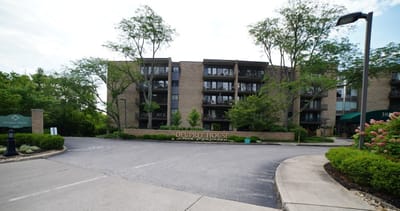


Peacefully set near Hyde Park Golf & Country Club in Cincinnati, OH, Deupree House is an idyllic retreat that offers independent living and long-term care. Featuring cozy and specially designed one- and two-bedroom floor plans, the community ensures that residents are comfortable and safe. To help residents maintain their independence, the community handles the housekeeping and maintenance.
Residents make the most of their days with a carefully curated calendar of fun activities and engaging programs that highlight their interests and capabilities. Accommodating residents’ dietary needs and preferences, flexible dining options are available in a restaurant-style setting. The community is ideal for those seeking independence in retirement without the busy work, especially with its state-of-the-art amenities and friendly environment.
| Staff type | Hours / Day / Resident | vs state avg |
|---|---|---|
|
Registered Nurse (RN)
| 1h 9m per day | ▲ 81% State avg: 38m per day · National avg: 41m per day |
|
LPN / LVN
| 34m per day | ▼ 42% State avg: 58m per day · National avg: 52m per day |
|
Nurse Aide
| 3h 58m per day | ▲ 87% State avg: 2h 7m per day · National avg: 2h 20m per day |
|
Weekend Total Nursing
| 5h 7m per day | ▲ 54% State avg: 3h 20m per day · National avg: 3h 27m per day |
|
Physical Therapist
| 4m per day | ▲ 34% State avg: 3m per day · National avg: 4m per day |
|
Weekend RN
| 46m per day | ▲ 81% State avg: 25m per day · National avg: 29m per day |
In Ohio, the Department of Health, Bureau of Survey and Certification conducts unannounced onsite inspections to evaluate the quality of care and environment in all licensed facilities.
Citations
| This Facility | OH Average | vs. OH Avg |
|---|---|---|---|
|
Total citations
| 1 | 2 | This facility has 50% fewer total citations than a typical Ohio nursing home (1 vs. OH avg 2).↓ 50% better |
Every two years, the Ohio Department of Aging and the Office of the State Long-Term Care Ombudsman organizations conduct a satisfaction survey among residents in long-term care facilities to assess their quality of care and life.
Ohio average: 86 / 100
Ohio average: 89 / 100
Ohio average: 95 / 100
Ohio average: 82 / 100
Ohio average: 86 / 100
Ohio average: 89 / 100
Ohio average: 80 / 100
Ohio average: 81 / 100
Based on the RCF Resident Satisfaction Survey 2022-23, Final Results
Have you gotten or are you getting physical therapy, occupational therapy or speech therapy, while living at this care facility?
This facility42/100
Ohio average46/100
Did (Does) the therapy help you meet your goals?
This facility88/100
Ohio average88/100
Did (Do) the therapists help you set goals?
This facility100/100
Ohio average89/100
Did (Do) you know who to speak to about your therapy progress?
This facility100/100
Ohio average85/100
Can you decide how to spend your day?
This facility100/100
Ohio average94/100
Scores represent percent of positive resident responses for each item, excluding "don't know" and "not applicable" responses and instances where the question was skipped.
Based on the RCF Resident Satisfaction Survey 2022-23, Final Results
Can you find a place to be alone if you want to be alone?
This facility91/100
Ohio average96/100
Is it very clean here?
This facility96/100
Ohio average96/100
Are you able to get around the building if you want to?
This facility96/100
Ohio average95/100
Do you feel safe here?
This facility100/100
Ohio average98/100
Do you feel you have enough privacy?
This facility100/100
Ohio average95/100
Can you enjoy the outdoors if you want to?
This facility100/100
Ohio average91/100
Is it easy for you to get around in your room (or apartment)?
This facility100/100
Ohio average96/100
Are your personal items safe here?
This facility100/100
Ohio average92/100
Scores represent percent of positive resident responses for each item, excluding "don't know" and "not applicable" responses and instances where the question was skipped.
Based on the RCF Resident Satisfaction Survey 2022-23, Final Results
Did you receive a thorough orientation to DEUPREE HOUSE II
This facility—/100
Ohio average—/100
RESIDENTIAL CARE FACILITY?
This facility74/100
Ohio average70/100
Were you given enough information to learn how things work here?
This facility90/100
Ohio average82/100
Did you feel warmly welcomed as a new resident?
This facility95/100
Ohio average93/100
Scores represent percent of positive resident responses for each item, excluding "don't know" and "not applicable" responses and instances where the question was skipped.
Based on the RCF Resident Satisfaction Survey 2022-23, Final Results
Are you encouraged to speak up about things you don’t like here?
This facility71/100
Ohio average81/100
Are your concerns taken care of in a timely way?
This facility90/100
Ohio average86/100
Do the people who work here tell you when rules, policies, and procedures change?
This facility91/100
Ohio average78/100
Do the people who work here help you with technology, if needed?
This facility95/100
Ohio average89/100
Are you as involved in decisions about your care as you want to be?
This facility96/100
Ohio average85/100
Overall, are you satisfied with the care you receive here?
This facility100/100
Ohio average94/100
Do the people who work here seem happy to work here?
This facility100/100
Ohio average92/100
Do the people who work here go above and beyond to give you a good life?
This facility100/100
Ohio average87/100
Are you friends with anyone who lives here?
This facility100/100
Ohio average81/100
Would you highly recommend DEUPREE HOUSE II
This facility—/100
Ohio average—/100
RESIDENTIAL CARE FACILITY to someone who needs this type of care?
This facility100/100
Ohio average89/100
Scores represent percent of positive resident responses for each item, excluding "don't know" and "not applicable" responses and instances where the question was skipped.
Based on the RCF Resident Satisfaction Survey 2022-23, Final Results
Do the same people take care of you most of the time?
This facility79/100
Ohio average84/100
Do the people who work here do things the way you want them done?
This facility80/100
Ohio average88/100
Do the people who work here check on you often enough to see if you need anything?
This facility88/100
Ohio average81/100
Are the people who work here knowledgeable about your medical conditions and treatments?
This facility90/100
Ohio average90/100
Do the people who work here make sure you are comfortable when they provide care or services?
This facility90/100
Ohio average95/100
Do the people who work here support you to do as much for yourself as you are able to do?
This facility90/100
Ohio average96/100
Do the people who care for you explain your care and services to you?
This facility94/100
Ohio average85/100
Do the people who work here ever get angry at you?
This facility96/100
Ohio average88/100
Do the people who work here do everything they can to protect you from getting sick?
This facility96/100
Ohio average94/100
Do you have opportunities to maintain your health and wellness, if you want?
This facility100/100
Ohio average92/100
Do you feel confident the people who work here would come quickly anytime you needed help?
This facility100/100
Ohio average85/100
Scores represent percent of positive resident responses for each item, excluding "don't know" and "not applicable" responses and instances where the question was skipped.
Based on the RCF Resident Satisfaction Survey 2022-23, Final Results
Are there enjoyable things to do on the weekends, if you want?
This facility38/100
Ohio average63/100
Do you have something to look forward to most days?
This facility74/100
Ohio average77/100
Are you as connected to the community as you want to be?
This facility91/100
Ohio average71/100
Do you have plenty of opportunities to do things that are meaningful to you?
This facility91/100
Ohio average83/100
Do you have enough opportunities to go on outings and special events?
This facility91/100
Ohio average73/100
Do you like the activities here?
This facility96/100
Ohio average83/100
Are you able to do the activities offered here, if you want?
This facility96/100
Ohio average93/100
Do you feel included in life here?
This facility96/100
Ohio average89/100
Do you usually enjoy how you spend your time?
This facility100/100
Ohio average87/100
Scores represent percent of positive resident responses for each item, excluding "don't know" and "not applicable" responses and instances where the question was skipped.
Based on the RCF Resident Satisfaction Survey 2022-23, Final Results
Do you have input on the food that is served?
This facility45/100
Ohio average68/100
Does the menu change often enough?
This facility86/100
Ohio average77/100
Do you get enough fresh food options here?
This facility91/100
Ohio average81/100
Do you look forward to mealtimes?
This facility95/100
Ohio average80/100
Do you get enough to eat here?
This facility100/100
Ohio average95/100
Do you like the food here?
This facility100/100
Ohio average81/100
Scores represent percent of positive resident responses for each item, excluding "don't know" and "not applicable" responses and instances where the question was skipped.
Ohio average 6.7
Last Health inspection on Nov 2022
Ohio average 30.9
Ohio average 4.59
Health citations are formal notices following inspections when they fail to comply with safety and care standards.
All 12 citations resulted from standard inspections.
Ohio average: 0.3
Ohio average: 0.9
Reporting period: October 1 – December 31, 2025 (Q4 2025). Source: CMS Payroll-Based Journal report.
Manages medical care and health needs.
Assists with medical care and medications.
Helps with daily care and mobility.
Total hours from contractors
549 contractor hours this quarter
| Certified Nursing Assistant | 36 | 0 | 36 | 6,095 | 92 | 100% | 4.6 |
| Registered Nurse | 7 | 0 | 7 | 1,215 | 85 | 92% | 9 |
| Medication Aide/Technician | 13 | 0 | 13 | 1,155 | 91 | 99% | 7.6 |
| Licensed Practical Nurse | 6 | 0 | 6 | 1,022 | 82 | 89% | 9 |
| Administrator | 1 | 0 | 1 | 488 | 61 | 66% | 8 |
| Nurse Practitioner | 1 | 0 | 1 | 460 | 58 | 63% | 7.9 |
| Clinical Nurse Specialist | 1 | 0 | 1 | 431 | 51 | 55% | 8.4 |
| Mental Health Service Worker | 1 | 0 | 1 | 230 | 59 | 64% | 3.9 |
| Other Dietary Services Staff | 1 | 0 | 1 | 155 | 62 | 67% | 2.5 |
| Physical Therapy Assistant | 0 | 3 | 3 | 147 | 63 | 68% | 2.3 |
| Respiratory Therapy Technician | 0 | 3 | 3 | 131 | 63 | 68% | 1.9 |
| Speech Language Pathologist | 0 | 1 | 1 | 114 | 50 | 54% | 2.3 |
| Qualified Social Worker | 0 | 1 | 1 | 104 | 53 | 58% | 2 |
| Feeding Assistant | 1 | 0 | 1 | 48 | 12 | 13% | 4 |
| Medical Director | 0 | 1 | 1 | 16 | 25 | 27% | 0.6 |
| Occupational Therapy Aide | 0 | 1 | 1 | 15 | 4 | 4% | 3.8 |
| Occupational Therapy Assistant | 0 | 1 | 1 | 15 | 5 | 5% | 3 |
| Physical Therapy Aide | 0 | 1 | 1 | 7 | 5 | 5% | 1.3 |
Federal penalties imposed by CMS for regulatory violations, including civil money penalties (fines) and denials of payment for new Medicare/Medicaid admissions.
Source: CMS Penalties Database
No penalties in the past 3 years
No civil money penalties or payment denials were reported in the last 3 years.
These measures show how residents usually do over time at this home, based on health outcomes and preventive care.
Ohio average: 5.8
Ohio average: 12.7
Ohio average: 6.8%
Ohio average: 8.9%
Ohio average: 22.0%
Ohio average: 3.4%
Ohio average: 3.9%
Ohio average: 0.5%
Ohio average: 6.2%
Ohio average: 24.0%
Ohio average: 8.4%
Ohio average: 92.4%
Ohio average: 94.5%
Ohio average: 78.0%
Quality measures are calculated from Minimum Data Set (MDS) assessments. For most measures, lower percentages indicate better care quality.
38% of new residents, usually for short-term rehab.
59% of new residents, often for short stays.
3% of new residents, often for long-term daily care.
Source: CMS Long-Term Care Facility Characteristics (Data as of Jan 2026)
Residents meet regularly to discuss policies, care quality, and activities
Part of a Continuing Care Retirement Community offering multiple care levels
Organized group of residents that meets regularly to discuss facility policies, quality of life, and activities.
Data sourced from CMS Long-Term Care Facility Characteristics quarterly report. Payer mix reflects the current resident census by primary payment source.
Historical financial and operational data for Deupree House from 2011–2023, based on CMS SNF Cost Reports.
Key figures below are for fiscal year ending in 12/2023.
Based on CMS SNF Cost Report for fiscal year ending in 12/2023.
No pets allowed
Room Sizes: 900 - 1,716 sq. ft
Housing Options: 1 Bed / 2 Bed
Building Type: 2-story
Social and Recreational Activities

Wellness Programs
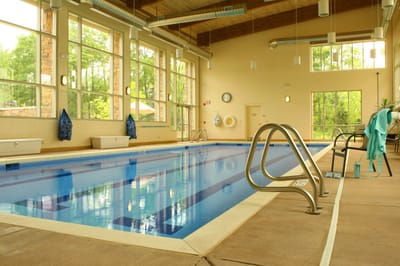
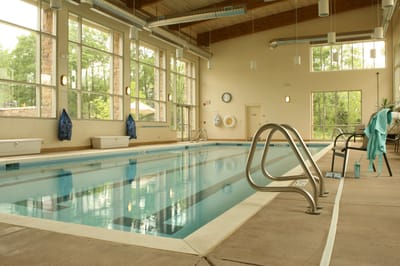
Swimming Pool
This home supports both short-term rehab and long-term care, with residents staying for a wide range of durations.
Most new residents arrive under private pay (59% of admissions), and a typical private pay stay runs around 9 - 10 months.
Coverage residents most often arrive under.
Coverage residents most often leave under.
Megan Bradford brings extensive leadership experience in senior living, having served as a licensed nursing home administrator and currently as Vice President of Middle Market and Ministry at ERS. She oversees growth strategies and outreach ministry teams, demonstrating a deep commitment to serving older adults. Megan’s diverse roles within ERS and her passion for lifelong service make her a dedicated leader for the community.
![]() 6.4 miles from city center
6.4 miles from city center
![]() Estimated distance in miles from Cincinnati's city center to Deupree House's address, calculated via Google Maps.
Estimated distance in miles from Cincinnati's city center to Deupree House's address, calculated via Google Maps.
Add your location
Info below is compiled from CMS reports & the OH Dept. of Health, senior community websites & trusted data sources such as Walk Score & BBB.
Communities are listed from highest to lowest based on our ranking methodology.
| Alois Alzheimer Center | NH HOS MC PC RC SNF | Cincinnati (Greenhills) | 93
Facility
93
OH AVG
75
Rank
#92 / 309 |
82.8%
Facility
82.8%
OH AVG
81.7
Rank
#86 / 138 | +1% | 4.12
Facility
4.12
OH AVG
3.54
Rank
#36 / 182 | -31% | +16% | $0
Facility
$0
OH AVG
$74.0k
Rank
#1 / 183 | 7
Facility
7
OH AVG
30.9
Rank
#14 / 183 | 3.5
Facility
3.5
OH AVG
4.6
Rank
#58 / 183 | - | 77 | - |
49
Facility
49
OH AVG
40
Rank
#263 / 704 | Boymel Operations Holdings Co LLC | $7.5MFiscal year ending 12/2023
Facility
$7.5MFiscal year ending 12/2023
OH AVG
$10.1M
Rank
#136 / 183 | $4.6MFiscal year ending 12/2023
Facility
$4.6MFiscal year ending 12/2023
OH AVG
$3.9M
Rank
#111 / 183 | 61.4%Fiscal year ending 12/2023
Facility
61.4%Fiscal year ending 12/2023
OH AVG
40.2%
Rank
#21 / 183 | 366489 | ||||
| Twin Towers | NH AL IL MC SNF | Cincinnati (College Hill) | 231
Facility
231
OH AVG
75
Rank
#1 / 309 |
31.2%
Facility
31.2%
OH AVG
81.7
Rank
#138 / 138 | -62% | 5.44
Facility
5.44
OH AVG
3.54
Rank
#8 / 182 | -14% | +54% | $0
Facility
$0
OH AVG
$74.0k
Rank
#1 / 183 | 13
Facility
13
OH AVG
30.9
Rank
#35 / 183 | 4.3
Facility
4.3
OH AVG
4.6
Rank
#99 / 183 | - | 72 | - |
31
Facility
31
OH AVG
40
Rank
#432 / 704 | Douglas Burgess | $10.7MFiscal year ending 12/2023
Facility
$10.7MFiscal year ending 12/2023
OH AVG
$10.1M
Rank
#38 / 183 | $5.8MFiscal year ending 12/2023
Facility
$5.8MFiscal year ending 12/2023
OH AVG
$3.9M
Rank
#63 / 183 | 54.5%Fiscal year ending 12/2023
Facility
54.5%Fiscal year ending 12/2023
OH AVG
40.2%
Rank
#163 / 183 | 366023 | ||||
| Beechwood Home | NH HOS SNF | Cincinnati (Evanston) | 80
Facility
80
OH AVG
75
Rank
#134 / 309 |
90.3%
Facility
90.3%
OH AVG
81.7
Rank
#41 / 138 | +10% | 4.61
Facility
4.61
OH AVG
3.54
Rank
#14 / 182 | -18% | +30% | $0
Facility
$0
OH AVG
$74.0k
Rank
#1 / 183 | 13
Facility
13
OH AVG
30.9
Rank
#35 / 183 | 3.3
Facility
3.3
OH AVG
4.6
Rank
#51 / 183 | - | 72 | - |
56
Facility
56
OH AVG
40
Rank
#186 / 704 | William Baechtold | $8.1MFiscal year ending 12/2023
Facility
$8.1MFiscal year ending 12/2023
OH AVG
$10.1M
Rank
#32 / 183 | $6.6MFiscal year ending 12/2023
Facility
$6.6MFiscal year ending 12/2023
OH AVG
$3.9M
Rank
#38 / 183 | 81.2%Fiscal year ending 12/2023
Facility
81.2%Fiscal year ending 12/2023
OH AVG
40.2%
Rank
#116 / 183 | 365445 | ||||
| Deupree House | NH AL IL MC | Cincinnati (Hyde Park) | 24
Facility
24
OH AVG
75
Rank
#285 / 309 |
82.9%
Facility
82.9%
OH AVG
81.7
Rank
#85 / 138 | +1% | 7.25
Facility
7.25
OH AVG
3.54
Rank
#1 / 182 | -4% | +105% | $0
Facility
$0
OH AVG
$74.0k
Rank
#1 / 183 | 12
Facility
12
OH AVG
30.9
Rank
#29 / 183 | 4.0
Facility
4.0
OH AVG
4.6
Rank
#81 / 183 | - | 20 | - |
44
Facility
44
OH AVG
40
Rank
#322 / 704 | Emerson Stambaugh | $3.8MFiscal year ending 12/2023
Facility
$3.8MFiscal year ending 12/2023
OH AVG
$10.1M
Rank
#163 / 183 | $2.7MFiscal year ending 12/2023
Facility
$2.7MFiscal year ending 12/2023
OH AVG
$3.9M
Rank
#158 / 183 | 70.7%Fiscal year ending 12/2023
Facility
70.7%Fiscal year ending 12/2023
OH AVG
40.2%
Rank
#40 / 183 | 366386 | ||||
| The Home At Hearthstone | NH MC PC SNF | Cincinnati | 96
Facility
96
OH AVG
75
Rank
#86 / 309 |
90.6%
Facility
90.6%
OH AVG
81.7
Rank
#39 / 138 | +11% | 3.15
Facility
3.15
OH AVG
3.54
Rank
#142 / 182 | -11% | -11% | $0
Facility
$0
OH AVG
$74.0k
Rank
#1 / 183 | 17
Facility
17
OH AVG
30.9
Rank
#44 / 183 | 4.3
Facility
4.3
OH AVG
4.6
Rank
#99 / 183 | - | 87 | - |
60
Facility
60
OH AVG
40
Rank
#153 / 704 | Nicholas Anderson | $9.5MFiscal year ending 12/2023
Facility
$9.5MFiscal year ending 12/2023
OH AVG
$10.1M
Rank
#93 / 183 | $5.6MFiscal year ending 12/2023
Facility
$5.6MFiscal year ending 12/2023
OH AVG
$3.9M
Rank
#76 / 183 | 58.4%Fiscal year ending 12/2023
Facility
58.4%Fiscal year ending 12/2023
OH AVG
40.2%
Rank
#61 / 183 | 366251 |
Deupree House is located in Cincinnati, Ohio.
Here are the financial assistance programs available to residents in Ohio.
Deupree House is in the Hyde Park neighborhood of Cincinnati.
Deupree House has a walk score of 44. Somewhat walkable. A few nearby services may be reachable on foot, but most trips require transportation.
Deupree House's occupancy is 87.7%.
No, Deupree House has a no-pet policy.
The team at Deupree House can be reached at NMCCAUGHEY@ERSLIFE.ORG.
Deupree House is registered as a non-profit in OH.
Deupree House has had 1 reported citation according to records from Ohio Department of Aging (ODA).
Care Cost Calculator: See Prices in Your Area
Nursing Home Data Explorer
Don’t Wait Too Long: 7 Red Flag Signs Your Parent Needs Assisted Living Now
The True Cost of Assisted Living in 2025 – And How Families Are Paying For It
Understanding Senior Living Costs: Pricing Models, Discounts & Financial Assistance


