Maple Knoll Village

Assisted Living in Cincinnati

CMS overall rating Info The Overall CMS Rating is scored from 1 to 5 stars and combines results from health inspections, staffing levels, and quality measures. Health inspections carry the most weight. Staffing and quality scores can increase or decrease the final rating based on performance compared to state and national standards.
Calculator: See prices in your area
Maple Knoll Village accepts Medicare, Medicaid, and private pay.

Overview of Maple Knoll Village

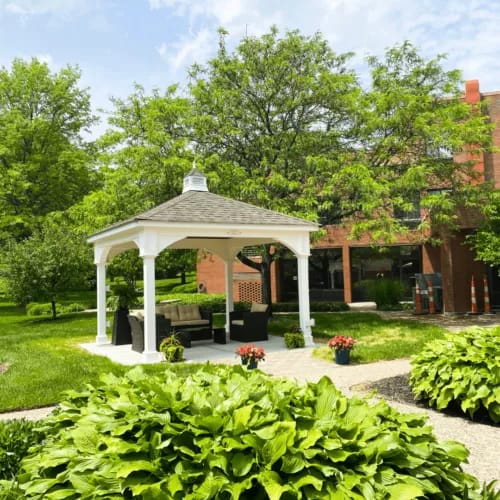
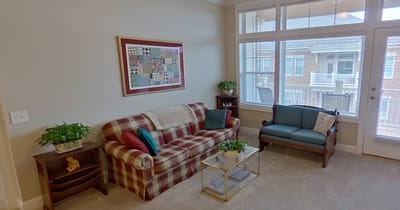
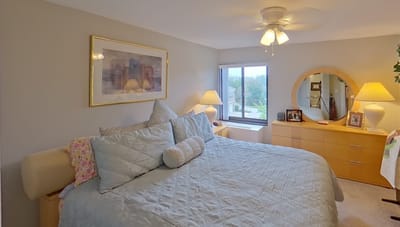
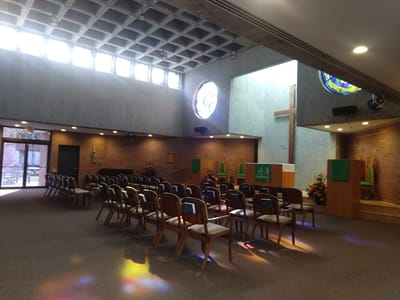
Live a blissful retirement with Maple Knoll Village set in the harmonious neighborhood of Springfield Pike, Cincinnati, OH, providing assisted living, independent living, rehabilitation services, skilled nursing, and hospice care. Here, residents receive top-notch care and assistance from a compassionate and highly trained team attending to their needs 24/7. Featuring variations of specially designed villas and apartments, residents can rest assured of finding the right accommodation according to their preferences. The community also promotes a vibrant and welcoming environment, ensuring residents adapt easily to their surroundings.

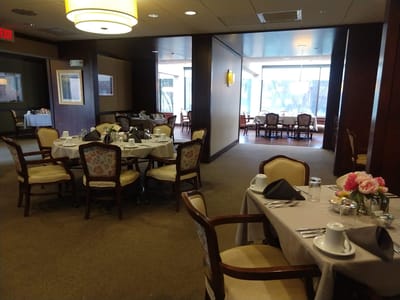
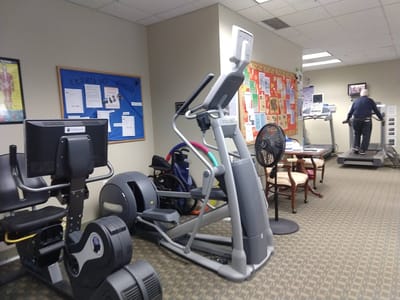
Fun activities and engaging programs are also conducted to keep residents active and socially connected. Mealtimes are also something to anticipate, with delicious and healthy meals catering to dietary needs and tastes. The community is equipped with a club room, a spa, a wellness center, a swimming pool, and serene walking paths, perfect for socialization and recreation.

Quality ratings

Measured by Centers for Medicare & Medicaid Services (CMS)

Overall rating Info The Overall CMS Rating combines results from health inspections, staffing levels and quality measures. Health inspections carry the most weight. Staffing and quality scores can increase or decrease the final rating based on performance compared to state and national standards.
5/5 ▲ 1.8 Ohio average: 3.2/5
Health Inspection Info Based on the results of the facility's three most recent standard inspections and any complaint investigations. CMS reviews the number, scope, and severity of deficiencies, with more recent findings weighted more heavily.
4/5 ▲ 1.2 Ohio average: 2.8/5
Staffing Info Measures average nursing staff hours per resident per day, including Registered Nurses (RNs) and total nursing staff. Ratings are adjusted based on the level of care residents require and are compared to state and national benchmarks.
3/5 ▲ 0.6 Ohio average: 2.4/5
Quality Measures Info Based on clinical and physical health indicators reported to CMS, such as hospital readmissions, falls, pressure ulcers, and improvements in mobility. These measures reflect how well residents' health needs are being managed.
5/5 ▲ 0.6 Ohio average: 4.4/5

Staffing hours breakdown

Info Daily nursing hours per resident by staff type, reported to CMS. Higher is generally better — compare this facility to state and national averages to see where staffing stands.

Hours per resident per day — compared to Ohio state averages

Total nursing care / resident Info This home is ranked 45th out of 165 homes in Ohio.

Total adjusted nursing hours per resident per day, combining RN, LPN, and aide time. CMS adjusts this for case-mix so facilities can be fairly compared.
3h 52m per day
Rank #45 / 165Nurse hours — state benchmarkedThis home is ranked 45th out of 165 homes in Ohio.Shows adjusted nurse hours per resident per day benchmarked to the Ohio average, with a ranking across 165 Ohio SNFs. More hours mean more direct care. The national average is about 3.5 hrs; below 3.0 is a red flag.
This facility Ohio avg (3h 32m per day)
vs Ohio avg
+9%

3 of 6 metrics below state avg

Standout metric Physical Therapist is +100% above state avg
Staff typeHours / dayvs state avg
Registered Nurse (RN) Info RNs hold the highest nursing license and can assess residents, interpret test results, and direct care plans. More RN hours per day often signals stronger clinical oversight and faster response to health changes. 32m per day ▼ 16% State avg: 38m per day · National avg: 41m per day
LPN / LVN Info Licensed Practical Nurses (LPNs) or Licensed Vocational Nurses (LVNs) deliver routine hands-on care — medication administration, wound dressing, and monitoring vital signs. They work under RN supervision and make up a large share of daily bedside care. 1h 22m per day ▲ 41% State avg: 58m per day · National avg: 52m per day
Nurse Aide Info Certified Nurse Aides (CNAs) provide the most direct day-to-day assistance: bathing, dressing, feeding, and mobility. Nurse aide hours are typically the largest staffing category and directly affect residents' quality of life. 1h 42m per day ▼ 20% State avg: 2h 8m per day · National avg: 2h 20m per day
Total Nursing (Weekend) Info Combined nursing hours (RN + LPN + Nurse Aide) per resident per day on weekends. Staffing often drops on weekends — this figure reveals whether the facility maintains adequate coverage outside of weekday hours. 3h 34m per day ▲ 8% State avg: 3h 17m per day · National avg: 3h 26m per day
Physical Therapist Info Hours per resident per day provided by licensed Physical Therapists (PTs) or PT Assistants. PT services help residents recover mobility after injury or illness and are especially important for post-acute (short-stay) rehabilitation. 6m per day ▲ 100% State avg: 3m per day · National avg: 4m per day
RN (Weekend) Info Registered nurse hours specifically on weekends. Facilities sometimes reduce RN presence on Saturdays and Sundays — a low weekend RN figure compared to weekday hours can indicate reduced clinical oversight when most administrative staff are absent. 11m per day ▼ 56% State avg: 25m per day · National avg: 28m per day

Capacity and availability

This home usually has limited availability

Occupancy between 85% and 95% suggests balanced demand.

Higher occupancy than the Ohio average: 78.7%
Occupancy rate 85.9% Rank #63 / 166Occupancy rate — state benchmarkedThis home is ranked 63rd out of 166 homes in Ohio.Shows this facility's occupancy rate versus the Ohio average, with its statewide rank out of 166. Higher occupancy signals strong local demand and financial stability.
Avg. Length of Stay 93 days
Occupancy rate
85.9% Rank #63 / 166Occupancy rate — state benchmarkedThis home is ranked 63rd out of 166 homes in Ohio.Shows this facility's occupancy rate versus the Ohio average, with its statewide rank out of 166. Higher occupancy signals strong local demand and financial stability.
Avg. Length of Stay
93 days

Who this home usually serves

TYPE OF STAY

Primarily short stays

Residents typically stay for brief periods, with frequent admissions and discharges throughout the year.

Breakdown by payment type

Medicare

14% of new residents, usually for short-term rehab.

Typical stay 1 months

Private pay

79% of new residents, often for short stays.

Typical stay 3 - 4 months

Medicaid

6% of new residents, often for long-term daily care.

Typical stay 8 - 9 months

Finances and operations

Voluntary non-profit community
Home revenue
$15.0M
Operating deficit
-$3.6M
Voluntary non-profit community
Home revenue
$15.0M Rank #42 / 165Revenue — state benchmarkedThis home is ranked 42nd out of 165 homes in Ohio.Shows this facility's annual revenue compared to the Ohio SNF average. Higher revenue generally means more resources for staffing and capital — read alongside Payroll %.
Operating deficit
-$3.6M
Payroll costs Info The portion of the home's budget spent on staff, including nurses, caregivers, and other employees who support care and operations. Rank #39 / 165Payroll — state benchmarkedThis home is ranked 39th out of 165 homes in Ohio.Shows total annual staff payroll benchmarked to the Ohio average. Higher payroll investment relative to peers often signals better staffing and less reliance on cheaper contract labor.
$5.3M
35.2% of revenue Rank #92 / 165Payroll % — state benchmarkedThis home is ranked 92nd out of 165 homes in Ohio.Shows payroll as a percentage of revenue versus the Ohio average. Well-run SNFs often land around 55–65%. Below 25% may signal understaffing or heavy agency use — read with Staffing ratings.
Other operating costs Info All remaining costs needed to run the home, such as food, utilities, building maintenance, supplies and administrative expenses.
$13.3M
Total costs $18.6M
Walk Score
Walk Score: 47 / 100 Rank #45 / 115Walk Score — state benchmarkedThis home is ranked 45th out of 115 homes in Ohio.Shows how walkable this facility's neighborhood is compared to the average Walk Score across Ohio SNFs. Higher scores benefit residents, families, and staff.
Somewhat walkable. A few nearby services may be reachable on foot, but most trips require transportation.

About this community

Therapy & Rehabilitation

1 service
Rehabilitation Services

Staffing & Medical

1 service
Licensed Nurses/CNAs

Additional Services

1 service
Memory Support

Amenities & Lifestyle

Specific ProgramsHealthcare Services, Life Enrichment, Amenities, Health and Wellness, Community Partnerships, Maple Knoll Arboretum
Operating HoursMonday - Friday 8:00am - 4:00pm

What does this home offer?

Housing options icon

Housing Options: 1 Bed / 2 Bed

Building type icon
Building type icon

Building Type: 3-story

Dining services icon

Dining Services

Beauty services icon

Beauty Services

Transportation services icon

Transportation Services

Housekeeping icon
Housekeeping icon

Housekeeping Services

Recreational activities icon

Recreational Activities

Exercise program icon

Exercise Programs

Parking Available icon

Parking Available

Types of Care at Maple Knoll Village

Assisted Living Independent Living Memory Care Hospice Care

Contact Maple Knoll Village

Health Inspection History

Inspections
Total health inspections 5

Ohio average 6.7


Last Health inspection on Sep 2025

Total health citations
23 Rank #71 / 166Health citations — state benchmarkedThis home is ranked 71st out of 166 homes in Ohio.Shows this facility's total health deficiency citations benchmarked to the Ohio state average, with a ranking across all 166 OH SNFs. Lower citation counts earn a better rank.

Ohio average 30.9

Citations per inspection
4.6 Rank #110 / 166Citations per inspection — state benchmarkedThis home is ranked 110th out of 166 homes in Ohio.Shows average deficiency citations per CMS inspection for this facility versus the Ohio mean across 166 SNFs with citation data. Lower is better.

Ohio average 4.59


Health citations are formal notices following inspections when they fail to comply with safety and care standards.

19 of 23 citations resulted from standard inspections; and 4 of 23 resulted from complaint investigations.

Breakdown of citation severity (last 3 years)
Critical Health citations More info
0
100% better than Ohio average

Ohio average: 0.3


Serious Health citations More info 1
11% worse than Ohio average

Ohio average: 0.9

0 critical citations More info Ohio average: 0.3

1 serious citation More info Ohio average: 0.9

22 moderate citations More info Ohio average: 29

0 minor citations More info Ohio average: 0.7
Citations history (last 3 years)
Quality of Care moderate citation Info Issues related to how well residents receive appropriate treatment and support for their medical and daily care needs. Sep 25, 2025
Corrected

Quality of Care moderate citation Info Issues related to how well residents receive appropriate treatment and support for their medical and daily care needs. Sep 25, 2025
Corrected

Abuse/Neglect moderate citation Info Issues related to protecting resident's from harm, including abuse, neglect, or mistreatment. Dec 21, 2023
Corrected

Infection Control moderate citation Info Issues related to preventing and controlling infections, including hygiene practices and safety protocols. Dec 21, 2023
Corrected

Places of interest near Maple Knoll Village

Address 16.5 miles from city center Info Estimated distance in miles from Cincinnati's city center to Maple Knoll Village's address, calculated via Google Maps.

Calculate Travel Distance to Maple Knoll Village

Add your location

Address

Staffing Data (Q2 2025)

This data corresponds to Q2 2025 and is based on CMS Payroll-Based Journal.

Total staff 113
Employees 85
Contractors 28
Staff to resident ratio 1.49:1
31% worse than Ohio average

Ohio average ratio: 2.14:1

Avg staff/day 41
Average shift 8.2 hours
0% compared with Ohio average

Ohio average: 8.1 hours

Total staff hours (quarter) 30,580
Nursing staff breakdown
Registered Nurse

Manages medical care and health needs.

Total count 6
Average shift length Info Average shift length. Calculated as total hours divided by days worked and average staff per day. 8.6 hours

No contractors work on this role.

Licensed Practical Nurse

Assists with medical care and medications.

Total count 31
Average shift length Info Average shift length. Calculated as total hours divided by days worked and average staff per day. 9.3 hours

No contractors work on this role.

Certified Nursing Assistant

Helps with daily care and mobility.

Total count 37
Average shift length Info Average shift length. Calculated as total hours divided by days worked and average staff per day. 9 hours

No contractors work on this role.

Contractor staffing

Total hours from contractors

10.3%

3,135 contractor hours this quarter

Physical Therapy Aide: 7 Speech Language Pathologist: 6 Respiratory Therapy Technician: 5 Physical Therapy Assistant: 3 Qualified Social Worker: 3 Occupational Therapy Aide: 1 Occupational Therapy Assistant: 1 Diagnostic X-ray Services Staff: 1 Medical Director: 1
Staff by category
Certified Nursing Assistant3703712,01091100%9
Licensed Practical Nurse310319,27391100%9.3
Registered Nurse6061,94191100%8.6
Dietitian4041,4928796%7.5
Clinical Nurse Specialist3031,1337077%6.6
Mental Health Service Worker2028996470%7.2
Speech Language Pathologist0666896571%5.2
Respiratory Therapy Technician0556416673%5.3
Occupational Therapy Aide0115206571%8
Nurse Practitioner1014725965%8
Qualified Social Worker0334506470%6.3
Physical Therapy Aide0774086774%4.5
Physical Therapy Assistant0333585257%6.9
Administrator1012245662%4
Medical Director011451415%3.2
Occupational Therapy Assistant0111933%6.2
Diagnostic X-ray Services Staff011633%2
37 Certified Nursing Assistant
% of Days 100%
31 Licensed Practical Nurse
% of Days 100%
6 Registered Nurse
% of Days 100%
4 Dietitian
% of Days 96%
3 Clinical Nurse Specialist
% of Days 77%
2 Mental Health Service Worker
% of Days 70%
6 Speech Language Pathologist
% of Days 71%
5 Respiratory Therapy Technician
% of Days 73%
1 Occupational Therapy Aide
% of Days 71%
1 Nurse Practitioner
% of Days 65%
3 Qualified Social Worker
% of Days 70%
7 Physical Therapy Aide
% of Days 74%
3 Physical Therapy Assistant
% of Days 57%
1 Administrator
% of Days 62%
1 Medical Director
% of Days 15%
1 Occupational Therapy Assistant
% of Days 3%
1 Diagnostic X-ray Services Staff
% of Days 3%

Facility Characteristics

Source: CMS Long-Term Care Facility Characteristics (Data as of Jan 2026)

Total residents 76
Medicare
9
11.8% of residents
Medicaid
44
57.9% of residents
Private pay or other
23
30.3% of residents
Programs & Services
Residents Group

Residents meet regularly to discuss policies, care quality, and activities

Nurse Aide Training

State-approved Nurse Aide Training and Competency Evaluation Program on-site

CCRC

Part of a Continuing Care Retirement Community offering multiple care levels

Active Resident Council

Organized group of residents that meets regularly to discuss facility policies, quality of life, and activities.

Quality of care over time

These measures show how residents usually do over time at this home, based on health outcomes and preventive care.

High-risk clinical events score Info A composite score based on pressure ulcers, falls with injury, weight loss, walking ability decline, and activities of daily living decline. 3.8
35% better than Ohio average

Ohio average: 5.8

Functional decline score Info A composite score based on activities of daily living decline, walking ability decline, and incontinence. 12.7
In line with Ohio average

Ohio average: 12.7

Long-stay resident measures
Significantly above average Ohio avg: 4.7 Info CMS star rating based on long-stay quality measure performance. 5 stars = significantly above average, 1 star = significantly below average.
Need for Help with Daily Activities Increased Info Percent of long-stay residents whose need for help with daily activities has increased 5.7%
17% better than Ohio average

Ohio average: 6.8%

Walking Ability Worsened Info Percent of long-stay residents whose ability to move independently worsened 6.5%
27% better than Ohio average

Ohio average: 8.9%

Low Risk Residents with Bowel/Bladder Incontinence Info Percent of low risk long-stay residents who lose control of their bowels or bladder 26.0%
18% worse than Ohio average

Ohio average: 22.0%

Falls with Major Injury Info Percent of long-stay residents experiencing one or more falls with major injury 1.2%
65% better than Ohio average

Ohio average: 3.4%

High Risk Residents with Pressure Ulcers Info Percent of long-stay high risk residents with pressure ulcers 0.0%
100% better than Ohio average

Ohio average: 3.9%

Urinary Tract Infection Info Percent of long-stay residents with a urinary tract infection 0.4%
27% better than Ohio average

Ohio average: 0.5%

Lost Too Much Weight Info Percent of long-stay residents who lose too much weight 5.6%
9% better than Ohio average

Ohio average: 6.2%

Depressive Symptoms Info Percent of long-stay residents who have depressive symptoms 5.3%
78% better than Ohio average

Ohio average: 24.0%

Antipsychotic Use Info Percent of long-stay residents who received an antipsychotic medication 11.6%
38% worse than Ohio average

Ohio average: 8.4%

Pneumococcal Vaccine Info Percent of long-stay residents assessed and appropriately given the pneumococcal vaccine 100.0%
8% better than Ohio average

Ohio average: 92.4%

Influenza Vaccine Info Percent of long-stay residents assessed and appropriately given the seasonal influenza vaccine 98.4%
In line with Ohio average

Ohio average: 94.5%

Hospitalizations per 1,000 days Info Number of hospitalizations per 1,000 long-stay resident days. 1.52
14% better than Ohio average

Ohio average: 1.77

ED visits per 1,000 days Info Number of outpatient emergency department visits per 1,000 long-stay resident days. 0.24
87% better than Ohio average

Ohio average: 1.83

Short-stay resident measures
Significantly above average Ohio avg: 2.4 Info CMS star rating based on short-stay quality measure performance. 5 stars = much above average, 1 star = much below average.
Pneumococcal Vaccine Info Percent of short-stay residents assessed and appropriately given the pneumococcal vaccine 99.5%
27% better than Ohio average

Ohio average: 78.0%

Antipsychotic medication increase Info Percent of short-stay residents who newly received an antipsychotic medication 1.0%
25% better than Ohio average

Ohio average: 1.3%

Influenza Vaccine Info Percent of short-stay residents assessed and appropriately given the seasonal influenza vaccine 91.1%
21% better than Ohio average

Ohio average: 75.6%

Re-hospitalized after SNF stay Info Percentage of short-stay residents who were re-hospitalized after their nursing home admission. 29.2%
16% worse than Ohio average

Ohio average: 25.1%

Emergency department visits Info Percentage of short-stay residents who had an outpatient emergency department visit. 11.0%
12% better than Ohio average

Ohio average: 12.5%

Falls with major injury Info Percentage of SNF residents who experience falls with major injury during their stay. 0.0%
100% better than Ohio average

Ohio average: 0.8%

Ability to care for self at discharge Info Percentage of residents at or above expected ability to care for themselves at discharge. 74.5%
39% better than Ohio average

Ohio average: 53.7%

Successful return to home or community Info Rate of successful return to home or community from a skilled nursing facility. 59.8%
18% better than Ohio average

Ohio average: 50.6%

Penalties and fines

Federal penalties imposed by CMS for regulatory violations, including civil money penalties (fines) and denials of payment for new Medicare/Medicaid admissions.

Source: CMS Penalties Database

Penalty History

Penalties are imposed by CMS for violations of federal nursing home regulations.

No penalties in the past 3 years

No civil money penalties or payment denials were reported in the last 3 years.

Compare Assisted Living around Cincinnati The information below is reported by the Ohio Department of Health, Bureau of Survey and Certification.

Filter by care type
Maple Knoll Village
NH

Nursing Home Licensed facility providing 24/7 skilled nursing care for residents with complex, ongoing medical needs. Staffed by RNs, LPNs, and CNAs. Inspected and star-rated annually by CMS. Accepts Medicare (short-term rehab) and Medicaid (long-term care).

AL

Assisted Living A licensed, long-term care setting for seniors or individuals with disabilities who need help with daily activities — like bathing, dressing, and medication management — but not 24-hour skilled nursing. Offers housing, meals, and around-the-clock support while aiming to maximize resident independence.

HC

Home Care Professional care delivered in the person's own home — from companionship and errands to skilled nursing and therapy. Allows seniors to age in place. Medicare covers skilled home health when medically necessary.

IL

Independent Living Lifestyle-focused communities for older adults offering dining, activities, and transportation with minimal personal care. Best for active, independent seniors who want community without medical support.

MC

Memory Care Secured, specialized care for people living with Alzheimer's or dementia. Staff trained in cognitive impairment, with higher staff-to-resident ratios and an environment designed to reduce confusion and wandering risk.

Cincinnati90No 47 1 Bed / 2 Bed---0
Brookdale Kenwood
AL

Assisted Living A licensed, long-term care setting for seniors or individuals with disabilities who need help with daily activities — like bathing, dressing, and medication management — but not 24-hour skilled nursing. Offers housing, meals, and around-the-clock support while aiming to maximize resident independence.

MC

Memory Care Secured, specialized care for people living with Alzheimer's or dementia. Staff trained in cognitive impairment, with higher staff-to-resident ratios and an environment designed to reduce confusion and wandering risk.

Cincinnati47Yes 43 1 Bed / 2 BedA+-820
Brookdale Finneytown
AL

Assisted Living A licensed, long-term care setting for seniors or individuals with disabilities who need help with daily activities — like bathing, dressing, and medication management — but not 24-hour skilled nursing. Offers housing, meals, and around-the-clock support while aiming to maximize resident independence.

MC

Memory Care Secured, specialized care for people living with Alzheimer's or dementia. Staff trained in cognitive impairment, with higher staff-to-resident ratios and an environment designed to reduce confusion and wandering risk.

Cincinnati39Yes 54 1 Bed / 2 BedA+-896
Northgate Park
AL

Assisted Living A licensed, long-term care setting for seniors or individuals with disabilities who need help with daily activities — like bathing, dressing, and medication management — but not 24-hour skilled nursing. Offers housing, meals, and around-the-clock support while aiming to maximize resident independence.

Cincinnati-Yes 48 1 Bed / 2 Bed--855
Barrington of Oakley
AL

Assisted Living A licensed, long-term care setting for seniors or individuals with disabilities who need help with daily activities — like bathing, dressing, and medication management — but not 24-hour skilled nursing. Offers housing, meals, and around-the-clock support while aiming to maximize resident independence.

MC

Memory Care Secured, specialized care for people living with Alzheimer's or dementia. Staff trained in cognitive impairment, with higher staff-to-resident ratios and an environment designed to reduce confusion and wandering risk.

Cincinnati (Madisonville)-Yes 42 1 Bed / 2 BedA+Tyler Oldham871

Guides for Better Senior Living

Care Cost Calculator: See Prices in Your Area

Nursing Home Data Explorer

Don’t Wait Too Long: 7 Red Flag Signs Your Parent Needs Assisted Living Now

The True Cost of Assisted Living in 2025 – And How Families Are Paying For It

Understanding Senior Living Costs: Pricing Models, Discounts & Financial Assistance

Explore Open Rooms
1 Contact details
2 What type of senior care service are you looking for?
3 What budget do you have in mind for senior care?
4 How soon do you need to find care?
5 Additional details

Thank you for your interest!

Our team will be in touch shortly to help with next steps.