Discovery Nursing & Rehab of Vancouver
Nursing Home & Palliative Care · Vancouver, WA
CMS overall rating Info CMS (the Centers for Medicare & Medicaid Services) is the federal agency that rates nursing home quality. Its Overall Rating runs from 1 to 5 stars, combining health inspections, staffing, and quality measures, with inspections weighted most heavily.

Discovery Nursing & Rehab of Vancouver

Nursing Home & Palliative Care · Vancouver, WA
CMS overall rating Info CMS (the Centers for Medicare & Medicaid Services) is the federal agency that rates nursing home quality. Its Overall Rating runs from 1 to 5 stars, combining health inspections, staffing, and quality measures, with inspections weighted most heavily.
Calculator: See prices in your area
Discovery Nursing & Rehab of Vancouver accepts Medicare, Medicaid, and private pay.

Overview of Discovery Nursing & Rehab of Vancouver

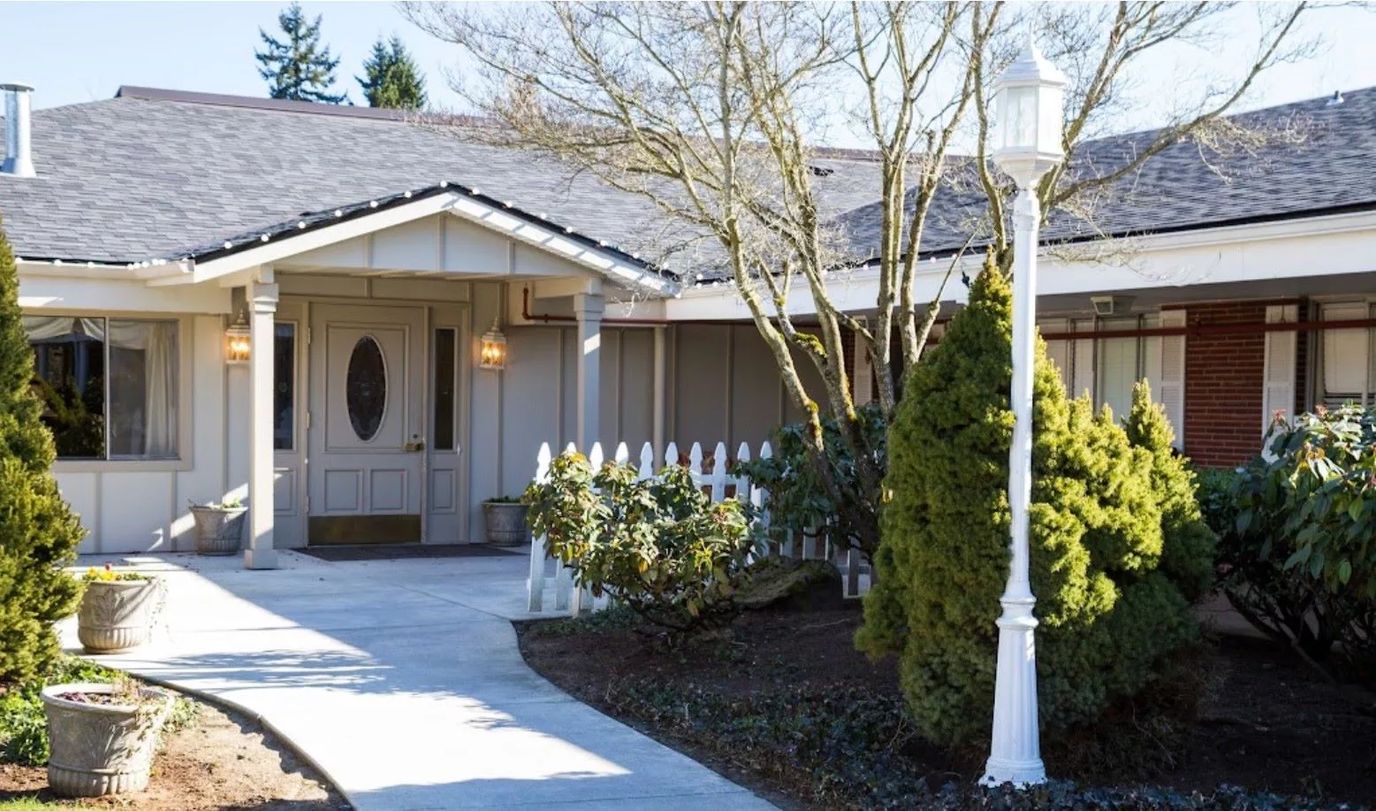
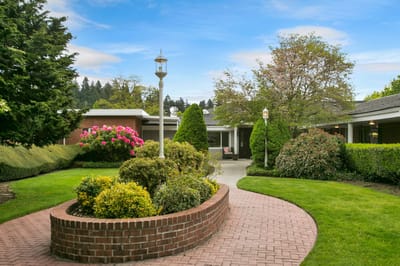
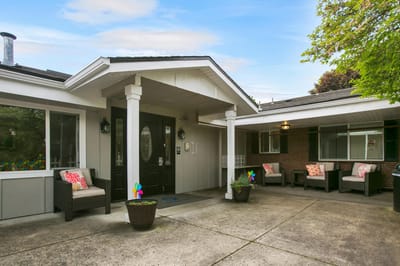
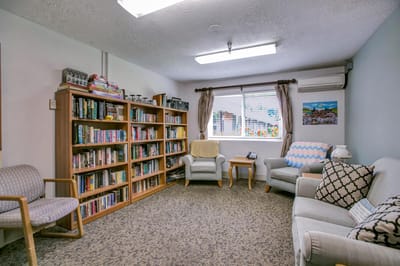
Under Prestige Senior Living management, Discovery Nursing & Rehabilitation occupies a campus-style setting in Vancouver’s Hazel Dell neighborhood, 2.4 miles from downtown. The 89-bed skilled nursing center targets post-acute rehabilitation residents with an average 47-day stay, accepting Medicare (29% of new admissions), private-pay (60%), and Medicaid (12%). The facility’s current resident census of 64 reflects 45.3% Medicaid-funded long-term stays, 29.7% Medicare short-term rehabilitation, and 25% private-pay placements.

Clinical staffing totals 4 hours 43 minutes of daily nursing care per resident; among the top 10% statewide. Yet 61% of the nursing workforce consists of contract labor.

Physical therapy services stand significantly above peer levels at 12 minutes daily per resident, 140% higher than state norms.

Long-stay residents experience walking ability decline in 40.7% of cases, nearly double the 21.8% state average. Falls with major injury strike 6.1% of long-term residents versus a 2.6% state benchmark. Weight loss affects 13.3% of long-stay residents, more than double the 5.8% state rate. Short-stay rehabilitation residents show a similarly poor discharge profile: only 29.3% leave with expected self-care ability, compared to the 53.7% state average.

Emergency department utilization for short-stay residents runs at 24.7%, nearly twice the 13.2% state rate.

Four separate penalties totaling $198K were issued between October 2023 and April 2025; a rate 142% above Washington’s average.

Simultaneously, occupancy has collapsed from 77.3% (2022) to 60.2% (2023), and the facility operates at a $603K annual loss.

Discovery Nursing & Rehabilitation maintains rehabilitation capacity but faces compounding financial, operational, and clinical performance deficits.

(360) 693-1474

Quality ratings

Measured by Centers for Medicare & Medicaid Services (CMS)

Overall rating Info The Overall CMS Rating combines results from health inspections, staffing levels and quality measures. Health inspections carry the most weight. Staffing and quality scores can increase or decrease the final rating based on performance compared to state and national standards.
▼ 38.0% Below WA avg. ▼ 38.0% Below WA avg.WA average: 3.2Click the badge to see the full State ranking.Click here to see the full State ranking.
Health Inspection Info Based on the results of the facility's three most recent standard inspections and any complaint investigations. CMS reviews the number, scope, and severity of deficiencies, with more recent findings weighted more heavily.
▼ 29.0% Below WA avg. ▼ 29.0% Below WA avg.WA average: 2.8Click the badge to see the full State ranking.Click here to see the full State ranking.
Staffing Info Measures average nursing staff hours per resident per day, including Registered Nurses (RNs) and total nursing staff. Ratings are adjusted based on the level of care residents require and are compared to state and national benchmarks.
▲ 16.8% Above WA avg. ▲ 16.8% Above WA avg.WA average: 3.4Click the badge to see the full State ranking.Click here to see the full State ranking.
Quality Measures Info Based on clinical and physical health indicators reported to CMS, such as hospital readmissions, falls, pressure ulcers, and improvements in mobility. These measures reflect how well residents' health needs are being managed.
▼ 23.7% Below WA avg. ▼ 23.7% Below WA avg.WA average: 3.9Click the badge to see the full State ranking.Click here to see the full State ranking.

Staffing hours breakdown

Info Daily nursing hours per resident by staff type, reported to CMS. Higher is generally better — compare this facility to state and national averages to see where staffing stands.

Hours per resident per day — compared to Washington state averages

Total nursing care / resident Info This home is ranked 10th out of 90 homes in Washington for nurse hours. Total adjusted nursing hours per resident per day, combining RN, LPN, and aide time. CMS adjusts this for case-mix so facilities can be fairly compared.
4h 43m per day
Rank #10 / 90Nurse hours — State benchmarkedThis home is ranked 10th out of 90 homes in Washington. Shows adjusted nurse hours per resident per day benchmarked to the Washington average, with a ranking across 90 Washington facilities. More hours mean more direct care. The national average is about 3.5 hrs; below 3.0 is a red flag.Rankings are based only on facilities in Washington that report data for that category. Facilities without available data are excluded from the ranking.Click the rank badge to see the full State ranking.Click here to see the full State ranking.
This facility Washington avg (4h 13m per day)
vs Washington avg
+12%

4 of 6 metrics below state avg

Standout metric Physical Therapist is +85% above state avg
Staff typeHours / Day / Residentvs state avg
Registered Nurse (RN) Info RNs hold the highest nursing license and can assess residents, interpret test results, and direct care plans. More RN hours per day often signals stronger clinical oversight and faster response to health changes. 45m per day ▼ 15% State avg: 53m per day · National avg: 41m per day
LPN / LVN Info Licensed Practical Nurses (LPNs) or Licensed Vocational Nurses (LVNs) deliver routine hands-on care — medication administration, wound dressing, and monitoring vital signs. They work under RN supervision and make up a large share of daily bedside care. 1h 2m per day ▲ 26% State avg: 49m per day · National avg: 52m per day
Nurse Aide Info Certified Nurse Aides (CNAs) provide the most direct day-to-day assistance: bathing, dressing, feeding, and mobility. Nurse aide hours are typically the largest staffing category and directly affect residents' quality of life. 2h 23m per day ▼ 11% State avg: 2h 41m per day · National avg: 2h 21m per day
Weekend Total Nursing Info Combined nursing hours (RN + LPN + Nurse Aide) per resident per day on weekends. Staffing often drops on weekends — this figure reveals whether the facility maintains adequate coverage outside of weekday hours. 3h 33m per day ▼ 6% State avg: 3h 47m per day · National avg: 3h 26m per day
Physical Therapist Info Hours per resident per day provided by licensed Physical Therapists (PTs) or PT Assistants. PT services help residents recover mobility after injury or illness and are especially important for post-acute (short-stay) rehabilitation. 9m per day ▲ 85% State avg: 5m per day · National avg: 4m per day
Weekend RN Info Registered nurse hours specifically on weekends. Facilities sometimes reduce RN presence on Saturdays and Sundays — a low weekend RN figure compared to weekday hours can indicate reduced clinical oversight when most administrative staff are absent. 26m per day ▼ 33% State avg: 38m per day · National avg: 29m per day

Capacity and availability

This home usually has availability

Lower occupancy than the Washington average: 72.5%
Occupancy rate
60.2% Rank #248 / 310Occupancy rate — State benchmarkedThis home is ranked 248th out of 310 homes in Washington. Shows this facility's occupancy rate versus the Washington average, with its Statewide rank out of 310. Higher occupancy signals strong local demand and financial stability.Rankings are based only on facilities in Washington that report data for that category. Facilities without available data are excluded from the ranking.Click the rank badge to see the full State ranking.Click here to see the full State ranking.
Avg. Length of Stay
47 days
Bed community size
89-bed community Rank #142 / 366Bed count — State benchmarkedThis home is ranked 142nd out of 366 homes in Washington. Shows this facility's certified or reported bed count compared to other Washington facilities. Larger communities may offer more amenities, programs, and on-site services for residents and families.Rankings are based only on facilities in Washington that report data for that category. Facilities without available data are excluded from the ranking.Click the rank badge to see the full State ranking.Click here to see the full State ranking.
A larger shared setting that may offer more common spaces and organized community services.
Walk Score
Walk Score: 19 / 100 Rank #532 / 628Walk Score — State benchmarkedThis home is ranked 532nd out of 628 homes in Washington. Shows how walkable this facility's neighborhood is compared to the average Walk Score across Washington facilities. Higher scores benefit residents, families, and staff.Rankings are based only on facilities in Washington that report data for that category. Facilities without available data are excluded from the ranking.Click the rank badge to see the full State ranking.Click here to see the full State ranking.
Car-dependent. Most errands require a car, with limited nearby walkable options.

Contact Discovery Nursing & Rehab of Vancouver

Staffing Data

Reporting period: October 1 – December 31, 2025 (Q4 2025). Source: CMS Payroll-Based Journal report.

Total staff 232
Employees 91
Contractors 141
Staff to resident ratio 3.63 : 1
95% more staff per resident than Washington average
Washington average ratio: 1.86 : 1 Washington average ratio: 1.86 : 1See full Washington ranking
Avg staff/day 44
Average shift 7.9 hours
0% compared with Washington average
Washington average: 8.1 hours Washington average shift: 8.1 hoursSee full Washington ranking
Total staff hours (quarter) 31,928

Nursing staff breakdown

Q4 2025 · Oct 1 – Dec 31 More info This data comes from the CMS Payroll-Based Journal report covering October 1 – December 31, 2025.
Registered Nurse

Manages medical care and health needs.

RN Staff Info 29 total: 11 full-time employees and 18 contractors. 29
Average shift length Info Average shift length. Calculated as total hours divided by days worked and average staff per day. 8.2 hours
Licensed Practical Nurse

Assists with medical care and medications.

LPN Staff Info 70 total: 14 full-time employees and 56 contractors. 70
Average shift length Info Average shift length. Calculated as total hours divided by days worked and average staff per day. 8.5 hours
Certified Nursing Assistant

Helps with daily care and mobility.

CNA Staff Info 105 total: 38 full-time employees and 67 contractors. 105
Average shift length Info Average shift length. Calculated as total hours divided by days worked and average staff per day. 8.2 hours

Contractor staffing

Q4 2025 · Oct 1 – Dec 31 More info This data comes from the CMS Payroll-Based Journal report covering October 1 – December 31, 2025.

Total hours from contractors

13%

4,150 contractor hours this quarter

Certified Nursing Assistant: 67 Licensed Practical Nurse: 56 Registered Nurse: 18

Staff by category

Q4 2025 · Oct 1 – Dec 31 More info This data comes from the CMS Payroll-Based Journal report covering October 1 – December 31, 2025.
Certified Nursing Assistant386710515,50492100%8.2
Licensed Practical Nurse1456706,65692100%8.5
Registered Nurse1118293,86492100%8.2
Dental Services Staff3031,3366571%8
Respiratory Therapy Technician6069988390%6.1
Administrator2029206470%8.2
Clinical Nurse Specialist1014995560%9.1
Nurse Practitioner1014966267%8
Dietitian1014806368%7.6
Physical Therapy Assistant3033717177%4.4
Other Dietary Services Staff2022695155%5.3
Speech Language Pathologist4042463740%5.2
Occupational Therapy Aide1011432022%7.1
Physical Therapy Aide202791011%7.2
Qualified Social Worker202673134%2.2
105 Certified Nursing Assistant
% of Days 100%
70 Licensed Practical Nurse
% of Days 100%
29 Registered Nurse
% of Days 100%
3 Dental Services Staff
% of Days 71%
6 Respiratory Therapy Technician
% of Days 90%
2 Administrator
% of Days 70%
1 Clinical Nurse Specialist
% of Days 60%
1 Nurse Practitioner
% of Days 67%
1 Dietitian
% of Days 68%
3 Physical Therapy Assistant
% of Days 77%
2 Other Dietary Services Staff
% of Days 55%
4 Speech Language Pathologist
% of Days 40%
1 Occupational Therapy Aide
% of Days 22%
2 Physical Therapy Aide
% of Days 11%
2 Qualified Social Worker
% of Days 34%

Penalties and fines

Includes penalties issued in 2023-2025

Federal penalties imposed by CMS for regulatory violations, including civil money penalties (fines) and denials of payment for new Medicare/Medicaid admissions.

Source: CMS Penalties Database (Data as of Jan 2026)

Total fines amount $198K Rank #83 / 92Federal fines — State benchmarkedThis home is ranked 83rd out of 92 homes in Washington. Shows this facility's cumulative CMS federal fine dollars versus the Washington average among facilities with fines, and where it ranks among 92 facilities in the pool. Lower total dollars mean a better rank.Rankings are based only on facilities in Washington that report data for that category. Facilities without available data are excluded from the ranking.Click the rank badge to see the full State ranking.Click here to see the full State ranking.
142% higher than Washington average

Washington average: $82K

Number of fines 4
117% more fines than Washington average

Washington average: 1.8

Payment Denials Info Serious action where Medicare and/or Medicaid temporarily stops payments for new residents until issues are fixed. 0
100% fewer payment denials than Washington average

Washington average: 0.3

Fines amount comparison
This facility $198K
Washington average $82K
Penalty History

Penalties are imposed by CMS for violations of federal nursing home regulations.

4 penalties in the past 3 years

Multiple penalties were reported in the last 3 years.

Civil Money Penalty Info Fines imposed for noncompliance, which can be assessed per day or per instance of violation. Apr 24, 2025
$108K
Civil Money Penalty Info Fines imposed for noncompliance, which can be assessed per day or per instance of violation. Feb 27, 2025
$55K
Civil Money Penalty Info Fines imposed for noncompliance, which can be assessed per day or per instance of violation. Nov 14, 2023
$28K
Civil Money Penalty Info Fines imposed for noncompliance, which can be assessed per day or per instance of violation. Oct 2, 2023
$7K

Last updated: Jan 2026

Quality of care over time

These measures show how residents usually do over time at this home, based on health outcomes and preventive care.

High-risk clinical events score Info A composite score based on pressure ulcers, falls with injury, weight loss, walking ability decline, and activities of daily living decline. 17.9
78% worse than Washington average

Washington average: 10.0

Functional decline score Info A composite score based on activities of daily living decline, walking ability decline, and incontinence. 28.8
38% worse than Washington average

Washington average: 20.9

Long-stay resident measures
Significantly below average Washington avg: 3.6 Info CMS star rating based on long-stay quality measure performance. 5 stars = significantly above average, 1 star = significantly below average.
Need for Help with Daily Activities Increased Info Percent of long-stay residents whose need for help with daily activities has increased 21.9%
33% worse than Washington average

Washington average: 16.4%

Walking Ability Worsened Info Percent of long-stay residents whose ability to move independently worsened 40.7%
87% worse than Washington average

Washington average: 21.8%

Low Risk Residents with Bowel/Bladder Incontinence Info Percent of low risk long-stay residents who lose control of their bowels or bladder 23.7%
In line with Washington average

Washington average: 24.3%

Falls with Major Injury Info Percent of long-stay residents experiencing one or more falls with major injury 6.1%
133% worse than Washington average

Washington average: 2.6%

High Risk Residents with Pressure Ulcers Info Percent of long-stay high risk residents with pressure ulcers 7.3%
48% worse than Washington average

Washington average: 4.9%

Urinary Tract Infection Info Percent of long-stay residents with a urinary tract infection 1.1%
37% better than Washington average

Washington average: 1.7%

Lost Too Much Weight Info Percent of long-stay residents who lose too much weight 13.3%
129% worse than Washington average

Washington average: 5.8%

Depressive Symptoms Info Percent of long-stay residents who have depressive symptoms 10.2%
37% better than Washington average

Washington average: 16.2%

Antipsychotic Use Info Percent of long-stay residents who received an antipsychotic medication 11.8%
18% better than Washington average

Washington average: 14.5%

Pneumococcal Vaccine Info Percent of long-stay residents assessed and appropriately given the pneumococcal vaccine 95.0%
In line with Washington average

Washington average: 96.2%

Influenza Vaccine Info Percent of long-stay residents assessed and appropriately given the seasonal influenza vaccine 93.2%
In line with Washington average

Washington average: 93.8%

Short-stay resident measures
Average Washington avg: 3.6 Info CMS star rating based on short-stay quality measure performance. 5 stars = much above average, 1 star = much below average.
Pneumococcal Vaccine Info Percent of short-stay residents assessed and appropriately given the pneumococcal vaccine 69.4%
21% worse than Washington average

Washington average: 88.1%

Antipsychotic medication increase Info Percent of short-stay residents who newly received an antipsychotic medication 0.9%
38% better than Washington average

Washington average: 1.4%

Influenza Vaccine Info Percent of short-stay residents assessed and appropriately given the seasonal influenza vaccine 63.4%
23% worse than Washington average

Washington average: 82.0%

Re-hospitalized after SNF stay Info Percentage of short-stay residents who were re-hospitalized after their nursing home admission. 23.4%
18% worse than Washington average

Washington average: 19.9%

Emergency department visits Info Percentage of short-stay residents who had an outpatient emergency department visit. 24.7%
87% worse than Washington average

Washington average: 13.2%

Falls with major injury Info Percentage of SNF residents who experience falls with major injury during their stay. 0.0%
100% better than Washington average

Washington average: 0.8%

Ability to care for self at discharge Info Percentage of residents at or above expected ability to care for themselves at discharge. 29.3%
45% worse than Washington average

Washington average: 53.7%

Successful return to home or community Info Rate of successful return to home or community from a skilled nursing facility. 66.3%
31% better than Washington average

Washington average: 50.6%

Breakdown by payment type

Medicare

29% of new residents, usually for short-term rehab.

Typical stay 21 days

Private pay

60% of new residents, often for short stays.

Typical stay 30 days

Medicaid

12% of new residents, often for long-term daily care.

Typical stay 6 - 7 months

Facility Characteristics

Source: CMS Long-Term Care Facility Characteristics (Data as of Jan 2026)

Total residents 64
Medicare
19
29.7% of residents
Medicaid
29
45.3% of residents
Private pay or other
16
25% of residents
Programs & Services
Residents Group

Residents meet regularly to discuss policies, care quality, and activities

Active Resident Council

Organized group of residents that meets regularly to discuss facility policies, quality of life, and activities.

Finances and operations

Based on CMS SNF Cost Report for fiscal year ending in 12/2023.

Privately-owned community
Operated by a single business entity.
Net patient revenue Info Net patient revenue — what the home actually collects for resident care, after contractual allowances, bad debt and discounts are subtracted from its gross charges (CMS cost report, Worksheet G-3). It covers resident care only; money the home earns from other sources is shown separately as "Other income."
$8.9M
Net patient income Info Net patient income: net patient revenue minus the home's total operating expenses. A positive figure means it earns more from resident care than it spends to deliver it; a negative figure means the opposite. It excludes non-operating "other income."
-$1.1M
Privately-owned community Operated by a single business entity.
Net patient revenue Info Net patient revenue — what the home actually collects for resident care, after contractual allowances, bad debt and discounts are subtracted from its gross charges (CMS cost report, Worksheet G-3). It covers resident care only; money the home earns from other sources is shown separately as "Other income."
$8.9M Rank #49 / 94Revenue — State benchmarkedThis home is ranked 49th out of 94 homes in Washington. Shows this facility's annual revenue compared to the Washington average. Higher revenue generally means more resources for staffing and capital — read alongside Payroll %.Rankings are based only on facilities in Washington that report data for that category. Facilities without available data are excluded from the ranking.Click the rank badge to see the full State ranking.Click here to see the full State ranking.
Net patient income Info Net patient income: net patient revenue minus the home's total operating expenses. A positive figure means it earns more from resident care than it spends to deliver it; a negative figure means the opposite. It excludes non-operating "other income."
-$1.1M
Other income Info Money the home earns outside of resident care — such as investments, grants, rentals and other non-operating sources (CMS cost report, Worksheet G-3). It is tracked separately from net patient revenue: it is not part of that figure, and it is not included in net patient income.
$2.5M
Payroll costs Info Staff salaries plus wage-related costs — benefits such as payroll taxes, health insurance and retirement — from the home's own accounting records (CMS cost report, Worksheet A). Contract or agency labor is counted separately, under other operating costs. Rank #64 / 94Payroll — State benchmarkedThis home is ranked 64th out of 94 homes in Washington. Shows total annual staff payroll benchmarked to the Washington average. Higher payroll investment relative to peers often signals better staffing and less reliance on cheaper contract labor.Rankings are based only on facilities in Washington that report data for that category. Facilities without available data are excluded from the ranking.Click the rank badge to see the full State ranking.Click here to see the full State ranking.
$5.6M 62.5% of net patient revenue Info Payroll as a share of revenue: staff salaries and wage-related benefits divided by net patient revenue. A higher figure means more of each revenue dollar goes to staff pay. Rank #73 / 94Payroll % — State benchmarkedThis home is ranked 73rd out of 94 homes in Washington. Shows payroll as a percentage of revenue versus the Washington average. Well-run Washington facilities typically land around 53–61% — the top third Statewide. Below 25% may signal understaffing or heavy agency use — read with Staffing ratings.Rankings are based only on facilities in Washington that report data for that category. Facilities without available data are excluded from the ranking.Click the rank badge to see the full State ranking.Click here to see the full State ranking.
Other operating costs Info Everything it costs to run the home apart from payroll — food, utilities, supplies, maintenance, contract labor and administration. Calculated as total operating expense minus payroll (staff salaries and wage-related benefits).
$4.5M
Total costs Info The home's total operating expense for the year — all the costs of running it, salaries included (CMS cost report, Worksheet G-3).
$10.0M

Who this home usually serves

TYPE OF STAY

Primarily short stays

Residents typically stay for brief periods, with frequent admissions and discharges throughout the year.

Most new residents arrive under private pay (60% of admissions), and a typical private pay stay runs around 30 days.

Admissions
403 total

Coverage residents most often arrive under.

Medicare 29%
Private pay 60%
Medicaid 12%
Discharges
415 total

Coverage residents most often leave under.

Medicare 23%
Private pay 53%
Medicaid 24%

Places of interest near Discovery Nursing & Rehab of Vancouver

Address 2.4 miles from city center Info Estimated distance in miles from Vancouver's city center to Discovery Nursing & Rehab of Vancouver's address, calculated via Google Maps.

Calculate Travel Distance to Discovery Nursing & Rehab of Vancouver

Add your location

Address

Compare Nursing Homes around Vancouver

The information below is reported by the Washington Department of Social and Health Services, Residential Care Services.

2 facilities compared · CMS & WA Dept. of Health data

Avamere Rehabilitation of Cascade Park
NH
PC
RC
Vancouver (Cascade Highlands)
88
Facility 88
WA AVG 82
Rank #144 / 366
89.5%
Facility 89.5%
WA AVG 72.5%
Rank #49 / 310
+23%
4.49
Facility 4.49
WA AVG 4.22
Rank #17 / 90
+1%+6%
$0
Facility $0
WA AVG $87.7k
Rank #1 / 92
35
Facility 35
WA AVG 48.9
Rank #29 / 92
5.8
Facility 5.8
WA AVG 6.9
Rank #39 / 92
182-
56
Facility 56
WA AVG 51
Rank #281 / 628
Ryan Rose
$16.1M
Facility $16.1M
WA AVG $13.2M
Rank #29 / 94
$7.7M
Facility $7.7M
WA AVG $5.7M
Rank #37 / 94
48%
Facility 48%
WA AVG 45.5%
Rank #70 / 94
505389
Discovery Nursing & Rehab of Vancouver
NH
PC
Vancouver (Hazel Dell South)
89
Facility 89
WA AVG 82
Rank #142 / 366
60.2%
Facility 60.2%
WA AVG 72.5%
Rank #248 / 310
-17%
4.71
Facility 4.71
WA AVG 4.22
Rank #10 / 90
-13%+12%
$220.9k
Facility $220.9k
WA AVG $87.7k
Rank #83 / 92
44
Facility 44
WA AVG 48.9
Rank #40 / 92
4.4
Facility 4.4
WA AVG 6.9
Rank #15 / 92
671-
19
Facility 19
WA AVG 51
Rank #532 / 628
-
$8.9M
Facility $8.9M
WA AVG $13.2M
Rank #49 / 94
$5.6M
Facility $5.6M
WA AVG $5.7M
Rank #64 / 94
62.5%
Facility 62.5%
WA AVG 45.5%
Rank #73 / 94
505341

Financial Assistance for
Nursing Home in Washington

Discovery Nursing & Rehab of Vancouver is located in Vancouver, Washington.
Here are the financial assistance programs available to residents in Washington.

Get Financial aid guidance

Community Options Program Entry System (COPES)

WA Medicaid COPES

Age 65+ or disabled
General Washington resident, Medicaid-eligible, nursing home-level care need.
Income Limits (2025) ~$2,829/month 300% FBR, individual
Asset Limits $2,000 (individual), $3,000 (couple).
WA

High demand in urban areas (e.g., Seattle).

Benefits
Personal care (5-7 hours/day) Respite (240 hours/year) Adult day care ($70/day) Home modifications ($1,500 avg.)

Washington Family Caregiver Support Program

WA NFCSP

Age Caregiver of someone 60+ (or with dementia)
General Washington resident.
Income Limits No strict limit; prioritizes low-income.
Asset Limits Not applicable.
WA

High urban demand; rural outreach.

Benefits
In-home respite (4-6 hours/day) Adult day care (~$70/day) Short-term facility care (up to 5 days)

Community First Choice (CFC)

Washington Community First Choice

Age 65+ (or disabled 18+)
General WA resident, Medicaid-eligible, need help with 2+ ADLs/IADLs.
Income Limits (2025) ~$2,829/month; QIT optional.
Asset Limits $2,000 (individual), $3,000 (couple).
WA

Broader than COPES; serves ~20,000; self-directed option.

Benefits
Personal care (4-6 hours/day) Respite (~240 hours/year) Assistive devices Training Transportation

Older Americans Act (OAA) Services

Washington OAA Services

Age 60+
General WA resident; no income/asset limits.
Income Limits (2025) None; donations encouraged.
Asset Limits Not assessed.
WA

13 AAAs; includes Meals on Wheels; rural focus.

Benefits
Meals (~$5-$7/meal) Transportation Homemaker services (~4 hours/week) Respite (~5 days/year) Legal aid

Medicare Savings Program (MSP)

Washington Medicare Savings Program

Age 65+ or disabled
General WA resident, Medicare Part A/B.
Income Limits (2025) ~$2,510/month (QMB), ~$3,380/month (SLMB), ~$3,598/month (QI)—individual.
Asset Limits $9,430 (individual), $14,130 (couple).
WA

Includes Extra Help for Part D; no waitlist.

Benefits
Covers Part B premiums ($174.70/month) Deductibles ($240/year) Copays (~20%)

VA Aid and Attendance (A&A) and Housebound Benefits

Washington VA Aid and Attendance/Housebound

Age 65+ or disabled veteran/spouse
General WA resident, wartime service, ADL help (A&A) or homebound.
Income Limits (2025) Net income < ~$1,984/month (veteran with dependent, A&A); pension offsets income.
Asset Limits ~$155,356 net worth
WA

High veteran use; supports rural/urban needs.

Benefits
Cash (~$1,433-$2,642/month veteran, ~$951-$1,318 spouse) for care costs

Senior Citizens Property Tax Exemption

Washington Senior Property Tax Exemption

Age 61+ or disabled retiree
General WA resident, homeowner, income-based.
Income Limits (2025) ~$45,000-$70,000/year varies by county, e.g., King: $70,000
Asset Limits Not assessed; home value cap varies ~$250,000-$400,000
WA

Saves ~$500-$1,500/year; offered statewide.

Benefits
Tax exemption (~$500-$1,500/year depending on county)

Senior Farmers’ Market Nutrition Program (SFMNP)

Washington SFMNP

Age 60+
General WA resident, low-income.
Income Limits (2025) ~$2,322/month 185% FPL
Asset Limits Not assessed.
WA

Vouchers (~$80/season); serves ~20,000 via AAAs.

Benefits
Vouchers (~$80/season) for produce at farmers’ markets

Frequently Asked Questions about Discovery Nursing & Rehab of Vancouver

What neighborhood is Discovery Nursing & Rehab of Vancouver in?

Discovery Nursing & Rehab of Vancouver is in the Hazel Dell South neighborhood.

Is Discovery Nursing & Rehab of Vancouver in a walkable area?

Discovery Nursing & Rehab of Vancouver has a walk score of 19. Car-dependent. Most errands require a car, with limited nearby walkable options.

What is the occupancy rate at Discovery Nursing & Rehab of Vancouver?

Discovery Nursing & Rehab of Vancouver's occupancy is 60.2%.

Are there photos of Discovery Nursing & Rehab of Vancouver?

Yes — there are 6 photos of Discovery Nursing & Rehab of Vancouver in the photo gallery on this page.

What is the address of Discovery Nursing & Rehab of Vancouver?

Discovery Nursing & Rehab of Vancouver is located at 5220 Ne Hazel Dell Ave, Vancouver, WA 98663.

What is the phone number of Discovery Nursing & Rehab of Vancouver?

(360) 693-1474 will put you in contact with the team at Discovery Nursing & Rehab of Vancouver.

Is Discovery Nursing & Rehab of Vancouver Medicare or Medicaid certified?

Yes — Discovery Nursing & Rehab of Vancouver is a CMS-certified provider of Medicare and Medicaid.

Guides for Better Senior Living

Care Cost Calculator: See Prices in Your Area

Nursing Home Data Explorer

Don’t Wait Too Long: 7 Red Flag Signs Your Parent Needs Assisted Living Now

The True Cost of Assisted Living in 2025 – And How Families Are Paying For It

Understanding Senior Living Costs: Pricing Models, Discounts & Financial Assistance