Total health inspections
7
Ohio average 6.7
Last Health inspection on Jun 2025

We arrange tours, appointments, and even moving support so you don’t have to
Thank you for your interest!
Our team will be in touch shortly to help with next steps.
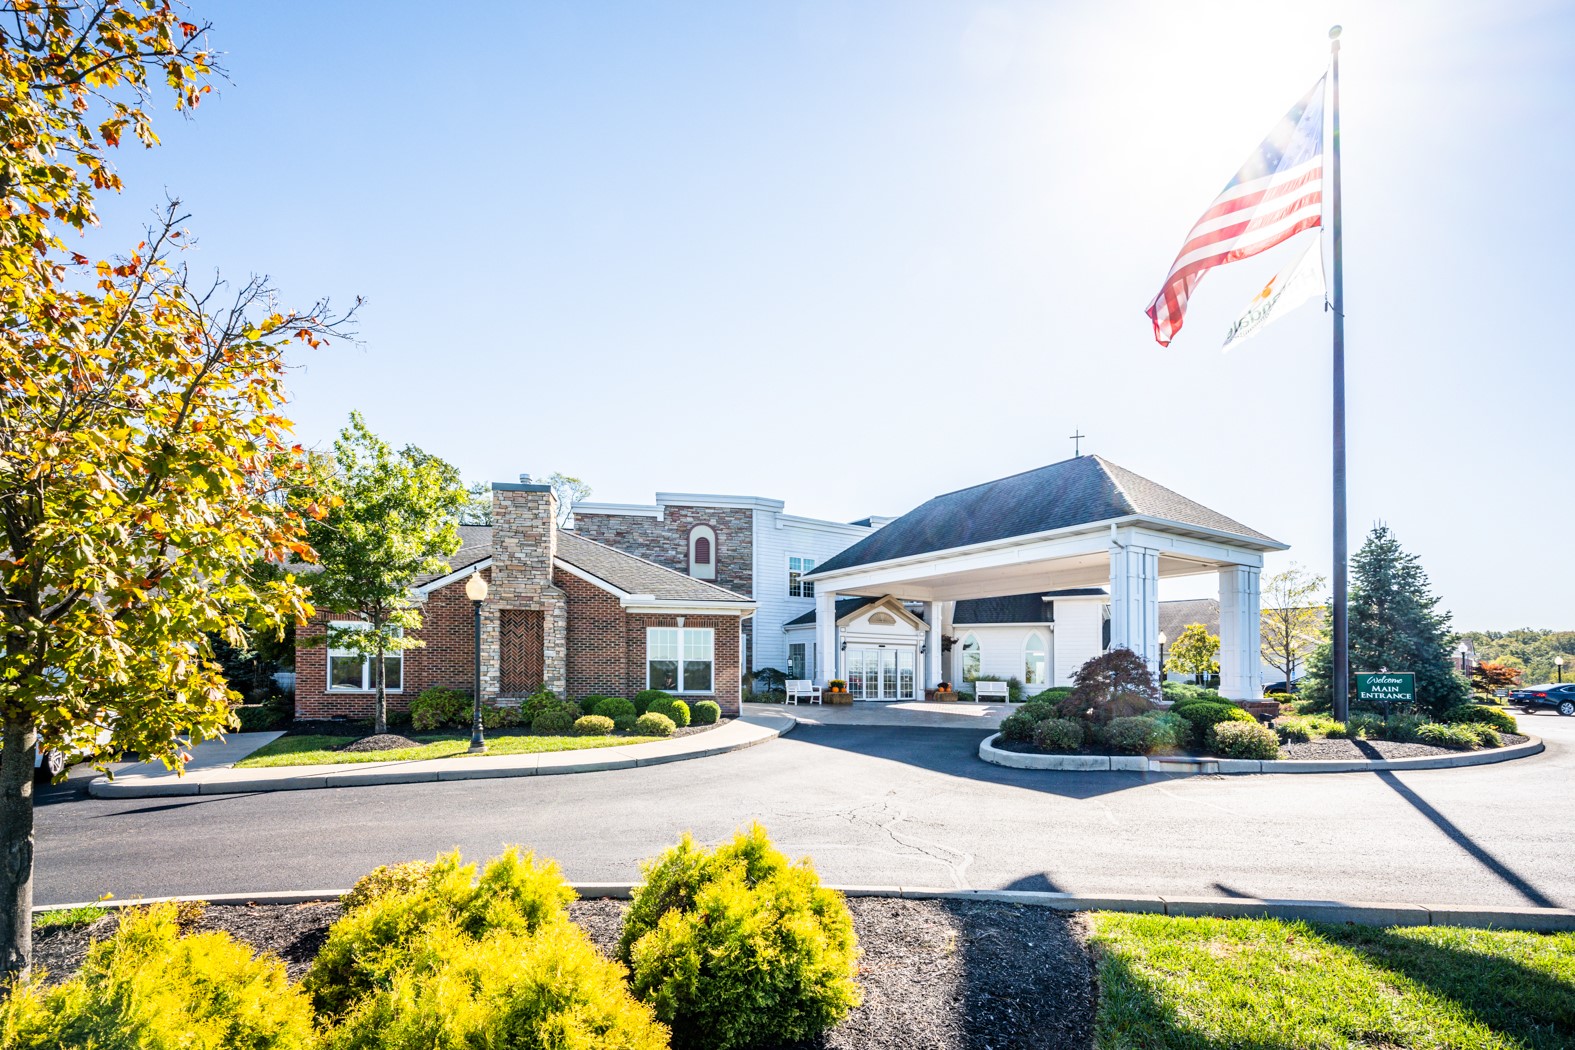
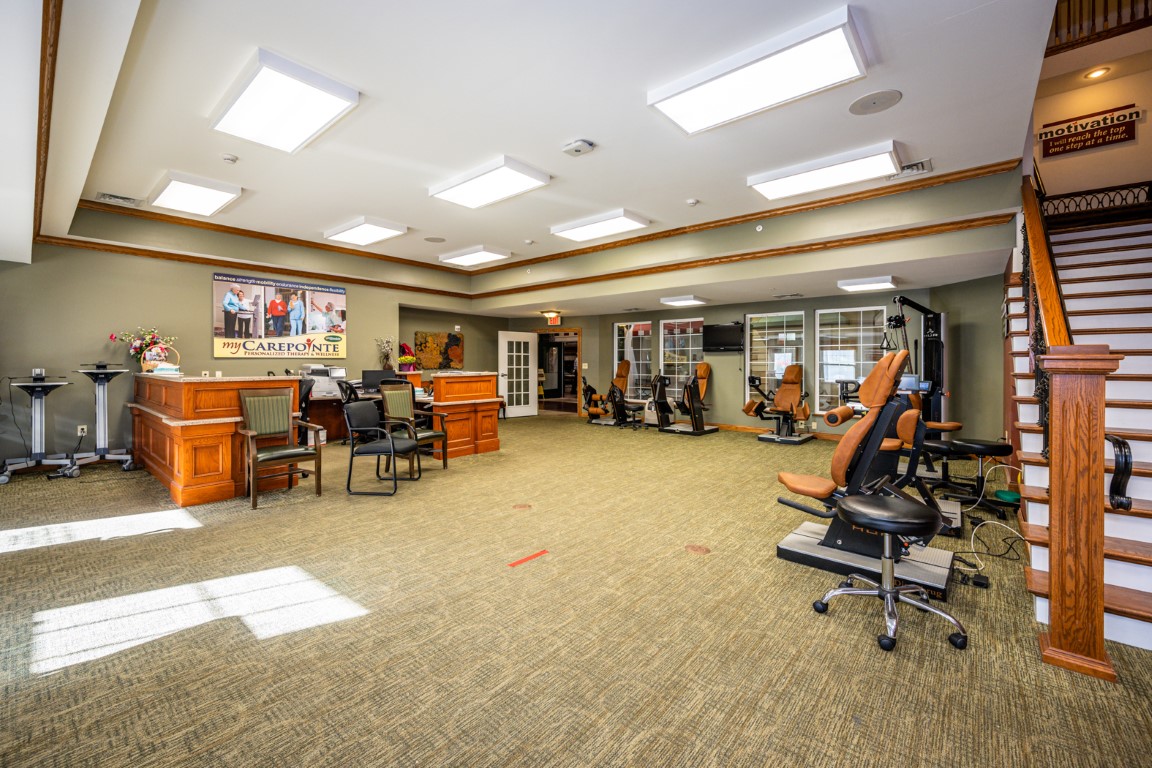
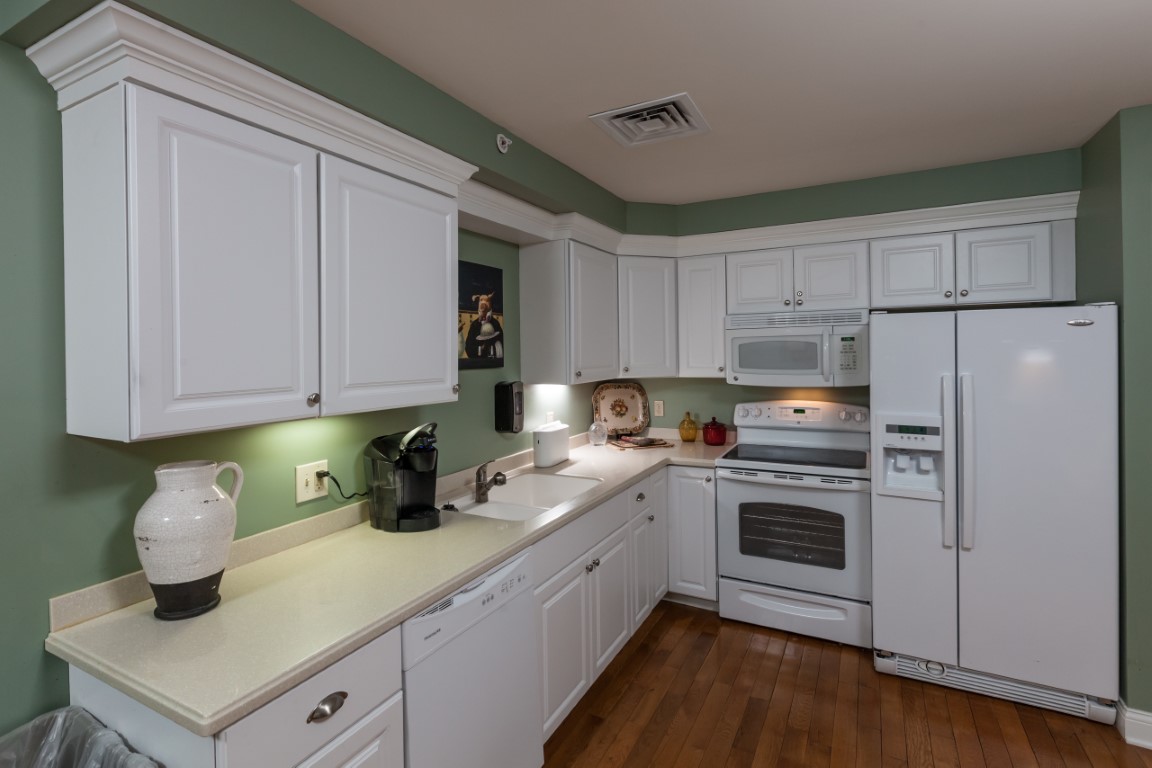
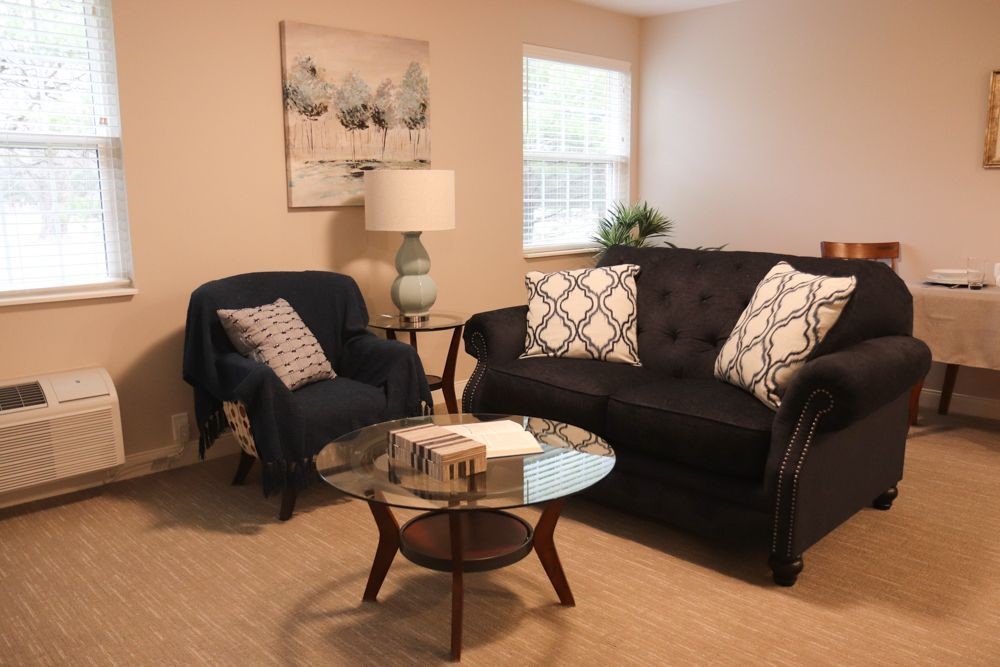
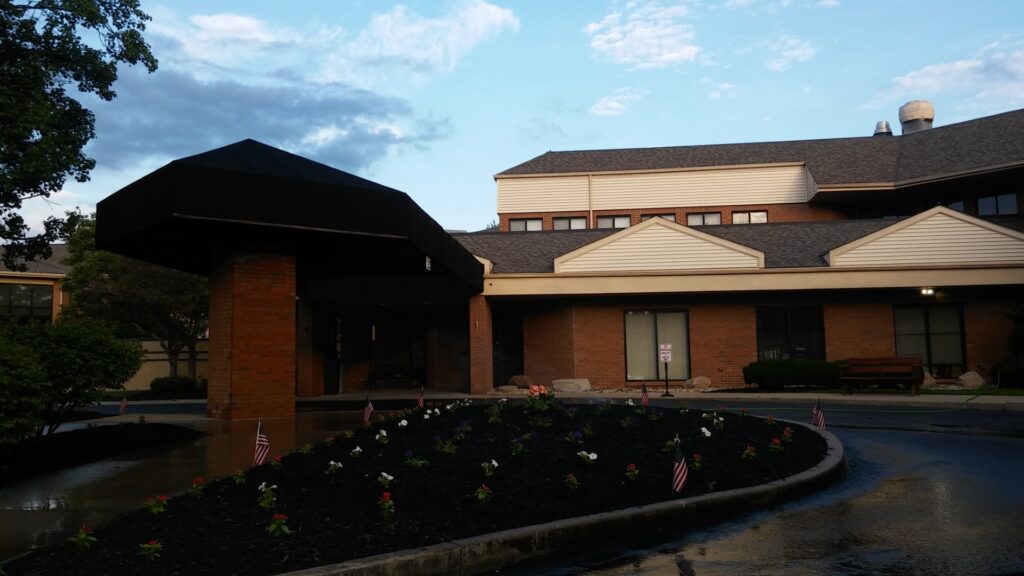
Doverwood Skilled Nursing Facility is a reliable community in Hamilton, OH, designed to provide short-term rehabilitation and skilled long-term nursing care. Their team of professionals, including doctors, nurses, and therapists work collaboratively to create tailored care and treatment plans that best suit residents’ needs. Residents looking to recover from an illness, injury, or hospitalization are cared for by their excellent rehabilitation team trained to handle complex health conditions.
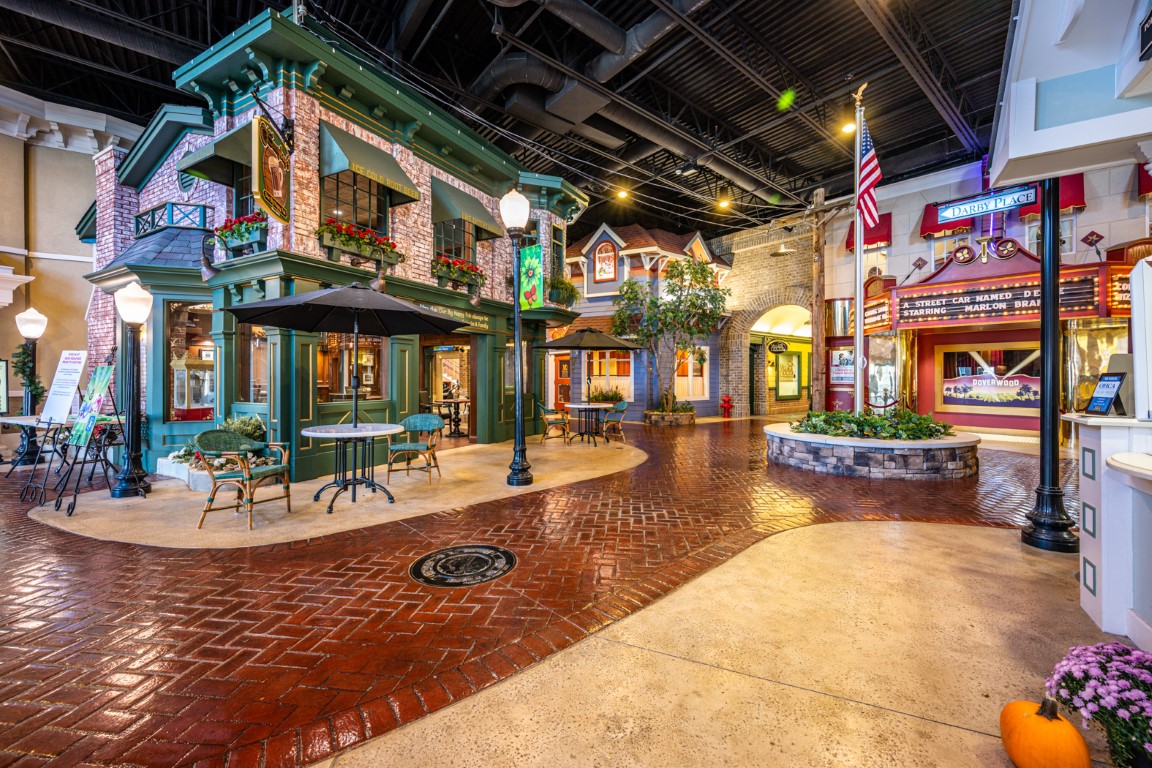
Their location also offers convenient access to several healthcare providers, making emergency care and other medical services easily accessible. Residents can enjoy a fine dining experience in their restaurant, watch interesting movies in the cinema, or enjoy their favorite game with friends in the cozy game room. At Doverwood Skilled Nursing Facility, residents enjoy a relaxing recovery journey while making enriching memories.
May offer a more intimate, personalized care environment.
Lower occupancy suggests more openings may be available.
Residents typically stay for brief periods, with frequent admissions and discharges throughout the year.
27% of new residents, usually for short-term rehab.
62% of new residents, often for short stays.
11% of new residents, often for long-term daily care.
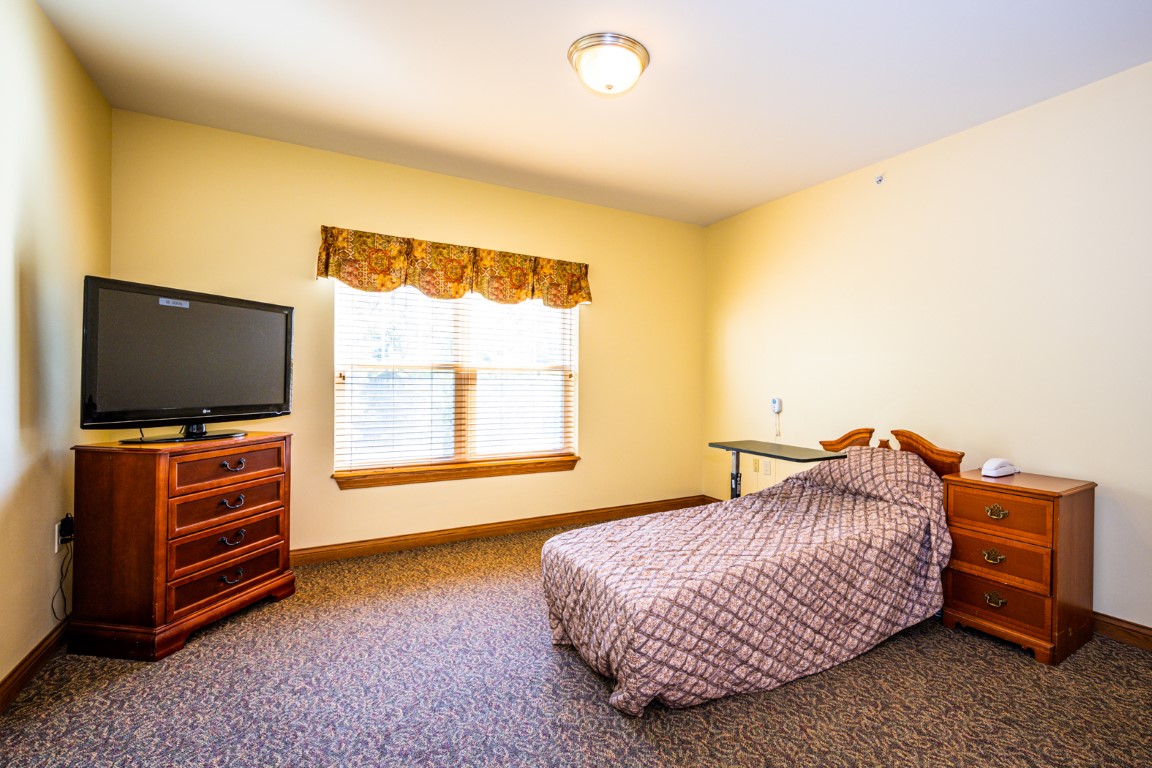
Housing Options: Studio
Building Type: Single-story
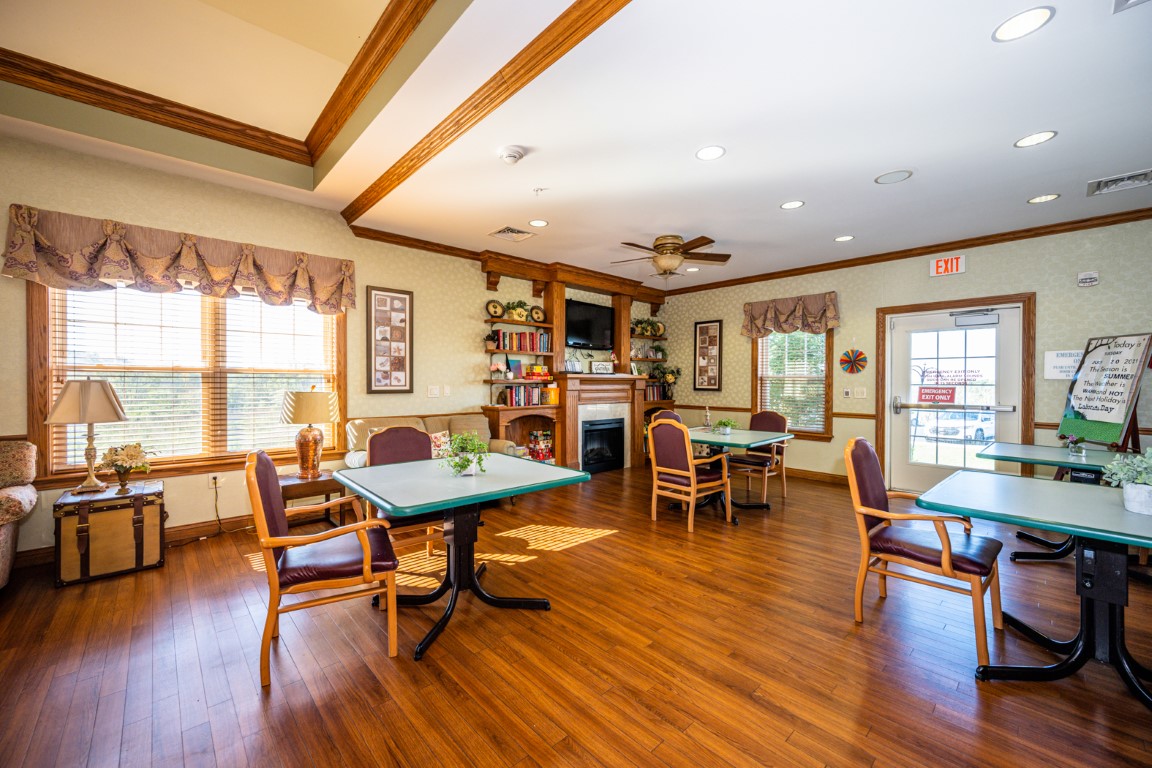
Dining Services
Beauty Services
Transportation Services
Housekeeping Services
Recreational Activities
Exercise Programs
Ohio average 6.7
Last Health inspection on Jun 2025
Ohio average 30.9
Ohio average 4.59
Health citations are formal notices following inspections when they fail to comply with safety and care standards.
16 of 22 citations resulted from standard inspections; and 6 of 22 resulted from complaint investigations.
Ohio average: 0.3
Ohio average: 0.9
Data sourced from CMS Health Deficiencies reports. Citation severity codes range from A (least serious) to L (most serious). Immediate Jeopardy (J-L) citations indicate situations where the facility's noncompliance has placed residents at risk of death or serious harm.
Nursing Home Licensed facility providing 24/7 skilled nursing care for residents with complex, ongoing medical needs. Staffed by RNs, LPNs, and CNAs. Inspected and star-rated annually by CMS. Accepts Medicare (short-term rehab) and Medicaid (long-term care).
Assisted Living A licensed, long-term care setting for seniors or individuals with disabilities who need help with daily activities — like bathing, dressing, and medication management — but not 24-hour skilled nursing. Offers housing, meals, and around-the-clock support while aiming to maximize resident independence.
Memory Care Secured, specialized care for people living with Alzheimer's or dementia. Staff trained in cognitive impairment, with higher staff-to-resident ratios and an environment designed to reduce confusion and wandering risk.
Nursing Home Licensed facility providing 24/7 skilled nursing care for residents with complex, ongoing medical needs. Staffed by RNs, LPNs, and CNAs. Inspected and star-rated annually by CMS. Accepts Medicare (short-term rehab) and Medicaid (long-term care).
Assisted Living A licensed, long-term care setting for seniors or individuals with disabilities who need help with daily activities — like bathing, dressing, and medication management — but not 24-hour skilled nursing. Offers housing, meals, and around-the-clock support while aiming to maximize resident independence.
Independent Living Lifestyle-focused communities for older adults offering dining, activities, and transportation with minimal personal care. Best for active, independent seniors who want community without medical support.
Memory Care Secured, specialized care for people living with Alzheimer's or dementia. Staff trained in cognitive impairment, with higher staff-to-resident ratios and an environment designed to reduce confusion and wandering risk.
Nursing Home Licensed facility providing 24/7 skilled nursing care for residents with complex, ongoing medical needs. Staffed by RNs, LPNs, and CNAs. Inspected and star-rated annually by CMS. Accepts Medicare (short-term rehab) and Medicaid (long-term care).
Memory Care Secured, specialized care for people living with Alzheimer's or dementia. Staff trained in cognitive impairment, with higher staff-to-resident ratios and an environment designed to reduce confusion and wandering risk.
Assisted Living A licensed, long-term care setting for seniors or individuals with disabilities who need help with daily activities — like bathing, dressing, and medication management — but not 24-hour skilled nursing. Offers housing, meals, and around-the-clock support while aiming to maximize resident independence.
Memory Care Secured, specialized care for people living with Alzheimer's or dementia. Staff trained in cognitive impairment, with higher staff-to-resident ratios and an environment designed to reduce confusion and wandering risk.
![]() 5.4 miles from city center
5.4 miles from city center
![]() 4195 Hamilton Mason Rd, Hamilton, OH 45011
4195 Hamilton Mason Rd, Hamilton, OH 45011
Add your location
This data corresponds to Q2 2025 and is based on CMS Payroll-Based Journal.
Ohio average ratio: 2.14:1
Ohio average: 8.1 hours
Manages medical care and health needs.
No contractors work on this role.
Assists with medical care and medications.
No contractors work on this role.
Helps with daily care and mobility.
No contractors work on this role.
Total hours from contractors
3,496 contractor hours this quarter
| Certified Nursing Assistant | 63 | 0 | 63 | 17,423 | 91 | 100% | 8.5 |
| Licensed Practical Nurse | 21 | 0 | 21 | 7,331 | 91 | 100% | 9.1 |
| Registered Nurse | 8 | 0 | 8 | 2,077 | 79 | 87% | 10.9 |
| Clinical Nurse Specialist | 14 | 0 | 14 | 2,003 | 91 | 100% | 6.6 |
| RN Director of Nursing | 6 | 0 | 6 | 1,704 | 87 | 96% | 6.8 |
| Medication Aide/Technician | 9 | 0 | 9 | 1,572 | 88 | 97% | 9 |
| Physical Therapy Aide | 0 | 8 | 8 | 950 | 69 | 76% | 7 |
| Speech Language Pathologist | 0 | 4 | 4 | 842 | 81 | 89% | 6.5 |
| Respiratory Therapy Technician | 0 | 8 | 8 | 785 | 73 | 80% | 6.8 |
| Other Dietary Services Staff | 4 | 0 | 4 | 609 | 59 | 65% | 6.7 |
| Nurse Practitioner | 2 | 0 | 2 | 568 | 74 | 81% | 7.7 |
| Physical Therapy Assistant | 0 | 7 | 7 | 509 | 72 | 79% | 7 |
| Dietitian | 1 | 0 | 1 | 488 | 65 | 71% | 7.5 |
| Mental Health Service Worker | 1 | 0 | 1 | 428 | 57 | 63% | 7.5 |
| Dental Services Staff | 1 | 0 | 1 | 406 | 60 | 66% | 6.8 |
| Nurse Aide in Training | 4 | 0 | 4 | 374 | 37 | 41% | 9.8 |
| Occupational Therapy Aide | 3 | 0 | 3 | 331 | 63 | 69% | 5.2 |
| Qualified Social Worker | 0 | 4 | 4 | 311 | 61 | 67% | 5.1 |
| Administrator | 2 | 0 | 2 | 213 | 64 | 70% | 3.3 |
| Feeding Assistant | 1 | 0 | 1 | 204 | 54 | 59% | 3.8 |
| Qualified Activities Professional | 0 | 1 | 1 | 51 | 15 | 16% | 3.4 |
| Occupational Therapy Assistant | 0 | 1 | 1 | 30 | 8 | 9% | 3.8 |
| Medical Director | 0 | 1 | 1 | 18 | 3 | 3% | 6 |
Source: CMS Long-Term Care Facility Characteristics (Data as of Jan 2026)
Residents meet regularly to discuss policies, care quality, and activities
Organized group of residents that meets regularly to discuss facility policies, quality of life, and activities.
Data sourced from CMS Long-Term Care Facility Characteristics quarterly report. Payer mix reflects the current resident census by primary payment source.
These measures show how residents usually do over time at this home, based on health outcomes and preventive care.
Ohio average: 5.8
Ohio average: 12.7
Ohio average: 6.8%
Ohio average: 8.9%
Ohio average: 22.0%
Ohio average: 3.4%
Ohio average: 3.9%
Ohio average: 0.5%
Ohio average: 6.2%
Ohio average: 24.0%
Ohio average: 8.4%
Ohio average: 92.4%
Ohio average: 94.5%
Ohio average: 78.0%
Ohio average: 1.3%
Ohio average: 75.6%
Ohio average: 25.1%
Ohio average: 12.5%
Ohio average: 0.8%
Ohio average: 53.7%
Ohio average: 50.6%
Quality measures are calculated from Minimum Data Set (MDS) assessments. For most measures, lower percentages indicate better care quality.
Historical financial and operational data for Doverwood Skilled Nursing Facility based on CMS SNF Cost Reports.
Loading trend charts...
Care Cost Calculator: See Prices in Your Area
Nursing Home Data Explorer
Don’t Wait Too Long: 7 Red Flag Signs Your Parent Needs Assisted Living Now
The True Cost of Assisted Living in 2025 – And How Families Are Paying For It
Understanding Senior Living Costs: Pricing Models, Discounts & Financial Assistance

Touring a community? Use this expert-backed checklist to stay organized, ask the right questions, and find the perfect fit.
We'll send you a PDF version of the touring checklist.