Doverwood Skilled Nursing Facility
Nursing Home, Assisted Living, Independent Living & Memory Care · Hamilton, OH
CMS overall rating Info CMS (the Centers for Medicare & Medicaid Services) is the federal agency that rates nursing home quality. Its Overall Rating runs from 1 to 5 stars, combining health inspections, staffing, and quality measures, with inspections weighted most heavily.

Doverwood Skilled Nursing Facility

Nursing Home, Assisted Living, Independent Living & Memory Care · Hamilton, OH
CMS overall rating Info CMS (the Centers for Medicare & Medicaid Services) is the federal agency that rates nursing home quality. Its Overall Rating runs from 1 to 5 stars, combining health inspections, staffing, and quality measures, with inspections weighted most heavily.
Calculator: See prices in your area
Doverwood Skilled Nursing Facility accepts Medicare, Medicaid, and private pay.

Overview of Doverwood Skilled Nursing Facility

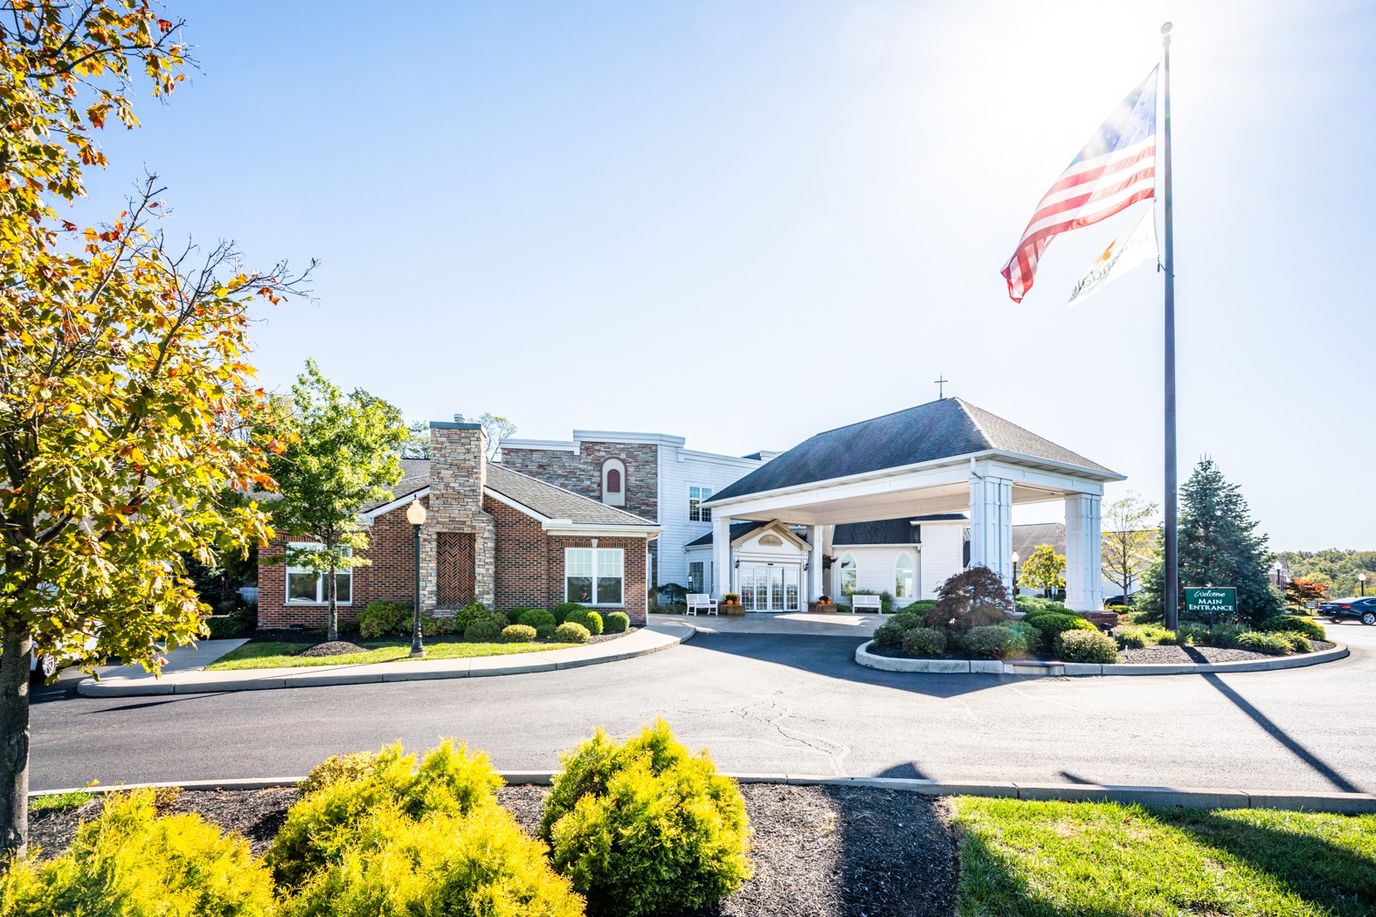
Doverwood Skilled Nursing Facility is a reliable community in Hamilton, OH, designed to provide short-term rehabilitation and skilled long-term nursing care. Their team of professionals, including doctors, nurses, and therapists work collaboratively to create tailored care and treatment plans that best suit residents’ needs. Residents looking to recover from an illness, injury, or hospitalization are cared for by their excellent rehabilitation team trained to handle complex health conditions.

Their location also offers convenient access to several healthcare providers, making emergency care and other medical services easily accessible. Residents can enjoy a fine dining experience in their restaurant, watch interesting movies in the cinema, or enjoy their favorite game with friends in the cozy game room. At Doverwood Skilled Nursing Facility, residents enjoy a relaxing recovery journey while making enriching memories.

Quality ratings

Measured by Centers for Medicare & Medicaid Services (CMS)

Overall rating Info The Overall CMS Rating combines results from health inspections, staffing levels and quality measures. Health inspections carry the most weight. Staffing and quality scores can increase or decrease the final rating based on performance compared to state and national standards.
▲ 57.1% Above OH avg. ▲ 57.1% Above OH avg.OH average: 3.2Click the badge to see the full State ranking.Click here to see the full State ranking.
Health Inspection Info Based on the results of the facility's three most recent standard inspections and any complaint investigations. CMS reviews the number, scope, and severity of deficiencies, with more recent findings weighted more heavily.
▲ 42.8% Above OH avg. ▲ 42.8% Above OH avg.OH average: 2.8Click the badge to see the full State ranking.Click here to see the full State ranking.
Staffing Info Measures average nursing staff hours per resident per day, including Registered Nurses (RNs) and total nursing staff. Ratings are adjusted based on the level of care residents require and are compared to state and national benchmarks.
▼ 18.1% Below OH avg. ▼ 18.1% Below OH avg.OH average: 2.4Click the badge to see the full State ranking.Click here to see the full State ranking.
Quality Measures Info Based on clinical and physical health indicators reported to CMS, such as hospital readmissions, falls, pressure ulcers, and improvements in mobility. These measures reflect how well residents' health needs are being managed.
▲ 14.7% Above OH avg. ▲ 14.7% Above OH avg.OH average: 4.4Click the badge to see the full State ranking.Click here to see the full State ranking.

Staffing hours breakdown

Info Daily nursing hours per resident by staff type, reported to CMS. Higher is generally better — compare this facility to state and national averages to see where staffing stands.

Hours per resident per day — compared to Ohio state averages

Total nursing care / resident Info This home is ranked 115th out of 210 homes in Ohio for nurse hours. Total adjusted nursing hours per resident per day, combining RN, LPN, and aide time. CMS adjusts this for case-mix so facilities can be fairly compared.
3h 23m per day
Rank #115 / 210Nurse hours — State benchmarkedThis home is ranked 115th out of 210 homes in Ohio. Shows adjusted nurse hours per resident per day benchmarked to the Ohio average, with a ranking across 210 Ohio facilities. More hours mean more direct care. The national average is about 3.5 hrs; below 3.0 is a red flag.Rankings are based only on facilities in Ohio that report data for that category. Facilities without available data are excluded from the ranking.Click the rank badge to see the full State ranking.Click here to see the full State ranking.
This facility Ohio avg (3h 32m per day)
vs Ohio avg
-5%

1 of 6 metrics below state avg

Standout metric Physical Therapist is +83% above state avg
Staff typeHours / Day / Residentvs state avg
Registered Nurse (RN) Info RNs hold the highest nursing license and can assess residents, interpret test results, and direct care plans. More RN hours per day often signals stronger clinical oversight and faster response to health changes. 38m per day ■ Avg State avg: 38m per day · National avg: 41m per day
LPN / LVN Info Licensed Practical Nurses (LPNs) or Licensed Vocational Nurses (LVNs) deliver routine hands-on care — medication administration, wound dressing, and monitoring vital signs. They work under RN supervision and make up a large share of daily bedside care. 1h 2m per day ▲ 7% State avg: 58m per day · National avg: 52m per day
Nurse Aide Info Certified Nurse Aides (CNAs) provide the most direct day-to-day assistance: bathing, dressing, feeding, and mobility. Nurse aide hours are typically the largest staffing category and directly affect residents' quality of life. 2h 46m per day ▲ 30% State avg: 2h 8m per day · National avg: 2h 21m per day
Weekend Total Nursing Info Combined nursing hours (RN + LPN + Nurse Aide) per resident per day on weekends. Staffing often drops on weekends — this figure reveals whether the facility maintains adequate coverage outside of weekday hours. 4h 5m per day ▲ 24% State avg: 3h 17m per day · National avg: 3h 26m per day
Physical Therapist Info Hours per resident per day provided by licensed Physical Therapists (PTs) or PT Assistants. PT services help residents recover mobility after injury or illness and are especially important for post-acute (short-stay) rehabilitation. 5m per day ▲ 83% State avg: 3m per day · National avg: 4m per day
Weekend RN Info Registered nurse hours specifically on weekends. Facilities sometimes reduce RN presence on Saturdays and Sundays — a low weekend RN figure compared to weekday hours can indicate reduced clinical oversight when most administrative staff are absent. 23m per day ▼ 7% State avg: 25m per day · National avg: 29m per day

Capacity and availability

This home usually has availability

Lower occupancy than the Ohio average: 78.7%
Occupancy rate
73% Rank #155 / 211Occupancy rate — State benchmarkedThis home is ranked 155th out of 211 homes in Ohio. Shows this facility's occupancy rate versus the Ohio average, with its Statewide rank out of 211. Higher occupancy signals strong local demand and financial stability.Rankings are based only on facilities in Ohio that report data for that category. Facilities without available data are excluded from the ranking.Click the rank badge to see the full State ranking.Click here to see the full State ranking.
Avg. Length of Stay
41 days
Bed community size
99-bed community Rank #77 / 323Bed count — State benchmarkedThis home is ranked 77th out of 323 homes in Ohio. Shows this facility's certified or reported bed count compared to other Ohio facilities. Larger communities may offer more amenities, programs, and on-site services for residents and families.Rankings are based only on facilities in Ohio that report data for that category. Facilities without available data are excluded from the ranking.Click the rank badge to see the full State ranking.Click here to see the full State ranking.
A larger shared setting that may offer more common spaces and organized community services.
Walk Score
Walk Score: 7 / 100 Rank #637 / 705Walk Score — State benchmarkedThis home is ranked 637th out of 705 homes in Ohio. Shows how walkable this facility's neighborhood is compared to the average Walk Score across Ohio facilities. Higher scores benefit residents, families, and staff.Rankings are based only on facilities in Ohio that report data for that category. Facilities without available data are excluded from the ranking.Click the rank badge to see the full State ranking.Click here to see the full State ranking.
Car-dependent. Most errands require a car, with limited nearby walkable options.

Contact Doverwood Skilled Nursing Facility

Staffing Data

Reporting period: October 1 – December 31, 2025 (Q4 2025). Source: CMS Payroll-Based Journal report.

Total staff 216
Employees 165
Contractors 51
Staff to resident ratio 2.60 : 1
28% more staff per resident than Ohio average
Ohio average ratio: 2.04 : 1 Ohio average ratio: 2.04 : 1See full Ohio ranking
Avg staff/day 61
Average shift 7.9 hours
0% compared with Ohio average
Ohio average: 8.1 hours Ohio average shift: 8.1 hoursSee full Ohio ranking
Total staff hours (quarter) 44,139

Nursing staff breakdown

Q4 2025 · Oct 1 – Dec 31 More info This data comes from the CMS Payroll-Based Journal report covering October 1 – December 31, 2025.
Registered Nurse

Manages medical care and health needs.

RN Staff Info All 10 RN Staff are full-time employees. No contractors work on this role. 10
Average shift length Info Average shift length. Calculated as total hours divided by days worked and average staff per day. 9 hours
Licensed Practical Nurse

Assists with medical care and medications.

LPN Staff Info All 31 LPN Staff are full-time employees. No contractors work on this role. 31
Average shift length Info Average shift length. Calculated as total hours divided by days worked and average staff per day. 8.9 hours
Certified Nursing Assistant

Helps with daily care and mobility.

CNA Staff Info All 75 CNA Staff are full-time employees. No contractors work on this role. 75
Average shift length Info Average shift length. Calculated as total hours divided by days worked and average staff per day. 8.4 hours

Contractor staffing

Q4 2025 · Oct 1 – Dec 31 More info This data comes from the CMS Payroll-Based Journal report covering October 1 – December 31, 2025.

Total hours from contractors

8.7%

3,852 contractor hours this quarter

Respiratory Therapy Technician: 14 Speech Language Pathologist: 14 Physical Therapy Aide: 11 Physical Therapy Assistant: 7 Qualified Social Worker: 2 Occupational Therapy Assistant: 1 Qualified Activities Professional: 1 Medical Director: 1

Staff by category

Q4 2025 · Oct 1 – Dec 31 More info This data comes from the CMS Payroll-Based Journal report covering October 1 – December 31, 2025.
Certified Nursing Assistant7507520,15892100%8.4
Licensed Practical Nurse310317,97492100%8.9
Registered Nurse100102,3349199%9
Medication Aide/Technician9092,32892100%8.9
Clinical Nurse Specialist140142,31392100%6.5
Other Dietary Services Staff7071,4989098%6.8
Physical Therapy Aide011111,0487784%6.9
Speech Language Pathologist014141,0308795%6.4
Respiratory Therapy Technician014147637683%6.8
RN Director of Nursing5056386874%5
Nurse Aide in Training5056154043%10.1
Nurse Practitioner1015907986%7.5
Physical Therapy Assistant0775147683%6.3
Dietitian1014656267%7.5
Mental Health Service Worker1014355863%7.5
Qualified Social Worker0223516470%5.4
Occupational Therapy Aide2023246267%5.1
Administrator1012516470%3.9
Feeding Assistant1012155863%3.7
Dental Services Staff2021502022%7.5
Qualified Activities Professional011831516%5.5
Occupational Therapy Assistant011351516%2.3
Medical Director0112944%7.1
75 Certified Nursing Assistant
% of Days 100%
31 Licensed Practical Nurse
% of Days 100%
10 Registered Nurse
% of Days 99%
9 Medication Aide/Technician
% of Days 100%
14 Clinical Nurse Specialist
% of Days 100%
7 Other Dietary Services Staff
% of Days 98%
11 Physical Therapy Aide
% of Days 84%
14 Speech Language Pathologist
% of Days 95%
14 Respiratory Therapy Technician
% of Days 83%
5 RN Director of Nursing
% of Days 74%
5 Nurse Aide in Training
% of Days 43%
1 Nurse Practitioner
% of Days 86%
7 Physical Therapy Assistant
% of Days 83%
1 Dietitian
% of Days 67%
1 Mental Health Service Worker
% of Days 63%
2 Qualified Social Worker
% of Days 70%
2 Occupational Therapy Aide
% of Days 67%
1 Administrator
% of Days 70%
1 Feeding Assistant
% of Days 63%
2 Dental Services Staff
% of Days 22%
1 Qualified Activities Professional
% of Days 16%
1 Occupational Therapy Assistant
% of Days 16%
1 Medical Director
% of Days 4%

Penalties and fines

Federal penalties imposed by CMS for regulatory violations, including civil money penalties (fines) and denials of payment for new Medicare/Medicaid admissions.

Source: CMS Penalties Database

No penalties in the past 3 years

No civil money penalties or payment denials were reported in the last 3 years.

Quality of care over time

These measures show how residents usually do over time at this home, based on health outcomes and preventive care.

High-risk clinical events score Info A composite score based on pressure ulcers, falls with injury, weight loss, walking ability decline, and activities of daily living decline. 4.1
29% better than Ohio average

Ohio average: 5.8

Functional decline score Info A composite score based on activities of daily living decline, walking ability decline, and incontinence. 8.7
32% better than Ohio average

Ohio average: 12.7

Long-stay resident measures
Significantly above average Ohio avg: 4.7 Info CMS star rating based on long-stay quality measure performance. 5 stars = significantly above average, 1 star = significantly below average.
Need for Help with Daily Activities Increased Info Percent of long-stay residents whose need for help with daily activities has increased 1.0%
85% better than Ohio average

Ohio average: 6.8%

Walking Ability Worsened Info Percent of long-stay residents whose ability to move independently worsened 1.5%
83% better than Ohio average

Ohio average: 8.9%

Low Risk Residents with Bowel/Bladder Incontinence Info Percent of low risk long-stay residents who lose control of their bowels or bladder 23.5%
7% worse than Ohio average

Ohio average: 22.0%

Falls with Major Injury Info Percent of long-stay residents experiencing one or more falls with major injury 6.0%
75% worse than Ohio average

Ohio average: 3.4%

High Risk Residents with Pressure Ulcers Info Percent of long-stay high risk residents with pressure ulcers 5.5%
42% worse than Ohio average

Ohio average: 3.9%

Urinary Tract Infection Info Percent of long-stay residents with a urinary tract infection 0.0%
100% better than Ohio average

Ohio average: 0.5%

Lost Too Much Weight Info Percent of long-stay residents who lose too much weight 6.7%
8% worse than Ohio average

Ohio average: 6.2%

Depressive Symptoms Info Percent of long-stay residents who have depressive symptoms 38.7%
61% worse than Ohio average

Ohio average: 24.0%

Antipsychotic Use Info Percent of long-stay residents who received an antipsychotic medication 7.5%
12% better than Ohio average

Ohio average: 8.4%

Pneumococcal Vaccine Info Percent of long-stay residents assessed and appropriately given the pneumococcal vaccine 100.0%
8% better than Ohio average

Ohio average: 92.4%

Influenza Vaccine Info Percent of long-stay residents assessed and appropriately given the seasonal influenza vaccine 100.0%
6% better than Ohio average

Ohio average: 94.5%

Short-stay resident measures
Significantly above average Ohio avg: 2.4 Info CMS star rating based on short-stay quality measure performance. 5 stars = much above average, 1 star = much below average.
Pneumococcal Vaccine Info Percent of short-stay residents assessed and appropriately given the pneumococcal vaccine 100.0%
28% better than Ohio average

Ohio average: 78.0%

Antipsychotic medication increase Info Percent of short-stay residents who newly received an antipsychotic medication 1.5%
14% worse than Ohio average

Ohio average: 1.3%

Influenza Vaccine Info Percent of short-stay residents assessed and appropriately given the seasonal influenza vaccine 98.1%
30% better than Ohio average

Ohio average: 75.6%

Re-hospitalized after SNF stay Info Percentage of short-stay residents who were re-hospitalized after their nursing home admission. 21.4%
15% better than Ohio average

Ohio average: 25.1%

Emergency department visits Info Percentage of short-stay residents who had an outpatient emergency department visit. 10.2%
18% better than Ohio average

Ohio average: 12.5%

Falls with major injury Info Percentage of SNF residents who experience falls with major injury during their stay. 0.7%
8% better than Ohio average

Ohio average: 0.8%

Ability to care for self at discharge Info Percentage of residents at or above expected ability to care for themselves at discharge. 63.4%
18% better than Ohio average

Ohio average: 53.7%

Successful return to home or community Info Rate of successful return to home or community from a skilled nursing facility. 59.4%
17% better than Ohio average

Ohio average: 50.6%

Breakdown by payment type

Medicare

27% of new residents, usually for short-term rehab.

Typical stay 23 days

Private pay

62% of new residents, often for short stays.

Typical stay 1 - 2 months

Medicaid

11% of new residents, often for long-term daily care.

Typical stay 1 - 2 months

Facility Characteristics

Source: CMS Long-Term Care Facility Characteristics (Data as of Jan 2026)

Total residents 83
Medicare
26
31.3% of residents
Medicaid
45
54.2% of residents
Private pay or other
12
14.5% of residents
Programs & Services
Residents Group

Residents meet regularly to discuss policies, care quality, and activities

Active Resident Council

Organized group of residents that meets regularly to discuss facility policies, quality of life, and activities.

Finances and operations

Based on CMS SNF Cost Report for fiscal year ending in 12/2023.

For-profit
Corporation
Net patient revenue Info Net patient revenue — what the home actually collects for resident care, after contractual allowances, bad debt and discounts are subtracted from its gross charges (CMS cost report, Worksheet G-3). It covers resident care only; money the home earns from other sources is shown separately as "Other income."
$10.1M
Net patient income Info Net patient income: net patient revenue minus the home's total operating expenses. A positive figure means it earns more from resident care than it spends to deliver it; a negative figure means the opposite. It excludes non-operating "other income."
-$870.9K
For-profit Corporation
Net patient revenue Info Net patient revenue — what the home actually collects for resident care, after contractual allowances, bad debt and discounts are subtracted from its gross charges (CMS cost report, Worksheet G-3). It covers resident care only; money the home earns from other sources is shown separately as "Other income."
$10.1M Rank #70 / 210Revenue — State benchmarkedThis home is ranked 70th out of 210 homes in Ohio. Shows this facility's annual revenue compared to the Ohio average. Higher revenue generally means more resources for staffing and capital — read alongside Payroll %.Rankings are based only on facilities in Ohio that report data for that category. Facilities without available data are excluded from the ranking.Click the rank badge to see the full State ranking.Click here to see the full State ranking.
Net patient income Info Net patient income: net patient revenue minus the home's total operating expenses. A positive figure means it earns more from resident care than it spends to deliver it; a negative figure means the opposite. It excludes non-operating "other income."
-$870.9K
Other income Info Money the home earns outside of resident care — such as investments, grants, rentals and other non-operating sources (CMS cost report, Worksheet G-3). It is tracked separately from net patient revenue: it is not part of that figure, and it is not included in net patient income.
$370.6K
Payroll costs Info Staff salaries plus wage-related costs — benefits such as payroll taxes, health insurance and retirement — from the home's own accounting records (CMS cost report, Worksheet A). Contract or agency labor is counted separately, under other operating costs. Rank #73 / 210Payroll — State benchmarkedThis home is ranked 73rd out of 210 homes in Ohio. Shows total annual staff payroll benchmarked to the Ohio average. Higher payroll investment relative to peers often signals better staffing and less reliance on cheaper contract labor.Rankings are based only on facilities in Ohio that report data for that category. Facilities without available data are excluded from the ranking.Click the rank badge to see the full State ranking.Click here to see the full State ranking.
$5.0M 49.6% of net patient revenue Info Payroll as a share of revenue: staff salaries and wage-related benefits divided by net patient revenue. A higher figure means more of each revenue dollar goes to staff pay. Rank #158 / 210Payroll % — State benchmarkedThis home is ranked 158th out of 210 homes in Ohio. Shows payroll as a percentage of revenue versus the Ohio average. Well-run Ohio facilities typically land around 54–64% — the top third Statewide. Below 25% may signal understaffing or heavy agency use — read with Staffing ratings.Rankings are based only on facilities in Ohio that report data for that category. Facilities without available data are excluded from the ranking.Click the rank badge to see the full State ranking.Click here to see the full State ranking.
Other operating costs Info Everything it costs to run the home apart from payroll — food, utilities, supplies, maintenance, contract labor and administration. Calculated as total operating expense minus payroll (staff salaries and wage-related benefits).
$6.0M
Total costs Info The home's total operating expense for the year — all the costs of running it, salaries included (CMS cost report, Worksheet G-3).
$11.0M

What does this home offer?

Housing options icon

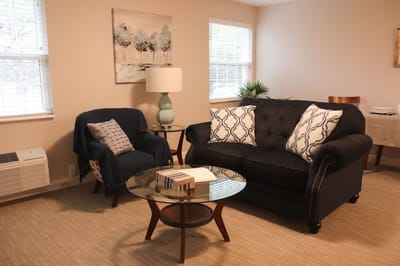
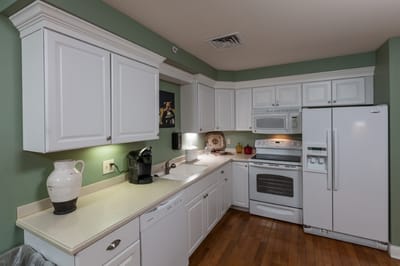
Housing Options: Studio

Building type icon
Building type icon

Building Type: Single-story

Beauty services icon

Beauty Services

Transportation services icon

Transportation Services

Housekeeping icon
Housekeeping icon

Housekeeping Services

Recreational activities icon

Recreational Activities

Exercise program icon

Exercise Programs

Who this home usually serves

TYPE OF STAY

Primarily short stays

Residents typically stay for brief periods, with frequent admissions and discharges throughout the year.

Most new residents arrive under private pay (62% of admissions), and a typical private pay stay runs around 1 - 2 months.

Admissions
648 total

Coverage residents most often arrive under.

Medicare 27%
Private pay 62%
Medicaid 11%
Discharges
649 total

Coverage residents most often leave under.

Medicare 23%
Private pay 63%
Medicaid 14%

Places of interest near Doverwood Skilled Nursing Facility

Address 5.4 miles from city center Info Estimated distance in miles from Hamilton's city center to Doverwood Skilled Nursing Facility's address, calculated via Google Maps.

Calculate Travel Distance to Doverwood Skilled Nursing Facility

Add your location

Address

Compare Nursing Homes around Hamilton County

The information below is reported by the Ohio Department of Health, Bureau of Survey and Certification.

4 facilities compared · CMS & OH Dept. of Health data

Gateway Springs Health Campus
NH
ADC
AL
IL
MC
RC
Hamilton (Shadow Creek)
53
Facility 53
OH AVG 78
Rank #221 / 323
88.7%
Facility 88.7%
OH AVG 78.7%
Rank #79 / 211
+13%
4.36
Facility 4.36
OH AVG 3.54
Rank #26 / 210
-37%+23%
$0
Facility $0
OH AVG $74.0k
Rank #1 / 211
5
Facility 5
OH AVG 30.9
Rank #11 / 210
2.5
Facility 2.5
OH AVG 4.6
Rank #27 / 210
-51-
3
Facility 3
OH AVG 40
Rank #664 / 705
-
$7.6M
Facility $7.6M
OH AVG $10.1M
Rank #152 / 210
$5.0M
Facility $5.0M
OH AVG $3.9M
Rank #100 / 210
66.3%
Facility 66.3%
OH AVG 40.2%
Rank #14 / 210
366482
Alois Alzheimer Center
NH
MC
Cincinnati (Greenhills)
93
Facility 93
OH AVG 78
Rank #100 / 323
82.8%
Facility 82.8%
OH AVG 78.7%
Rank #122 / 211
+5%
4.12
Facility 4.12
OH AVG 3.54
Rank #43 / 210
-31%+16%
$0
Facility $0
OH AVG $74.0k
Rank #1 / 211
7
Facility 7
OH AVG 30.9
Rank #16 / 210
3.5
Facility 3.5
OH AVG 4.6
Rank #67 / 210
-85-
49
Facility 49
OH AVG 40
Rank #264 / 705
Boymel Operations Holdings Co LLC
$7.5M
Facility $7.5M
OH AVG $10.1M
Rank #155 / 210
$4.6M
Facility $4.6M
OH AVG $3.9M
Rank #126 / 210
61.4%
Facility 61.4%
OH AVG 40.2%
Rank #25 / 210
366489
Doverwood Skilled Nursing Facility
NH
AL
IL
MC
Hamilton
99
Facility 99
OH AVG 78
Rank #77 / 323
73.0%
Facility 73.0%
OH AVG 78.7%
Rank #155 / 211
-7%
3.38
Facility 3.38
OH AVG 3.54
Rank #115 / 210
-50%-5%
$0
Facility $0
OH AVG $74.0k
Rank #1 / 211
22
Facility 22
OH AVG 30.9
Rank #80 / 210
3.1
Facility 3.1
OH AVG 4.6
Rank #54 / 210
-91-
7
Facility 7
OH AVG 40
Rank #637 / 705
Cs Hillandale Holdings LLC
$10.1M
Facility $10.1M
OH AVG $10.1M
Rank #70 / 210
$5.0M
Facility $5.0M
OH AVG $3.9M
Rank #73 / 210
49.6%
Facility 49.6%
OH AVG 40.2%
Rank #158 / 210
366040
Burlington House Healthcare Center
NH
AL
MC
Cincinnati
122
Facility 122
OH AVG 78
Rank #48 / 323
90.9%
Facility 90.9%
OH AVG 78.7%
Rank #62 / 211
+16%
3.73
Facility 3.73
OH AVG 3.54
Rank #72 / 210
+22%+5%
$0
Facility $0
OH AVG $74.0k
Rank #1 / 211
36
Facility 36
OH AVG 30.9
Rank #137 / 210
4.5
Facility 4.5
OH AVG 4.6
Rank #127 / 210
398-
4
Facility 4
OH AVG 40
Rank #654 / 705
Gregory Carson
$11.1M
Facility $11.1M
OH AVG $10.1M
Rank #56 / 210
$5.2M
Facility $5.2M
OH AVG $3.9M
Rank #74 / 210
47.2%
Facility 47.2%
OH AVG 40.2%
Rank #181 / 210
365892

Financial Assistance for
Nursing Home in Ohio

Doverwood Skilled Nursing Facility is located in Hamilton, Ohio.
Here are the financial assistance programs available to residents in Ohio.

Get Financial aid guidance

PASSPORT Waiver

Ohio Medicaid PASSPORT

Age 60+
General Ohio resident, Medicaid-eligible, nursing home-level care need.
Income Limits (2025) ~$2,829/month 300% FBR, individual
Asset Limits $2,000 (individual), $3,000 (couple).
OH

Administered through regional agencies; waitlists possible.

Benefits
Personal care (5-7 hours/day) Respite (240 hours/year) Adult day care ($65/day) Home modifications ($1,500 avg.)

Ohio Home Care Program (non-Medicaid)

OH HCP

Age 60+
General Ohio resident, at risk of decline.
Income Limits ~$2,000/month individual, varies
Asset Limits $5,000 individual
OH

Limited funding; regional variation.

Benefits
In-home care (3-5 hours/week) Respite (up to 10 days/year) Transportation (~5 trips/month)

Assisted Living Waiver (ALW)

Ohio Assisted Living Waiver

Age 21+ (65+ prioritized)
General OH resident, Medicaid-eligible, NFLOC.
Income Limits (2025) ~$2,829/month (individual); QIT required.
Asset Limits $2,000 (individual), $3,000 (couple).
OH

Covers ~300 facilities; room/board not included (separate cost).

Benefits
Personal care Meals Medication management Transportation (~$3,000-$4,000/month value)

Program of All-Inclusive Care for the Elderly (PACE)

Ohio PACE (e.g., McGregor PACE)

Age 55+
General OH resident (specific counties), NFLOC, safe with PACE support.
Income Limits (2025) ~$2,829/month (Medicaid-eligible); private pay option available.
Asset Limits $2,000 (individual), $3,000 (couple) for Medicaid enrollees.
OH

Available in 9 counties (e.g., Cuyahoga, Franklin); expanding via Healthy Aging Grants.

Benefits
Personal care (5-7 hours/day) Medical care Meals Transportation Respite Therapies

Medicare Savings Program (MSP)

Ohio Medicare Savings Program

Age 65+ or disabled
General OH resident, Medicare Part A/B.
Income Limits (2025) ~$2,510/month (QMB), ~$3,380/month (SLMB), ~$3,598/month (QI)—individual.
Asset Limits $9,430 (individual), $14,130 (couple).
OH

Three tiers; includes Extra Help for Part D; no waitlist.

Benefits
Covers Part B premiums ($174.70/month) Deductibles ($240/year) Copays (~20%)

Home Energy Assistance Program (HEAP)

Ohio HEAP

Age 60+ prioritized
General OH resident, low-income household.
Income Limits (2025) ~$3,970/month individual, 185% FPL
Asset Limits Not assessed; income-focused.
OH

Covers gas, electric, oil; emergency aid via Winter/Summer Crisis Programs.

Benefits
Heating/cooling aid ($300-$1,000/season) Emergency aid ($500 max)

Family Caregiver Support Program (FCSP)

Ohio Family Caregiver Support Program

Age
General Caregivers of 60+ needing care or 55+ caregivers of others; OH resident; functional needs (2+ ADLs).
Income Limits (2025) Prioritizes ~$24,980/year (individual); no strict cap.
Asset Limits Not assessed; need-based.
OH

12 AAAs; rural/low-income priority; volunteer respite option.

Benefits
Respite (4-6 hours/week or 5 days/year) Adult day care ($60/day) Training Supplies (~$500/year)

VA Aid and Attendance (A&A) and Housebound Benefits

Ohio VA Aid and Attendance/Housebound

Age 65+ or disabled veteran/spouse
General OH resident, wartime service, need for ADL help (A&A) or homebound.
Income Limits (2025) Net income < ~$1,984/month (veteran with dependent, A&A); pension offsets income.
Asset Limits ~$155,356 net worth limit
OH

High veteran demand; supports care in multiple settings.

Benefits
Cash (~$1,433-$2,642/month veteran, ~$951-$1,318 spouse) for care costs (e.g., in-home, assisted living)

Homestead Exemption

Ohio Homestead Exemption

Age 65+ (or disabled)
General OH resident, homeowner, low-income.
Income Limits (2025) ~$38,500/year individual, adjusted annually
Asset Limits Not assessed; home ownership required.
OH

Reduces taxable value by $25,000; applies to primary residence.

Benefits
Tax reduction (~$400-$800/year avg., varies by county)

Save the Dream Ohio (Homeowner Assistance Fund)

Ohio Save the Dream

Age 60+ prioritized
General OH resident, homeowner, hardship post-Jan 21, 2020.
Income Limits (2025) ~$147,600/year family of 4, 150% AMI; varies by county
Asset Limits Not assessed; hardship-focused.
OH

Covers delinquent mortgages, utilities, taxes; max $25,000 mortgage aid.

Benefits
Mortgage aid ($25,000 max) Utility/property tax aid ($5,000 avg.)

Frequently Asked Questions about Doverwood Skilled Nursing Facility

Is Doverwood Skilled Nursing Facility in a walkable area?

Doverwood Skilled Nursing Facility has a walk score of 7. Car-dependent. Most errands require a car, with limited nearby walkable options.

What is the occupancy rate at Doverwood Skilled Nursing Facility?

Doverwood Skilled Nursing Facility's occupancy is 73.0%.

Does Doverwood Skilled Nursing Facility operate as a for-profit or non-profit?

Doverwood Skilled Nursing Facility is registered as a for-profit.

Are there photos of Doverwood Skilled Nursing Facility?

Yes — there are 6 photos of Doverwood Skilled Nursing Facility in the photo gallery on this page.

What is the address of Doverwood Skilled Nursing Facility?

Doverwood Skilled Nursing Facility is located at 4195 Hamilton Mason Rd, Hamilton, OH 45011.

What is the phone number of Doverwood Skilled Nursing Facility?

(513) 868-2266 will put you in contact with the team at Doverwood Skilled Nursing Facility.

Is Doverwood Skilled Nursing Facility Medicare or Medicaid certified?

Yes — Doverwood Skilled Nursing Facility is a CMS-certified provider of Medicare and Medicaid.

Guides for Better Senior Living

Care Cost Calculator: See Prices in Your Area

Nursing Home Data Explorer

Don’t Wait Too Long: 7 Red Flag Signs Your Parent Needs Assisted Living Now

The True Cost of Assisted Living in 2025 – And How Families Are Paying For It

Understanding Senior Living Costs: Pricing Models, Discounts & Financial Assistance