Gateway Springs Health Campus

Memory Care in Hamilton County

CMS overall rating Info The Overall CMS Rating is scored from 1 to 5 stars and combines results from health inspections, staffing levels, and quality measures. Health inspections carry the most weight. Staffing and quality scores can increase or decrease the final rating based on performance compared to state and national standards.

Overview of Gateway Springs Health Campus

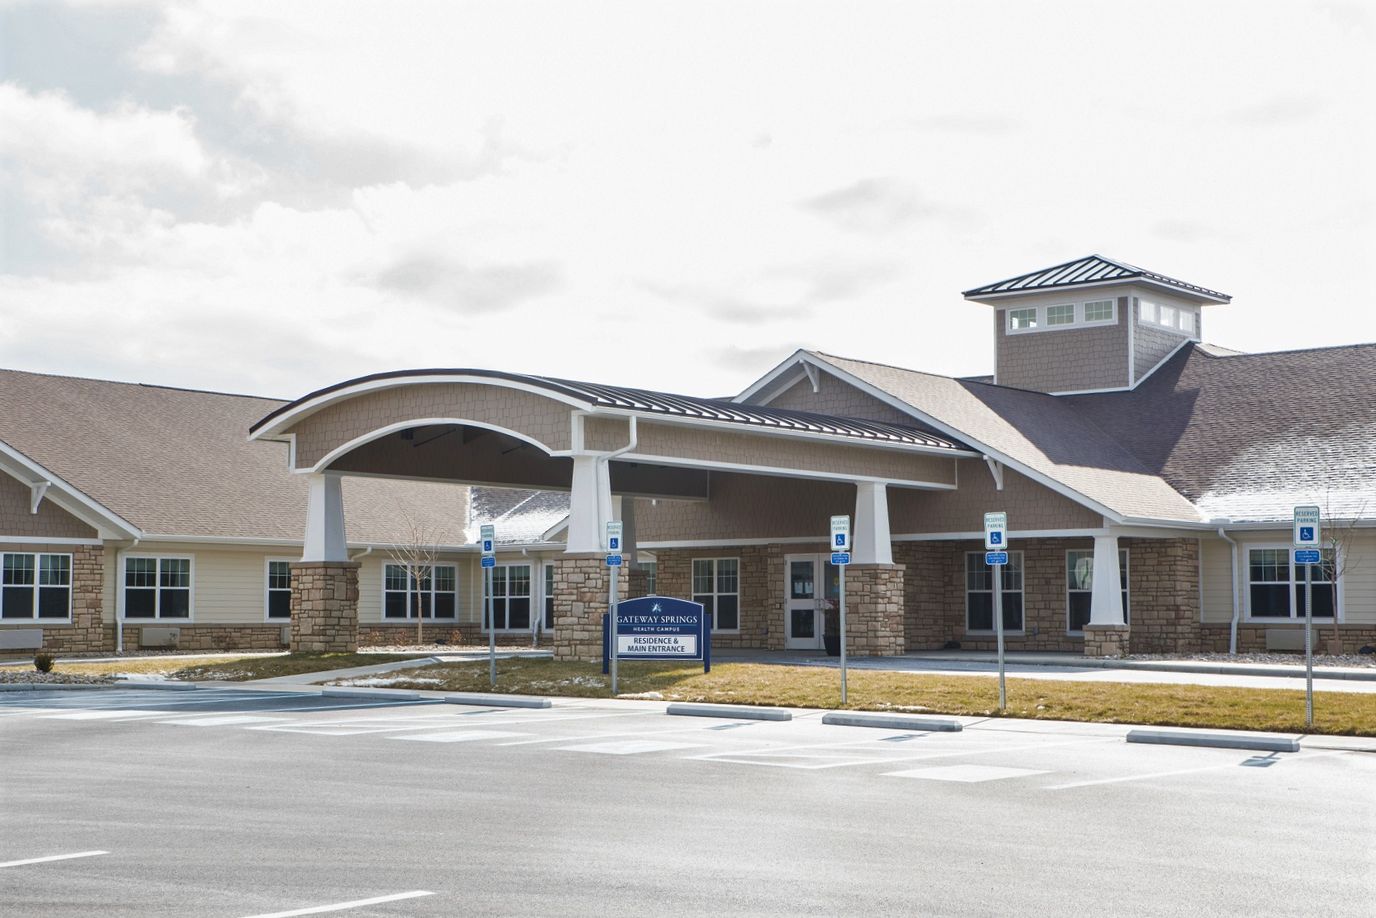
Make your golden years more golden with Gateway Springs Health Campus, a dependable community in Hamilton, OH, offering assisted living, memory care, and skilled nursing care. For families and other caregivers looking to take a break from caregiving, they provide adult day services with full access to their services and amenities. For residents who need extra care and love, their team is available 24/7 to offer assistance with daily living activities and more complex needs.

Vibrant life enrichment programs are also available to provide residents with countless opportunities to stay socially engaged and active. They serve fresh and healthy culinary delights daily to ensure residents maintain proper nourishment. Whether you’re seeking seamless transition or nurturing experiences, Gateway Springs Health Campus will go above and beyond to deliver them to you.

(513) 912-6834

Quality ratings

Measured by Centers for Medicare & Medicaid Services (CMS)

Overall rating Info The Overall CMS Rating combines results from health inspections, staffing levels and quality measures. Health inspections carry the most weight. Staffing and quality scores can increase or decrease the final rating based on performance compared to state and national standards.
4/5 ▲ 0.6 Ohio average: 3.4/5
Health Inspection Info Based on the results of the facility's three most recent standard inspections and any complaint investigations. CMS reviews the number, scope, and severity of deficiencies, with more recent findings weighted more heavily.
4/5 ▲ 1.1 Ohio average: 2.9/5
Staffing Info Measures average nursing staff hours per resident per day, including Registered Nurses (RNs) and total nursing staff. Ratings are adjusted based on the level of care residents require and are compared to state and national benchmarks.
4/5 ▲ 1.2 Ohio average: 2.9/5
Quality Measures Info Based on clinical and physical health indicators reported to CMS, such as hospital readmissions, falls, pressure ulcers, and improvements in mobility. These measures reflect how well residents' health needs are being managed.
4/5 ▼ 0.4 Ohio average: 4.4/5

Staffing hours breakdown

Info Daily nursing hours per resident by staff type, reported to CMS. Higher is generally better — compare this facility to state and national averages to see where staffing stands.

Hours per resident per day — compared to Ohio state averages

Total nursing care / resident Info This home is ranked 21st out of 176 homes in Ohio.

Total adjusted nursing hours per resident per day, combining RN, LPN, and aide time. CMS adjusts this for case-mix so facilities can be fairly compared.
4h 22m per day
Rank #21 / 176Nurse hours — state benchmarkedThis home is ranked 21st out of 176 homes in Ohio.Shows adjusted nurse hours per resident per day benchmarked to the Ohio average, with a ranking across 176 Ohio SNFs. More hours mean more direct care. The national average is about 3.5 hrs; below 3.0 is a red flag.
This facility Ohio avg (3h 50m per day)
vs Ohio avg
+14%

0 of 6 metrics below state avg

Standout metric Physical Therapist is +67% above state avg
Staff typeHours / dayvs state avg
Registered Nurse (RN) Info RNs hold the highest nursing license and can assess residents, interpret test results, and direct care plans. More RN hours per day often signals stronger clinical oversight and faster response to health changes. 50m per day ▲ 32% State avg: 38m per day · National avg: 41m per day
LPN / LVN Info Licensed Practical Nurses (LPNs) or Licensed Vocational Nurses (LVNs) deliver routine hands-on care — medication administration, wound dressing, and monitoring vital signs. They work under RN supervision and make up a large share of daily bedside care. 59m per day ■ Avg State avg: 58m per day · National avg: 52m per day
Nurse Aide Info Certified Nurse Aides (CNAs) provide the most direct day-to-day assistance: bathing, dressing, feeding, and mobility. Nurse aide hours are typically the largest staffing category and directly affect residents' quality of life. 2h 21m per day ▲ 10% State avg: 2h 8m per day · National avg: 2h 21m per day
Total Nursing (Weekend) Info Combined nursing hours (RN + LPN + Nurse Aide) per resident per day on weekends. Staffing often drops on weekends — this figure reveals whether the facility maintains adequate coverage outside of weekday hours. 3h 52m per day ▲ 18% State avg: 3h 17m per day · National avg: 3h 26m per day
Physical Therapist Info Hours per resident per day provided by licensed Physical Therapists (PTs) or PT Assistants. PT services help residents recover mobility after injury or illness and are especially important for post-acute (short-stay) rehabilitation. 5m per day ▲ 67% State avg: 3m per day · National avg: 4m per day
RN (Weekend) Info Registered nurse hours specifically on weekends. Facilities sometimes reduce RN presence on Saturdays and Sundays — a low weekend RN figure compared to weekday hours can indicate reduced clinical oversight when most administrative staff are absent. 31m per day ▲ 24% State avg: 25m per day · National avg: 29m per day

Capacity and availability

This home usually has availability

Occupancy lower than 85% suggests more openings may be available.

Lower occupancy than the Ohio average: 78.7%
Occupancy rate 50% Rank #138 / 177Occupancy rate — state benchmarkedThis home is ranked 138th out of 177 homes in Ohio.Shows this facility's occupancy rate versus the Ohio average, with its statewide rank out of 177. Higher occupancy signals strong local demand and financial stability.
Avg. Length of Stay 72 days
Occupancy rate
50% Rank #138 / 177Occupancy rate — state benchmarkedThis home is ranked 138th out of 177 homes in Ohio.Shows this facility's occupancy rate versus the Ohio average, with its statewide rank out of 177. Higher occupancy signals strong local demand and financial stability.
Avg. Length of Stay
72 days

Who this home usually serves

TYPE OF STAY

Mix of rehab and long-term care

This home supports both short-term rehab and long-term care, with residents staying for a wide range of durations.

Breakdown by payment type

Medicare

33% of new residents, usually for short-term rehab.

Typical stay 29 days

Private pay

56% of new residents, often for short stays.

Typical stay 4 - 5 months

Medicaid

12% of new residents, often for long-term daily care.

Typical stay 7 - 8 months

Finances and operations

Privately-owned community
Operated by a business corporation.
Home revenue
$8.4M
Operating loss
-$1.5M
Privately-owned community Operated by a business corporation.
Home revenue
$8.4M Rank #123 / 176Revenue — state benchmarkedThis home is ranked 123rd out of 176 homes in Ohio.Shows this facility's annual revenue compared to the Ohio SNF average. Higher revenue generally means more resources for staffing and capital — read alongside Payroll %.
Operating loss
-$1.5M
Payroll costs Info The portion of the home's budget spent on staff, including nurses, caregivers, and other employees who support care and operations. Rank #86 / 176Payroll — state benchmarkedThis home is ranked 86th out of 176 homes in Ohio.Shows total annual staff payroll benchmarked to the Ohio average. Higher payroll investment relative to peers often signals better staffing and less reliance on cheaper contract labor.
$4.2M
50.3% of revenue Rank #15 / 176Payroll % — state benchmarkedThis home is ranked 15th out of 176 homes in Ohio.Shows payroll as a percentage of revenue versus the Ohio average. Well-run SNFs often land around 55–65%. Below 25% may signal understaffing or heavy agency use — read with Staffing ratings.
Other operating costs Info All remaining costs needed to run the home, such as food, utilities, building maintenance, supplies and administrative expenses.
$5.6M
Total costs $9.9M
Walk Score
Walk Score: 3 / 100 Rank #118 / 123Walk Score — state benchmarkedThis home is ranked 118th out of 123 homes in Ohio.Shows how walkable this facility's neighborhood is compared to the average Walk Score across Ohio SNFs. Higher scores benefit residents, families, and staff.
Car-dependent. Most errands require a car, with limited nearby walkable options.

About this community

License Details

Facility TypeResidential Care Facility
StatusActive
CountyButler
CMS Certification Number366482

Ownership & Operating Entity

Gateway Springs Health Campus is administrated by Kiya Brown.

Staffing

Key information about the people who lead and staff this community.

Leadership

Director of NursingJAZMINE BELL

Contact Information

Fax(513) 973-4006

What does this home offer?

Housing options icon

Housing Options: 1 Bed / 2 Bed

Building type icon
Building type icon

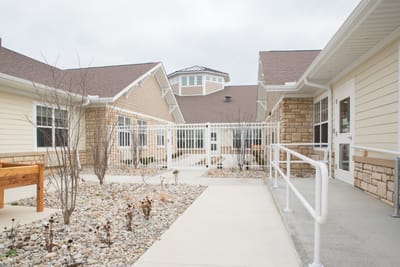
Building Type: Single-story
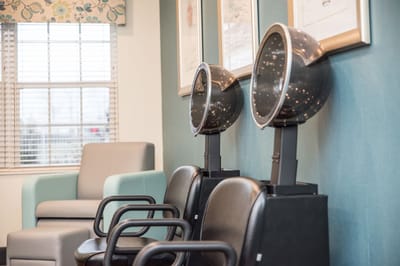
Dining services icon

Dining Services

Beauty services icon

Beauty Services

Transportation services icon

Transportation Services

Housekeeping icon
Housekeeping icon

Housekeeping Services

Recreational activities icon

Recreational Activities

Types of Care at Gateway Springs Health Campus

Assisted Living Memory Care

Contact Gateway Springs Health Campus

Inspection History

In Ohio, the Department of Health, Bureau of Survey and Certification conducts unannounced onsite inspections to evaluate the quality of care and environment in all licensed facilities.

3 visits/inspections Info Inspections are mandatory, regular evaluations conducted by state health departments or regulatory agencies. They ensure the community provides safe, compliant care, covering areas like resident health, staff and management.

Latest inspection

Date April 11, 2025

Inspection oversight

Immediate jeopardy identified:No
Substandard quality of care cited:No

5 deficiencies

Deficiencies indicate regulatory issues. A higher number implies the facility had several areas requiring improvement.

Ohio average: 29 deficiencies

Inspection Report Summary for Gateway Springs Health Campus

The most recent inspection on November 20, 2024, identified a deficiency related to incomplete medical record documentation for blood sugar monitoring and insulin administration for one resident. Earlier inspections showed mixed results, including deficiencies in resident funds management, pain management, and psychotropic medication use from January 31, 2024. Inspectors cited issues mainly with documentation accuracy and medication administration, as well as financial and clinical care processes. Complaint investigations were substantiated in both recent cases, with no enforcement actions or fines listed in the available reports. The inspection history shows recurring documentation and care management issues without a clear trend of improvement or worsening.

Health Inspection History

Inspections
Total health inspections 2

Ohio average 6.7


Last Health inspection on Nov 2024

Total health citations
5 Rank #7 / 177Health citations — state benchmarkedThis home is ranked 7th out of 177 homes in Ohio.Shows this facility's total health deficiency citations benchmarked to the Ohio state average, with a ranking across all 177 OH SNFs. Lower citation counts earn a better rank.

Ohio average 30.9

Citations per inspection
2.5

Ohio average 4.59


Health citations are formal notices following inspections when they fail to comply with safety and care standards.

4 of 5 citations resulted from standard inspections; and 1 of 5 resulted from complaint investigations.

Breakdown of citation severity (last 3 years)
Critical Health citations More info
0
100% better than Ohio average

Ohio average: 0.3


Serious Health citations More info 0
100% better than Ohio average

Ohio average: 0.9

0 critical citations More info Ohio average: 0.3

0 serious citations More info Ohio average: 0.9

5 moderate citations More info Ohio average: 29

0 minor citations More info Ohio average: 0.7
Citations history (last 3 years)
Care Planning moderate citation Info Issues related to creating and updating personalized care plans for residents based on their needs and conditions. Nov 20, 2024
Corrected

Pharmacy moderate citation Info Issues related to medication management, including how drugs are stored, administered, and monitored. Jan 31, 2024
Corrected

Quality of Care moderate citation Info Issues related to how well residents receive appropriate treatment and support for their medical and daily care needs. Jan 31, 2024
Corrected

Resident Rights moderate citation Info Issues related to resident's rights, including dignity, privacy, and the ability to make decisions about their care. Jan 31, 2024
Corrected

Compare Memory Care around Hamilton County The information below is reported by the Ohio Department of Health, Bureau of Survey and Certification.

Filter by care type
Burlington House Healthcare Center
NH

Nursing Home Licensed facility providing 24/7 skilled nursing care for residents with complex, ongoing medical needs. Staffed by RNs, LPNs, and CNAs. Inspected and star-rated annually by CMS. Accepts Medicare (short-term rehab) and Medicaid (long-term care).

AL

Assisted Living A licensed, long-term care setting for seniors or individuals with disabilities who need help with daily activities — like bathing, dressing, and medication management — but not 24-hour skilled nursing. Offers housing, meals, and around-the-clock support while aiming to maximize resident independence.

MC

Memory Care Secured, specialized care for people living with Alzheimer's or dementia. Staff trained in cognitive impairment, with higher staff-to-resident ratios and an environment designed to reduce confusion and wandering risk.

Cincinnati106No 4 1 Bed / 2 Bed---0
Alois Alzheimer Center
NH

Nursing Home Licensed facility providing 24/7 skilled nursing care for residents with complex, ongoing medical needs. Staffed by RNs, LPNs, and CNAs. Inspected and star-rated annually by CMS. Accepts Medicare (short-term rehab) and Medicaid (long-term care).

MC

Memory Care Secured, specialized care for people living with Alzheimer's or dementia. Staff trained in cognitive impairment, with higher staff-to-resident ratios and an environment designed to reduce confusion and wandering risk.

Cincinnati (Greenhills)97No 49 1 Bed / 2 Bed---1
Gateway Springs Health Campus
NH

Nursing Home Licensed facility providing 24/7 skilled nursing care for residents with complex, ongoing medical needs. Staffed by RNs, LPNs, and CNAs. Inspected and star-rated annually by CMS. Accepts Medicare (short-term rehab) and Medicaid (long-term care).

AL

Assisted Living A licensed, long-term care setting for seniors or individuals with disabilities who need help with daily activities — like bathing, dressing, and medication management — but not 24-hour skilled nursing. Offers housing, meals, and around-the-clock support while aiming to maximize resident independence.

MC

Memory Care Secured, specialized care for people living with Alzheimer's or dementia. Staff trained in cognitive impairment, with higher staff-to-resident ratios and an environment designed to reduce confusion and wandering risk.

Hamilton (Shadow Creek)94No 3 1 Bed / 2 Bed-Kiya Brown-0
Bridgeway Pointe
AL

Assisted Living A licensed, long-term care setting for seniors or individuals with disabilities who need help with daily activities — like bathing, dressing, and medication management — but not 24-hour skilled nursing. Offers housing, meals, and around-the-clock support while aiming to maximize resident independence.

MC

Memory Care Secured, specialized care for people living with Alzheimer's or dementia. Staff trained in cognitive impairment, with higher staff-to-resident ratios and an environment designed to reduce confusion and wandering risk.

Cincinnati (Hartwell)92No 38 1 Bed / 2 Bed--895
Mimi’s House Assisted Living and Memory Care
AL

Assisted Living A licensed, long-term care setting for seniors or individuals with disabilities who need help with daily activities — like bathing, dressing, and medication management — but not 24-hour skilled nursing. Offers housing, meals, and around-the-clock support while aiming to maximize resident independence.

MC

Memory Care Secured, specialized care for people living with Alzheimer's or dementia. Staff trained in cognitive impairment, with higher staff-to-resident ratios and an environment designed to reduce confusion and wandering risk.

Maineville12 ResidentsNo 12 1 Bed / 2 Bed---0

Financial Assistance for
Memory Care in Ohio

Get Financial aid guidance

PASSPORT Waiver

Ohio Medicaid PASSPORT

Age 60+
General Ohio resident, Medicaid-eligible, nursing home-level care need.
Income Limits (2025) ~$2,829/month 300% FBR, individual
Asset Limits $2,000 (individual), $3,000 (couple).
OH

Administered through regional agencies; waitlists possible.

Benefits
Personal care (5-7 hours/day) Respite (240 hours/year) Adult day care ($65/day) Home modifications ($1,500 avg.)

Ohio Home Care Program (non-Medicaid)

OH HCP

Age 60+
General Ohio resident, at risk of decline.
Income Limits ~$2,000/month individual, varies
Asset Limits $5,000 individual
OH

Limited funding; regional variation.

Benefits
In-home care (3-5 hours/week) Respite (up to 10 days/year) Transportation (~5 trips/month)

Assisted Living Waiver (ALW)

Ohio Assisted Living Waiver

Age 21+ (65+ prioritized)
General OH resident, Medicaid-eligible, NFLOC.
Income Limits (2025) ~$2,829/month (individual); QIT required.
Asset Limits $2,000 (individual), $3,000 (couple).
OH

Covers ~300 facilities; room/board not included (separate cost).

Benefits
Personal care Meals Medication management Transportation (~$3,000-$4,000/month value)

Program of All-Inclusive Care for the Elderly (PACE)

Ohio PACE (e.g., McGregor PACE)

Age 55+
General OH resident (specific counties), NFLOC, safe with PACE support.
Income Limits (2025) ~$2,829/month (Medicaid-eligible); private pay option available.
Asset Limits $2,000 (individual), $3,000 (couple) for Medicaid enrollees.
OH

Available in 9 counties (e.g., Cuyahoga, Franklin); expanding via Healthy Aging Grants.

Benefits
Personal care (5-7 hours/day) Medical care Meals Transportation Respite Therapies

Medicare Savings Program (MSP)

Ohio Medicare Savings Program

Age 65+ or disabled
General OH resident, Medicare Part A/B.
Income Limits (2025) ~$2,510/month (QMB), ~$3,380/month (SLMB), ~$3,598/month (QI)—individual.
Asset Limits $9,430 (individual), $14,130 (couple).
OH

Three tiers; includes Extra Help for Part D; no waitlist.

Benefits
Covers Part B premiums ($174.70/month) Deductibles ($240/year) Copays (~20%)

Home Energy Assistance Program (HEAP)

Ohio HEAP

Age 60+ prioritized
General OH resident, low-income household.
Income Limits (2025) ~$3,970/month individual, 185% FPL
Asset Limits Not assessed; income-focused.
OH

Covers gas, electric, oil; emergency aid via Winter/Summer Crisis Programs.

Benefits
Heating/cooling aid ($300-$1,000/season) Emergency aid ($500 max)

Family Caregiver Support Program (FCSP)

Ohio Family Caregiver Support Program

Age
General Caregivers of 60+ needing care or 55+ caregivers of others; OH resident; functional needs (2+ ADLs).
Income Limits (2025) Prioritizes ~$24,980/year (individual); no strict cap.
Asset Limits Not assessed; need-based.
OH

12 AAAs; rural/low-income priority; volunteer respite option.

Benefits
Respite (4-6 hours/week or 5 days/year) Adult day care ($60/day) Training Supplies (~$500/year)

Senior Community Service Employment Program (SCSEP)

Ohio SCSEP

Age 55+
General unemployed, low-income, OH resident.
Income Limits (2025) ~$1,983/month 125% FPL
Asset Limits Not specified; income-focused.
OH

Priority for veterans, rural residents; AARP partnership.

Benefits
Paid training (~20 hours/week at ~$7.25/hour) Job placement

VA Aid and Attendance (A&A) and Housebound Benefits

Ohio VA Aid and Attendance/Housebound

Age 65+ or disabled veteran/spouse
General OH resident, wartime service, need for ADL help (A&A) or homebound.
Income Limits (2025) Net income < ~$1,984/month (veteran with dependent, A&A); pension offsets income.
Asset Limits ~$155,356 net worth limit
OH

High veteran demand; supports care in multiple settings.

Benefits
Cash (~$1,433-$2,642/month veteran, ~$951-$1,318 spouse) for care costs (e.g., in-home, assisted living)

Homestead Exemption

Ohio Homestead Exemption

Age 65+ (or disabled)
General OH resident, homeowner, low-income.
Income Limits (2025) ~$38,500/year individual, adjusted annually
Asset Limits Not assessed; home ownership required.
OH

Reduces taxable value by $25,000; applies to primary residence.

Benefits
Tax reduction (~$400-$800/year avg., varies by county)

Save the Dream Ohio (Homeowner Assistance Fund)

Ohio Save the Dream

Age 60+ prioritized
General OH resident, homeowner, hardship post-Jan 21, 2020.
Income Limits (2025) ~$147,600/year family of 4, 150% AMI; varies by county
Asset Limits Not assessed; hardship-focused.
OH

Covers delinquent mortgages, utilities, taxes; max $25,000 mortgage aid.

Benefits
Mortgage aid ($25,000 max) Utility/property tax aid ($5,000 avg.)

Places of interest near Gateway Springs Health Campus

Address 4.3 miles from city center Info Estimated distance in miles from Hamilton's city center to Gateway Springs Health Campus's address, calculated via Google Maps.

Calculate Travel Distance to Gateway Springs Health Campus

Add your location

Address

Staffing Data (Q2 2025)

This data corresponds to Q2 2025 and is based on CMS Payroll-Based Journal.

Total staff 100
Employees 84
Contractors 16
Staff to resident ratio 2.38:1
11% better than Ohio average

Ohio average ratio: 2.14:1

Avg staff/day 33
Average shift 8.2 hours
0% compared with Ohio average

Ohio average: 8.1 hours

Total staff hours (quarter) 24,630
Nursing staff breakdown
Registered Nurse

Manages medical care and health needs.

Total count 5
Average shift length Info Average shift length. Calculated as total hours divided by days worked and average staff per day. 9.5 hours

No contractors work on this role.

Licensed Practical Nurse

Assists with medical care and medications.

Total count 18
Average shift length Info Average shift length. Calculated as total hours divided by days worked and average staff per day. 8.9 hours

No contractors work on this role.

Certified Nursing Assistant

Helps with daily care and mobility.

Total count 31
Average shift length Info Average shift length. Calculated as total hours divided by days worked and average staff per day. 9 hours

No contractors work on this role.

Contractor staffing

Total hours from contractors

7.6%

1,862 contractor hours this quarter

Physical Therapy Aide: 5 Physical Therapy Assistant: 3 Respiratory Therapy Technician: 3 Qualified Social Worker: 2 Speech Language Pathologist: 2 Medical Director: 1
Staff by category
Certified Nursing Assistant310319,38391100%9
Licensed Practical Nurse180183,81591100%8.9
Other Dietary Services Staff9092,95891100%7.4
Registered Nurse5051,9689099%9.5
RN Director of Nursing3038887178%8.3
Medication Aide/Technician3037096774%8.3
Clinical Nurse Specialist5055836470%7.5
Nurse Aide in Training3035334448%10.6
Mental Health Service Worker1015016571%7.7
Nurse Practitioner1014806268%7.7
Administrator2024705864%8.1
Speech Language Pathologist0224686167%7
Dietitian1014525257%8.7
Respiratory Therapy Technician0334286369%5.2
Physical Therapy Aide0553896571%5.8
Qualified Social Worker0223526470%5.5
Physical Therapy Assistant0332003842%5.1
Occupational Therapy Assistant202304044%0.7
Medical Director011241011%2.4
31 Certified Nursing Assistant
% of Days 100%
18 Licensed Practical Nurse
% of Days 100%
9 Other Dietary Services Staff
% of Days 100%
5 Registered Nurse
% of Days 99%
3 RN Director of Nursing
% of Days 78%
3 Medication Aide/Technician
% of Days 74%
5 Clinical Nurse Specialist
% of Days 70%
3 Nurse Aide in Training
% of Days 48%
1 Mental Health Service Worker
% of Days 71%
1 Nurse Practitioner
% of Days 68%
2 Administrator
% of Days 64%
2 Speech Language Pathologist
% of Days 67%
1 Dietitian
% of Days 57%
3 Respiratory Therapy Technician
% of Days 69%
5 Physical Therapy Aide
% of Days 71%
2 Qualified Social Worker
% of Days 70%
3 Physical Therapy Assistant
% of Days 42%
2 Occupational Therapy Assistant
% of Days 44%
1 Medical Director
% of Days 11%

Facility Characteristics

Source: CMS Long-Term Care Facility Characteristics (Data as of Jan 2026)

Total residents 42
Medicare
6
14.3% of residents
Medicaid
21
50% of residents
Private pay or other
15
35.7% of residents
Programs & Services
CCRC

Part of a Continuing Care Retirement Community offering multiple care levels

Quality of care over time

These measures show how residents usually do over time at this home, based on health outcomes and preventive care.

High-risk clinical events score Info A composite score based on pressure ulcers, falls with injury, weight loss, walking ability decline, and activities of daily living decline. 4.8
18% better than Ohio average

Ohio average: 5.8

Functional decline score Info A composite score based on activities of daily living decline, walking ability decline, and incontinence. 10.1
21% better than Ohio average

Ohio average: 12.7

Long-stay resident measures
Significantly above average Ohio avg: 4.7 Info CMS star rating based on long-stay quality measure performance. 5 stars = significantly above average, 1 star = significantly below average.
Need for Help with Daily Activities Increased Info Percent of long-stay residents whose need for help with daily activities has increased 3.7%
45% better than Ohio average

Ohio average: 6.8%

Walking Ability Worsened Info Percent of long-stay residents whose ability to move independently worsened 6.1%
31% better than Ohio average

Ohio average: 8.9%

Low Risk Residents with Bowel/Bladder Incontinence Info Percent of low risk long-stay residents who lose control of their bowels or bladder 20.3%
7% better than Ohio average

Ohio average: 22.0%

Falls with Major Injury Info Percent of long-stay residents experiencing one or more falls with major injury 4.4%
30% worse than Ohio average

Ohio average: 3.4%

High Risk Residents with Pressure Ulcers Info Percent of long-stay high risk residents with pressure ulcers 3.2%
18% better than Ohio average

Ohio average: 3.9%

Urinary Tract Infection Info Percent of long-stay residents with a urinary tract infection 0.0%
100% better than Ohio average

Ohio average: 0.5%

Lost Too Much Weight Info Percent of long-stay residents who lose too much weight 6.4%
In line with Ohio average

Ohio average: 6.2%

Depressive Symptoms Info Percent of long-stay residents who have depressive symptoms 30.9%
29% worse than Ohio average

Ohio average: 24.0%

Antipsychotic Use Info Percent of long-stay residents who received an antipsychotic medication 2.2%
74% better than Ohio average

Ohio average: 8.4%

Pneumococcal Vaccine Info Percent of long-stay residents assessed and appropriately given the pneumococcal vaccine 100.0%
8% better than Ohio average

Ohio average: 92.4%

Influenza Vaccine Info Percent of long-stay residents assessed and appropriately given the seasonal influenza vaccine 100.0%
6% better than Ohio average

Ohio average: 94.5%

Short-stay resident measures
Average Ohio avg: 2.4 Info CMS star rating based on short-stay quality measure performance. 5 stars = much above average, 1 star = much below average.
Pneumococcal Vaccine Info Percent of short-stay residents assessed and appropriately given the pneumococcal vaccine 99.5%
27% better than Ohio average

Ohio average: 78.0%

Antipsychotic medication increase Info Percent of short-stay residents who newly received an antipsychotic medication 1.3%
In line with Ohio average

Ohio average: 1.3%

Influenza Vaccine Info Percent of short-stay residents assessed and appropriately given the seasonal influenza vaccine 99.1%
31% better than Ohio average

Ohio average: 75.6%

Re-hospitalized after SNF stay Info Percentage of short-stay residents who were re-hospitalized after their nursing home admission. 42.6%
70% worse than Ohio average

Ohio average: 25.1%

Emergency department visits Info Percentage of short-stay residents who had an outpatient emergency department visit. 17.8%
42% worse than Ohio average

Ohio average: 12.5%

Falls with major injury Info Percentage of SNF residents who experience falls with major injury during their stay. 0.0%
100% better than Ohio average

Ohio average: 0.8%

Ability to care for self at discharge Info Percentage of residents at or above expected ability to care for themselves at discharge. 56.6%
5% better than Ohio average

Ohio average: 53.7%

Successful return to home or community Info Rate of successful return to home or community from a skilled nursing facility. 57.9%
15% better than Ohio average

Ohio average: 50.6%

Guides for Better Senior Living

Care Cost Calculator: See Prices in Your Area

Nursing Home Data Explorer

Don’t Wait Too Long: 7 Red Flag Signs Your Parent Needs Assisted Living Now

The True Cost of Assisted Living in 2025 – And How Families Are Paying For It

Understanding Senior Living Costs: Pricing Models, Discounts & Financial Assistance

Tour Icon
Planning a tour? Check our touring checklist.
Chat Icon
Thinking of living here? We can help you speak to a current resident
Explore Open Rooms
1 Contact details
2 What type of senior care service are you looking for?
3 What budget do you have in mind for senior care?
4 How soon do you need to find care?
5 Additional details

Thank you for your interest!

Our team will be in touch shortly to help with next steps.