Total health inspections
7
California average 12.5
Last Health inspection on Oct 2024

We arrange tours, appointments, and even moving support so you don’t have to
Thank you for your interest!
Our team will be in touch shortly to help with next steps.
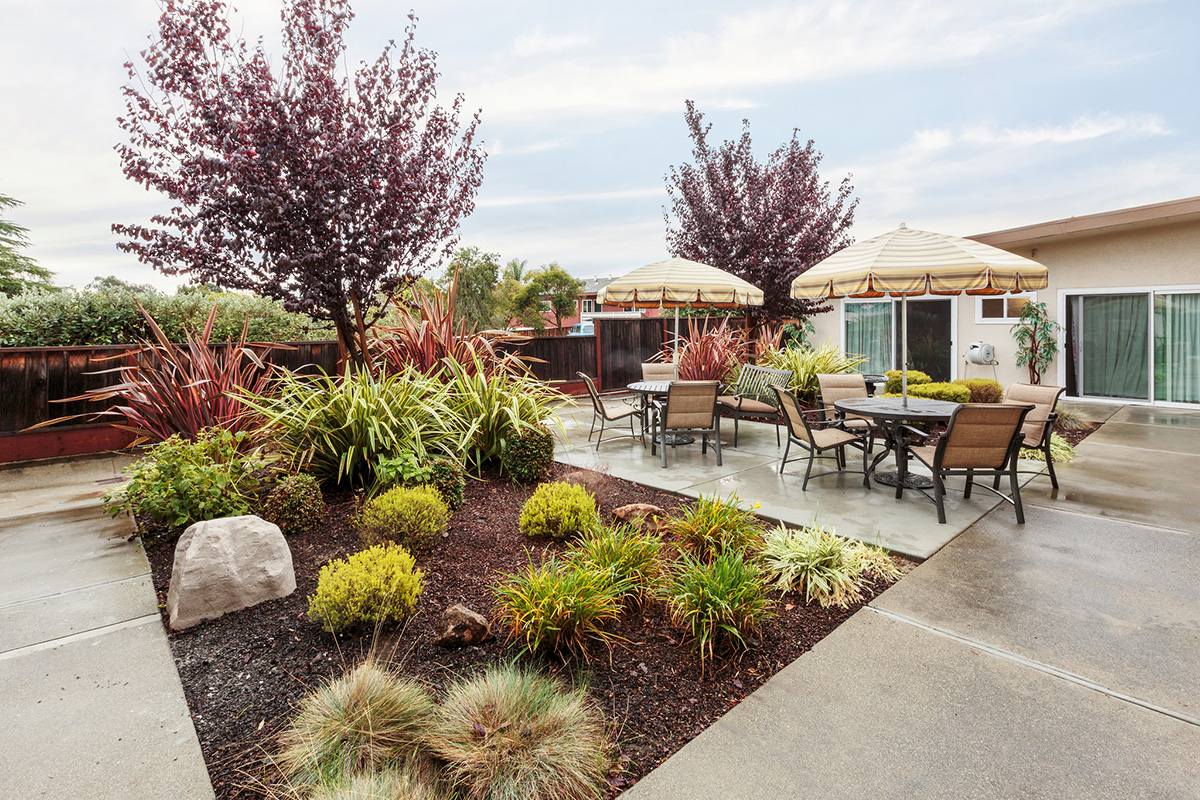


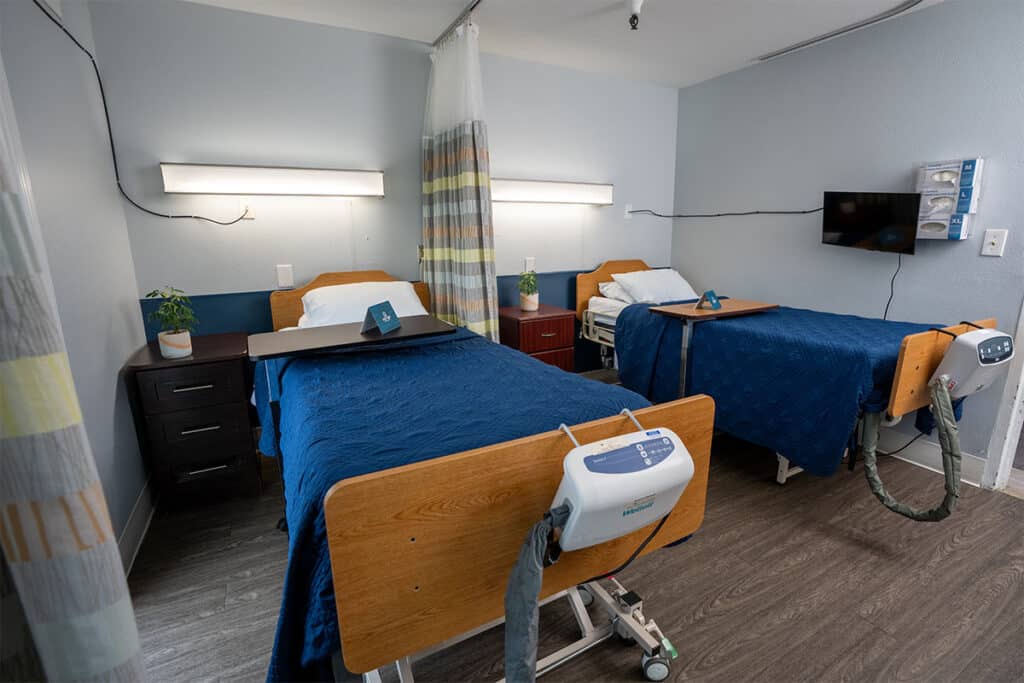

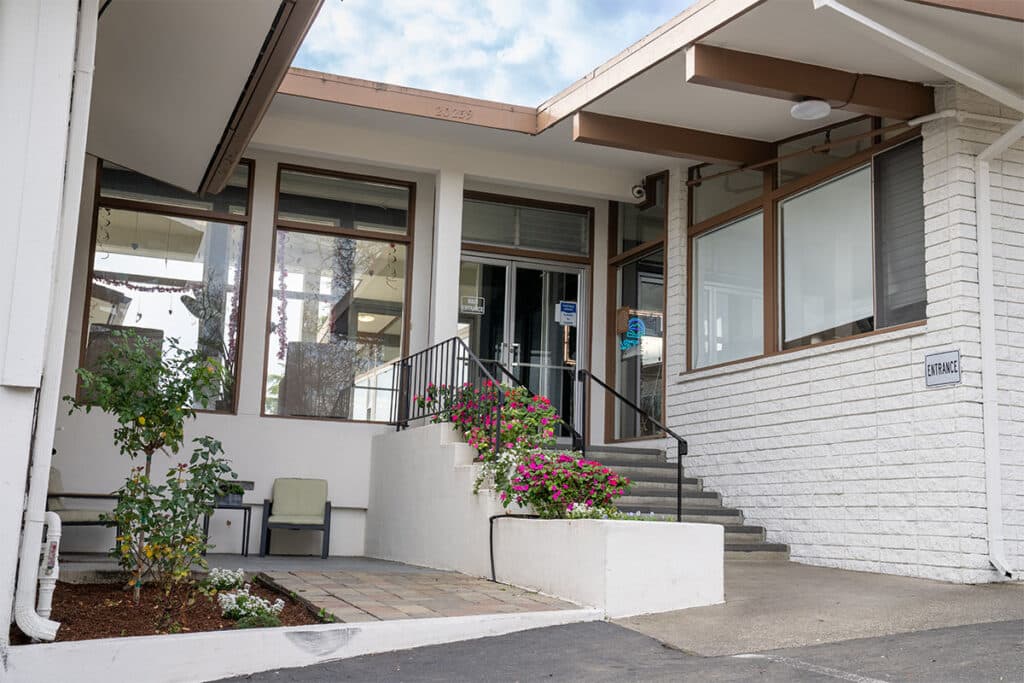
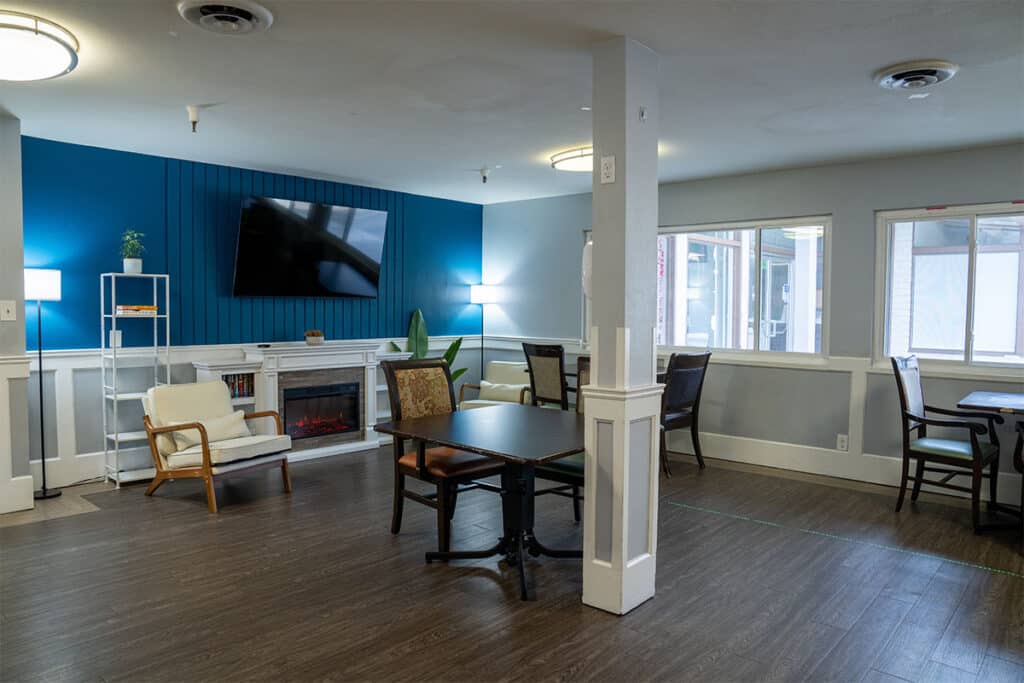

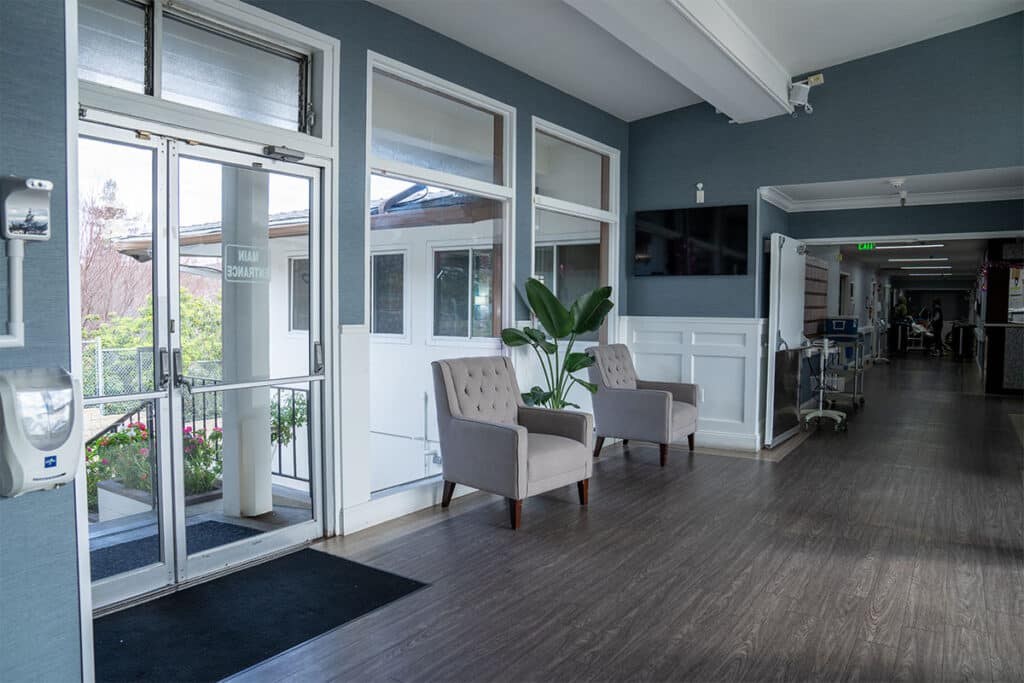
East Bay Post-acute Healthcare Center is a distinguished community located near several medical and healthcare providers on Lake Chabot Road, Castro Valley, CA, that provides nursing care. With top-notch care and assistance around the clock, residents keep peace of mind and gain meaningful experiences in their later years. The community also features an extensive array of amenities and cozy spaces, ensuring residents can easily adapt to their surroundings.
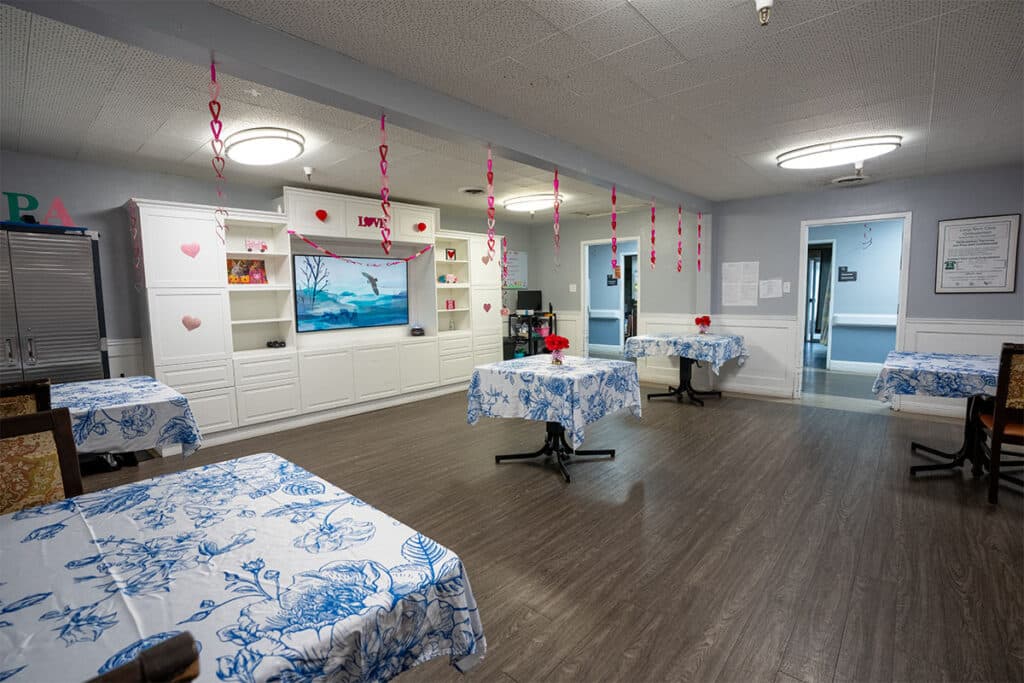
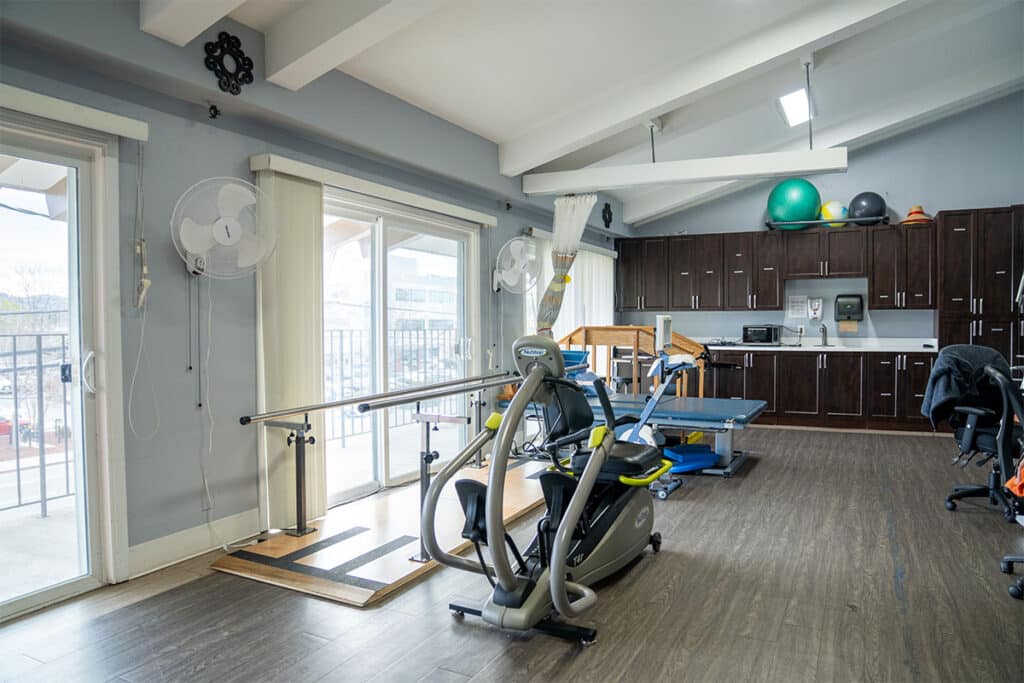
Dedicated to improving residents’ well-being, the community also conducts stimulating programs and engaging events to keep them happy and active. Here, residents have the finest dining experience with delicious and healthy meals that cater to dietary needs and preferences. The community also provides complex wound care and hospice services to meet residents’ ever-changing needs. Residents can rest assured of living their golden years without worries, with the community’s comprehensive care and purposely designed amenities.
May offer a more intimate, personalized care environment.
Lower occupancy suggests more openings may be available.
Residents typically stay for brief periods, with frequent admissions and discharges throughout the year.
33% of new residents, usually for short-term rehab.
64% of new residents, often for short stays.
3% of new residents, often for long-term daily care.
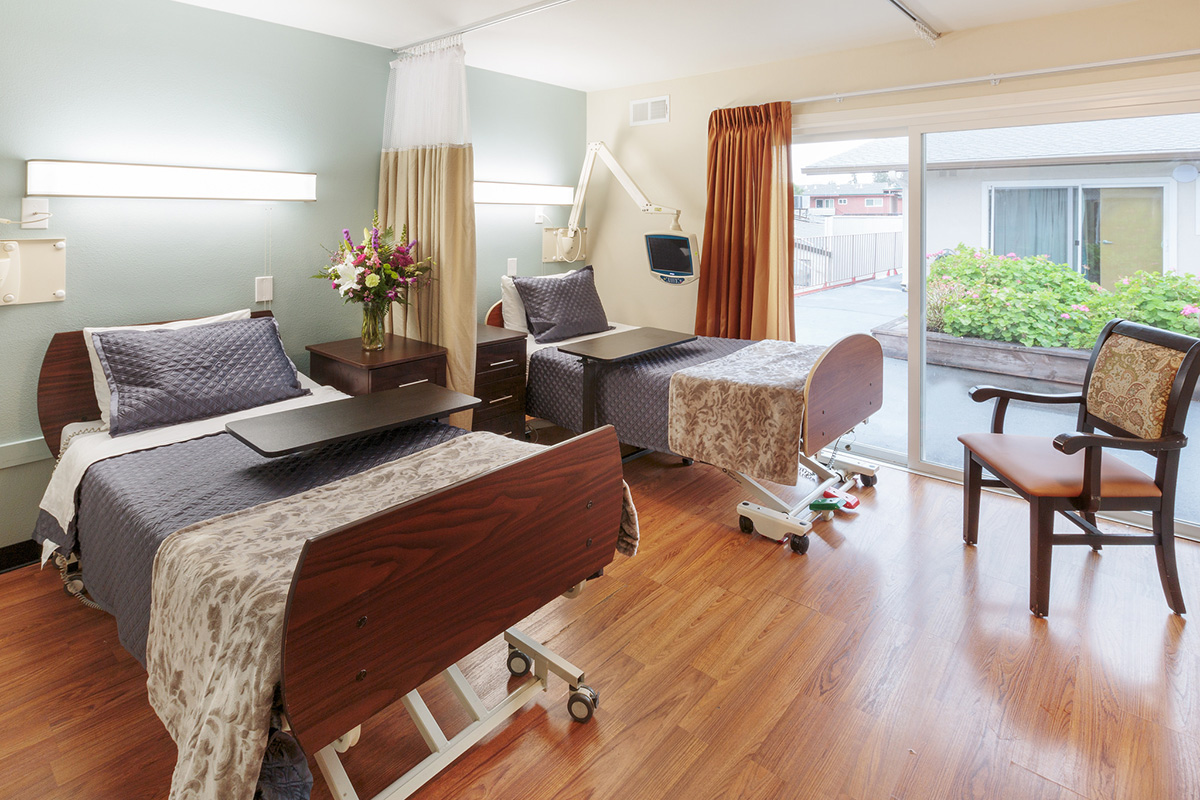
Housing Options: Private / Semi-Private Rooms
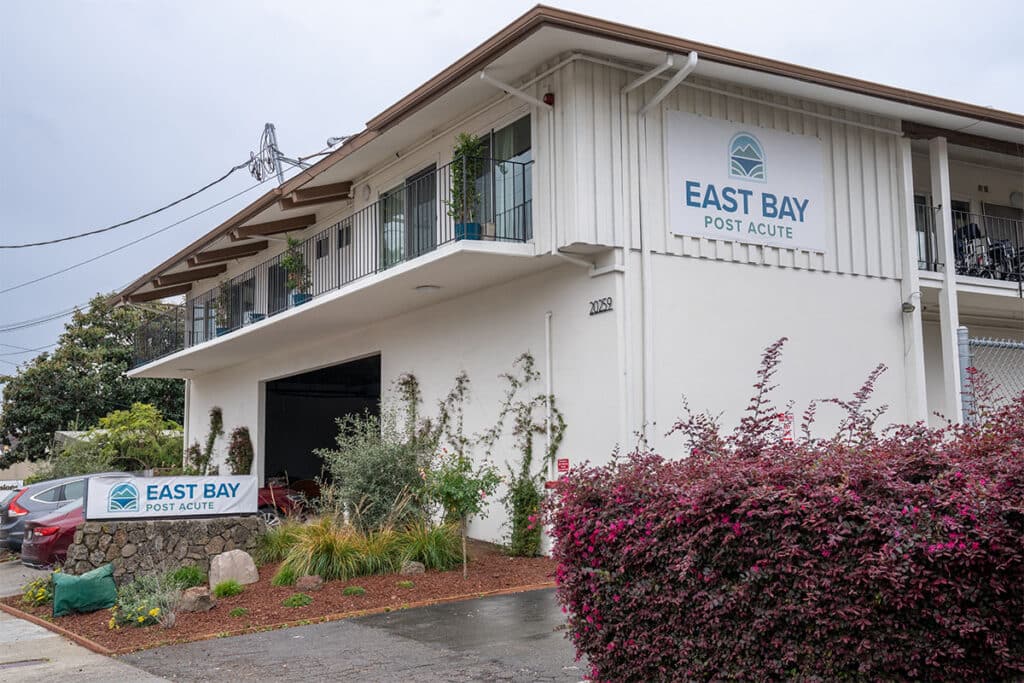
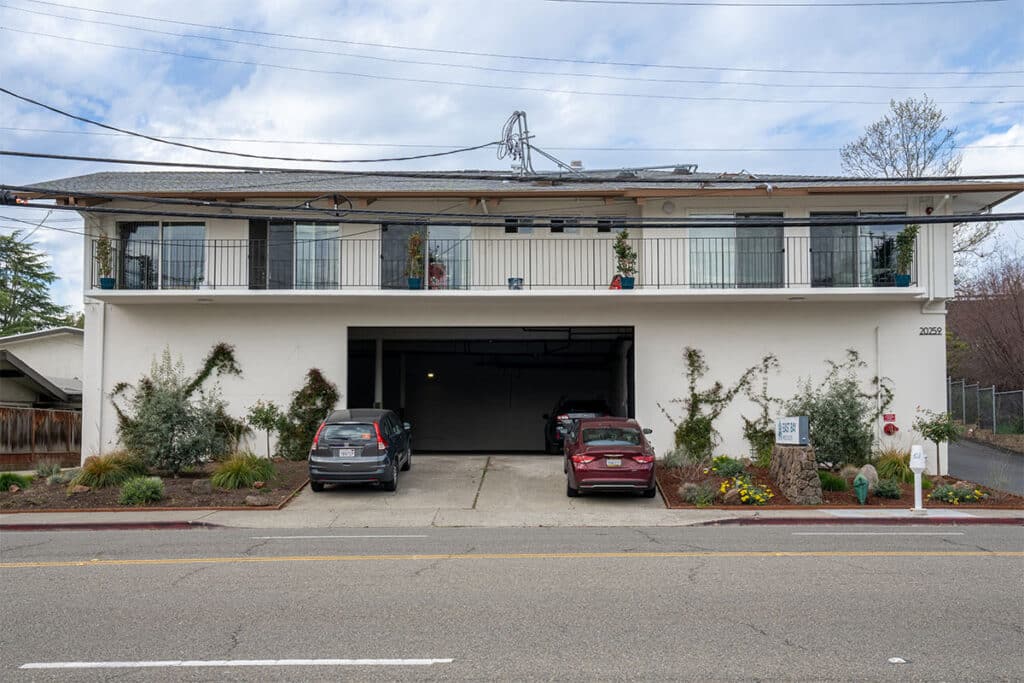
Building Type: 2-story
Dining Services
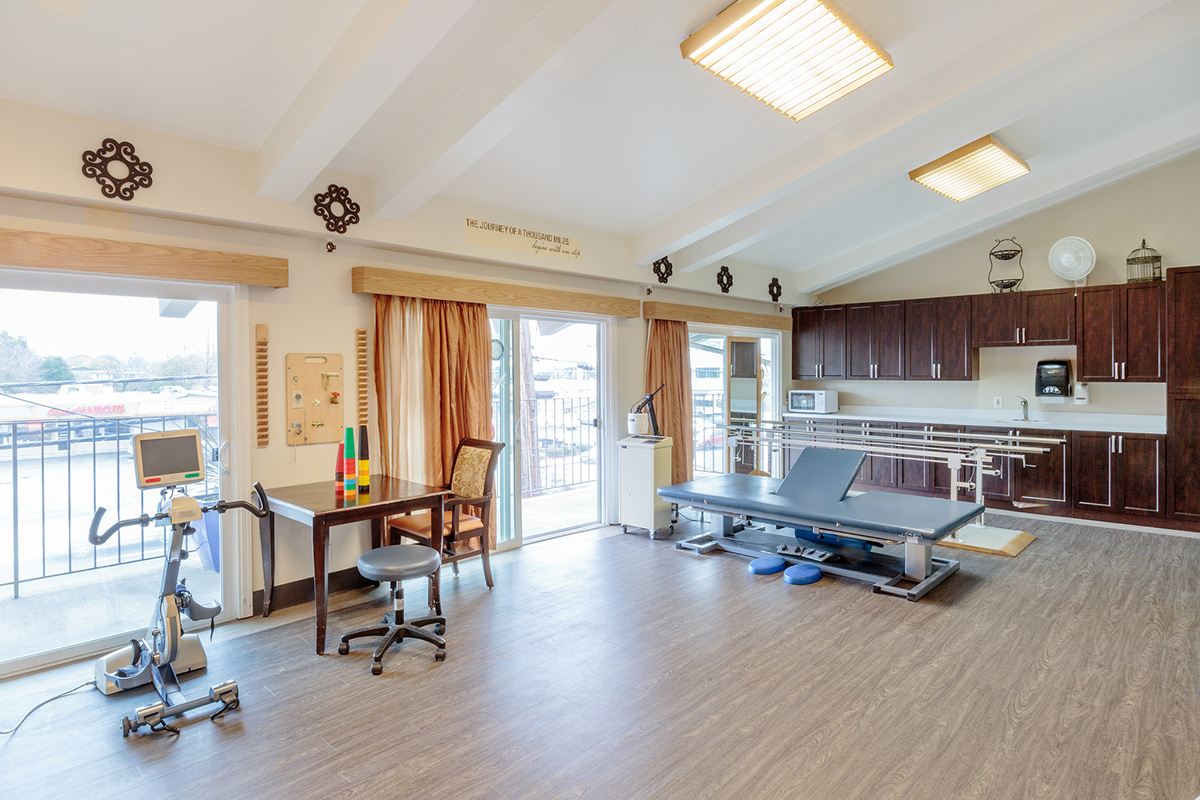
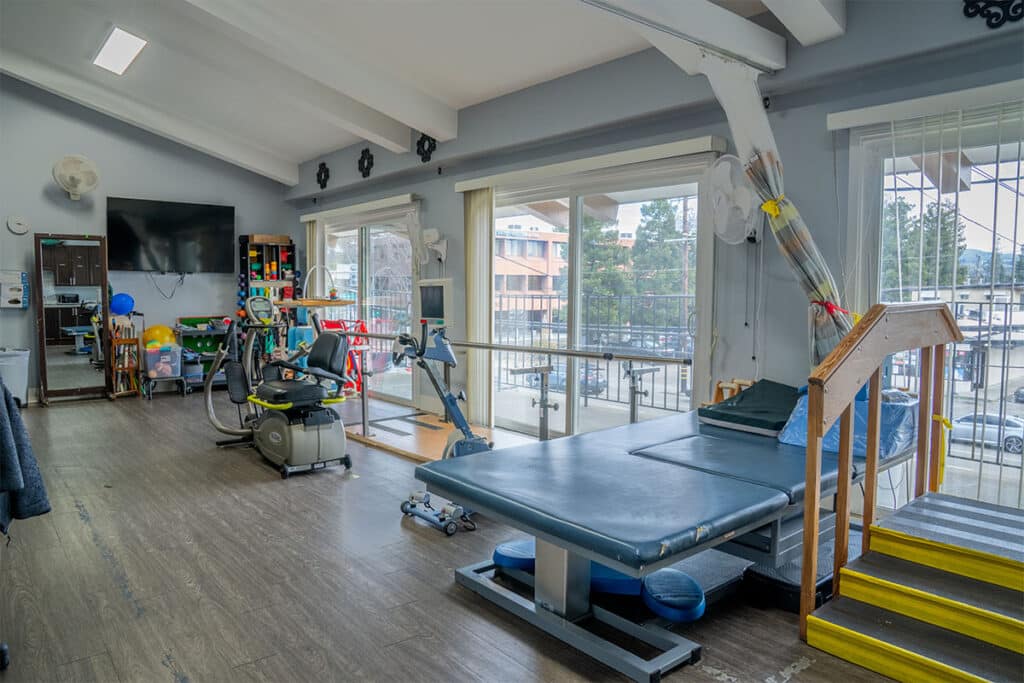
Recreational Activities
Exercise Programs
California average 12.5
Last Health inspection on Oct 2024
California average 50.2
California average 4.65
Health citations are formal notices following inspections when they fail to comply with safety and care standards.
42 of 50 citations resulted from standard inspections; 7 of 50 resulted from complaint investigations; and 1 of 50 came from combined inspections (standard and complaint).
California average: 0.4
California average: 1
Data sourced from CMS Health Deficiencies reports. Citation severity codes range from A (least serious) to L (most serious). Immediate Jeopardy (J-L) citations indicate situations where the facility's noncompliance has placed residents at risk of death or serious harm.
Nursing Home Licensed facility providing 24/7 skilled nursing care for residents with complex, ongoing medical needs. Staffed by RNs, LPNs, and CNAs. Inspected and star-rated annually by CMS. Accepts Medicare (short-term rehab) and Medicaid (long-term care).
Home Care Professional care delivered in the person's own home — from companionship and errands to skilled nursing and therapy. Allows seniors to age in place. Medicare covers skilled home health when medically necessary.
Nursing Home Licensed facility providing 24/7 skilled nursing care for residents with complex, ongoing medical needs. Staffed by RNs, LPNs, and CNAs. Inspected and star-rated annually by CMS. Accepts Medicare (short-term rehab) and Medicaid (long-term care).
Nursing Home Licensed facility providing 24/7 skilled nursing care for residents with complex, ongoing medical needs. Staffed by RNs, LPNs, and CNAs. Inspected and star-rated annually by CMS. Accepts Medicare (short-term rehab) and Medicaid (long-term care).
Home Care Professional care delivered in the person's own home — from companionship and errands to skilled nursing and therapy. Allows seniors to age in place. Medicare covers skilled home health when medically necessary.
Nursing Home Licensed facility providing 24/7 skilled nursing care for residents with complex, ongoing medical needs. Staffed by RNs, LPNs, and CNAs. Inspected and star-rated annually by CMS. Accepts Medicare (short-term rehab) and Medicaid (long-term care).
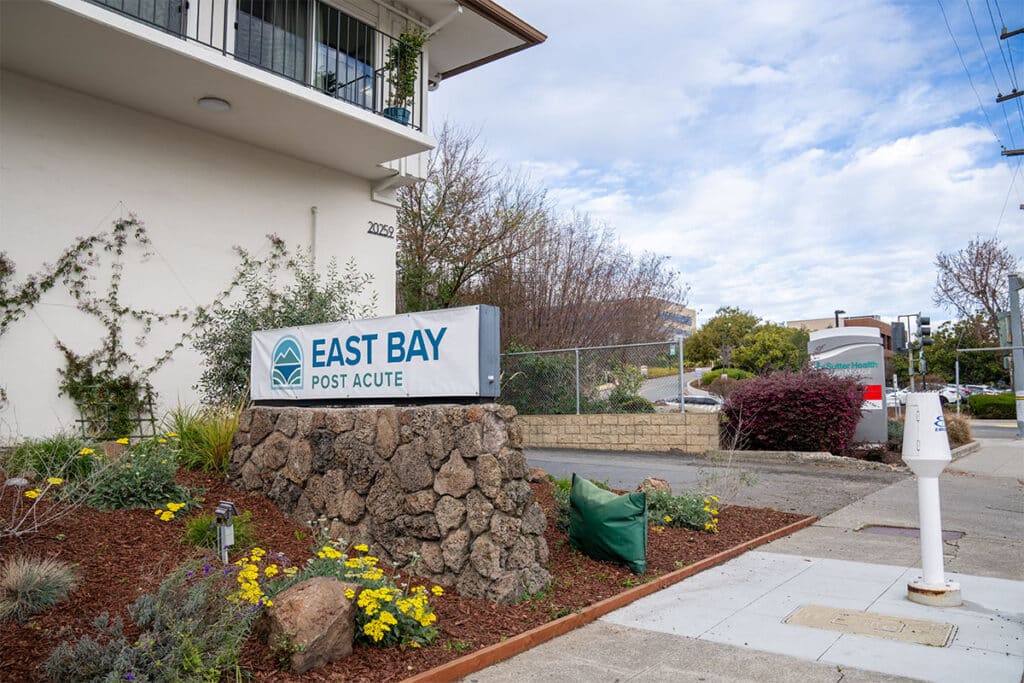
![]() 0.9 miles from city center
0.9 miles from city center
![]() 20259 Lake Chabot Rd, Castro Valley, CA 94546
20259 Lake Chabot Rd, Castro Valley, CA 94546
Add your location
This data corresponds to Q2 2025 and is based on CMS Payroll-Based Journal.
California average ratio: 0.00:1
California average: 7.7 hours
Manages medical care and health needs.
No contractors work on this role.
Assists with medical care and medications.
This role is partially covered by contractors.
Helps with daily care and mobility.
This role is partially covered by contractors.
Total hours from contractors
3,410 contractor hours this quarter
| Certified Nursing Assistant | 37 | 129 | 166 | 16,208 | 91 | 100% | 7.6 |
| Licensed Practical Nurse | 24 | 1 | 25 | 7,762 | 91 | 100% | 8 |
| Registered Nurse | 16 | 0 | 16 | 5,093 | 91 | 100% | 8.1 |
| RN Director of Nursing | 2 | 0 | 2 | 1,024 | 64 | 70% | 8 |
| Speech Language Pathologist | 4 | 0 | 4 | 932 | 78 | 86% | 6.3 |
| Other Dietary Services Staff | 3 | 0 | 3 | 754 | 90 | 99% | 7.5 |
| Dental Services Staff | 2 | 0 | 2 | 682 | 72 | 79% | 6.9 |
| Respiratory Therapy Technician | 2 | 0 | 2 | 667 | 64 | 70% | 6.8 |
| Administrator | 1 | 0 | 1 | 512 | 64 | 70% | 8 |
| Nurse Practitioner | 1 | 0 | 1 | 512 | 64 | 70% | 8 |
| Dietitian | 1 | 0 | 1 | 512 | 64 | 70% | 8 |
| Physical Therapy Assistant | 4 | 0 | 4 | 366 | 70 | 77% | 4.9 |
| Qualified Social Worker | 3 | 0 | 3 | 326 | 49 | 54% | 6.4 |
| Physical Therapy Aide | 1 | 0 | 1 | 316 | 43 | 47% | 7.4 |
| Therapeutic Recreation Specialist | 1 | 0 | 1 | 102 | 27 | 30% | 3.8 |
Source: CMS Long-Term Care Facility Characteristics (Data as of Jan 2026)
Residents meet regularly to discuss policies, care quality, and activities
State-approved Nurse Aide Training and Competency Evaluation Program on-site
Organized group of residents that meets regularly to discuss facility policies, quality of life, and activities.
Data sourced from CMS Long-Term Care Facility Characteristics quarterly report. Payer mix reflects the current resident census by primary payment source.
These measures show how residents usually do over time at this home, based on health outcomes and preventive care.
California average: 6.6
California average: 11.3
California average: 11.1%
California average: 12.0%
California average: 11.3%
California average: 1.7%
California average: 5.0%
California average: 1.2%
California average: 4.2%
California average: 6.7%
California average: 10.1%
California average: 98.5%
California average: 98.2%
California average: 2.25
California average: 1.59
California average: 94.0%
California average: 1.5%
California average: 93.2%
California average: 23.2%
California average: 11.2%
California average: 0.8%
California average: 53.7%
California average: 50.6%
Quality measures are calculated from Minimum Data Set (MDS) assessments. For most measures, lower percentages indicate better care quality.
Historical financial and operational data for East Bay Post-Acute Healthcare Center based on CMS SNF Cost Reports.
Loading trend charts...
Care Cost Calculator: See Prices in Your Area
Nursing Home Data Explorer
Don’t Wait Too Long: 7 Red Flag Signs Your Parent Needs Assisted Living Now
The True Cost of Assisted Living in 2025 – And How Families Are Paying For It
Understanding Senior Living Costs: Pricing Models, Discounts & Financial Assistance

Touring a community? Use this expert-backed checklist to stay organized, ask the right questions, and find the perfect fit.
We'll send you a PDF version of the touring checklist.