Occupancy rate
93%

We arrange tours, appointments, and even moving support so you don’t have to
Thank you for your interest!
Our team will be in touch shortly to help with next steps.
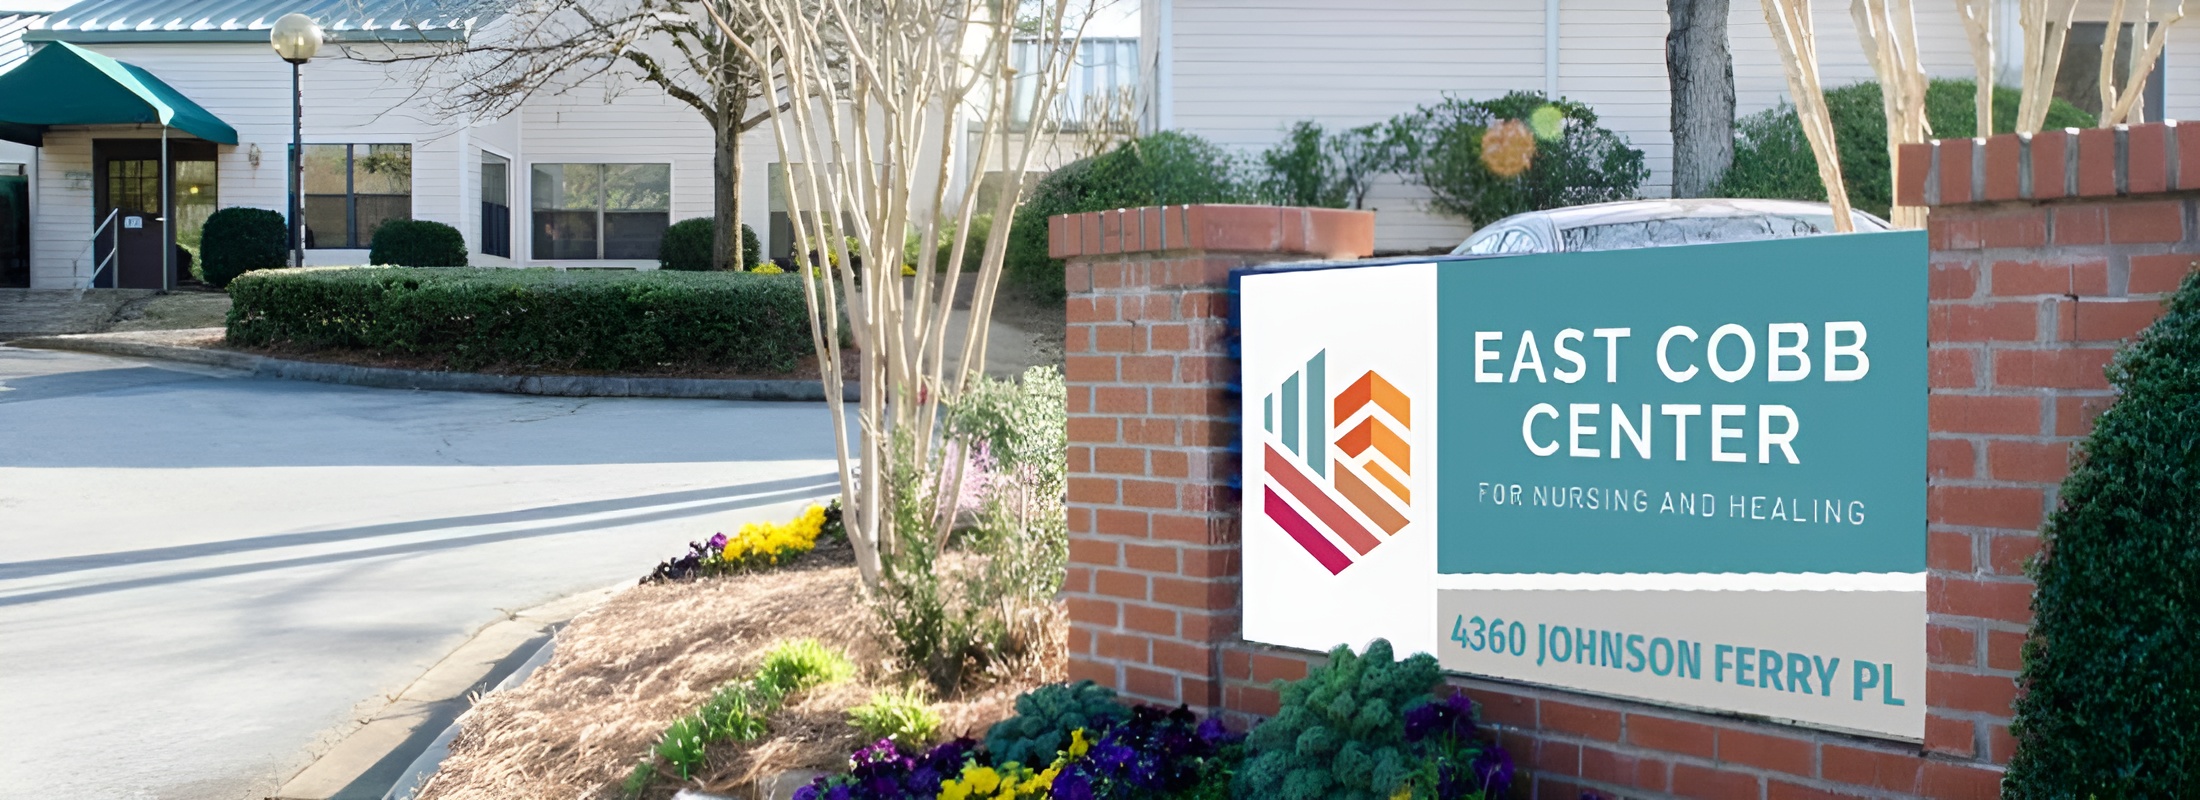
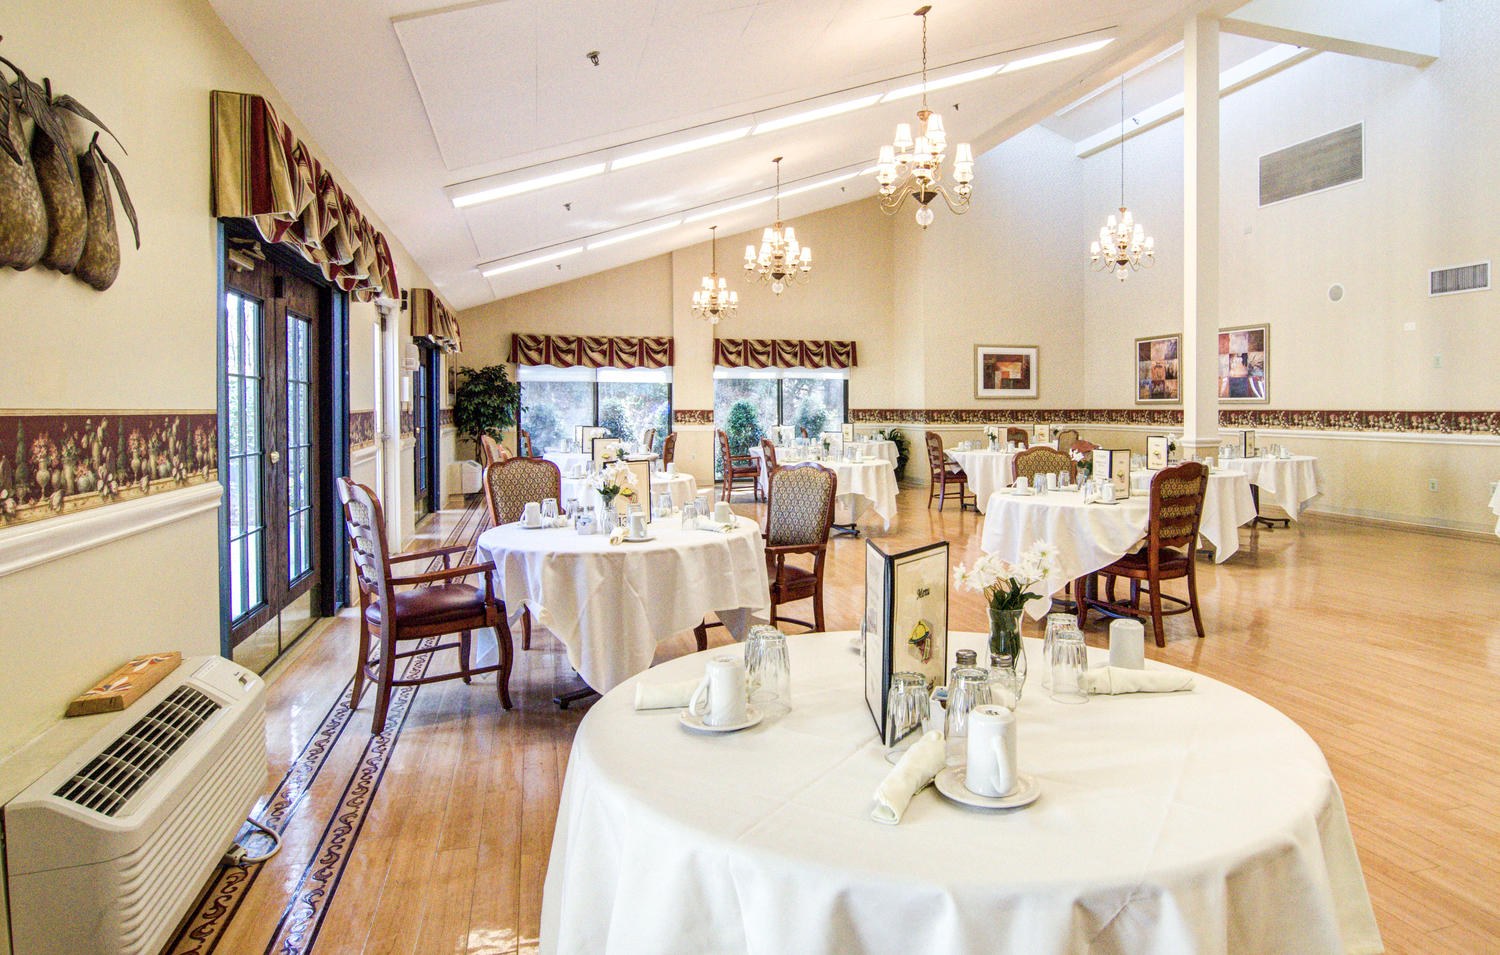
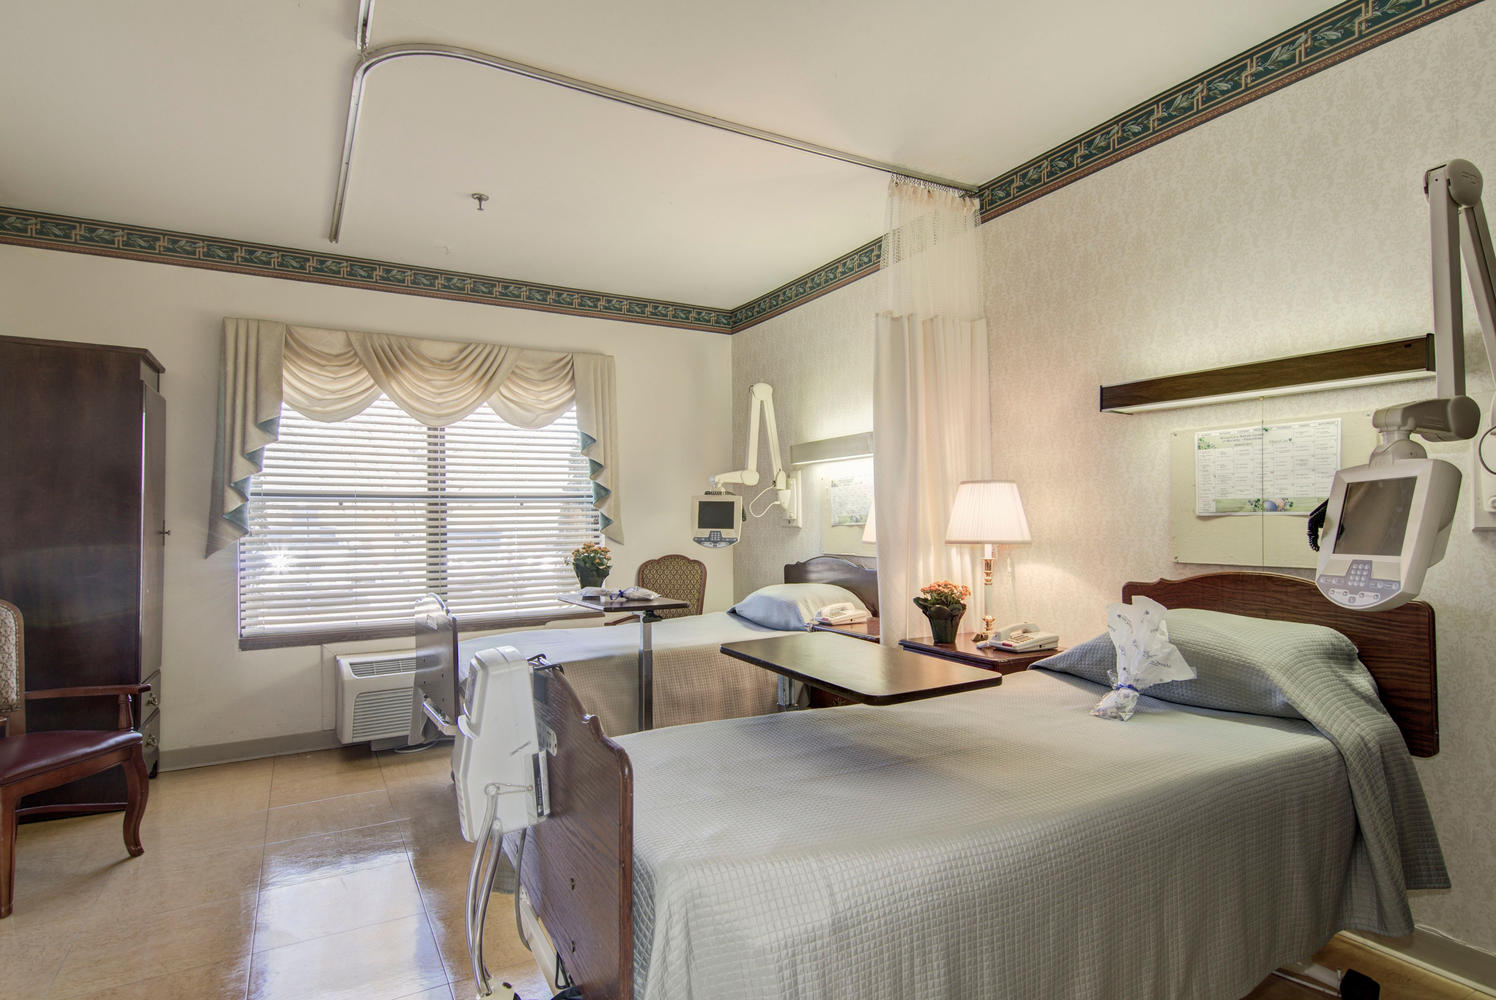
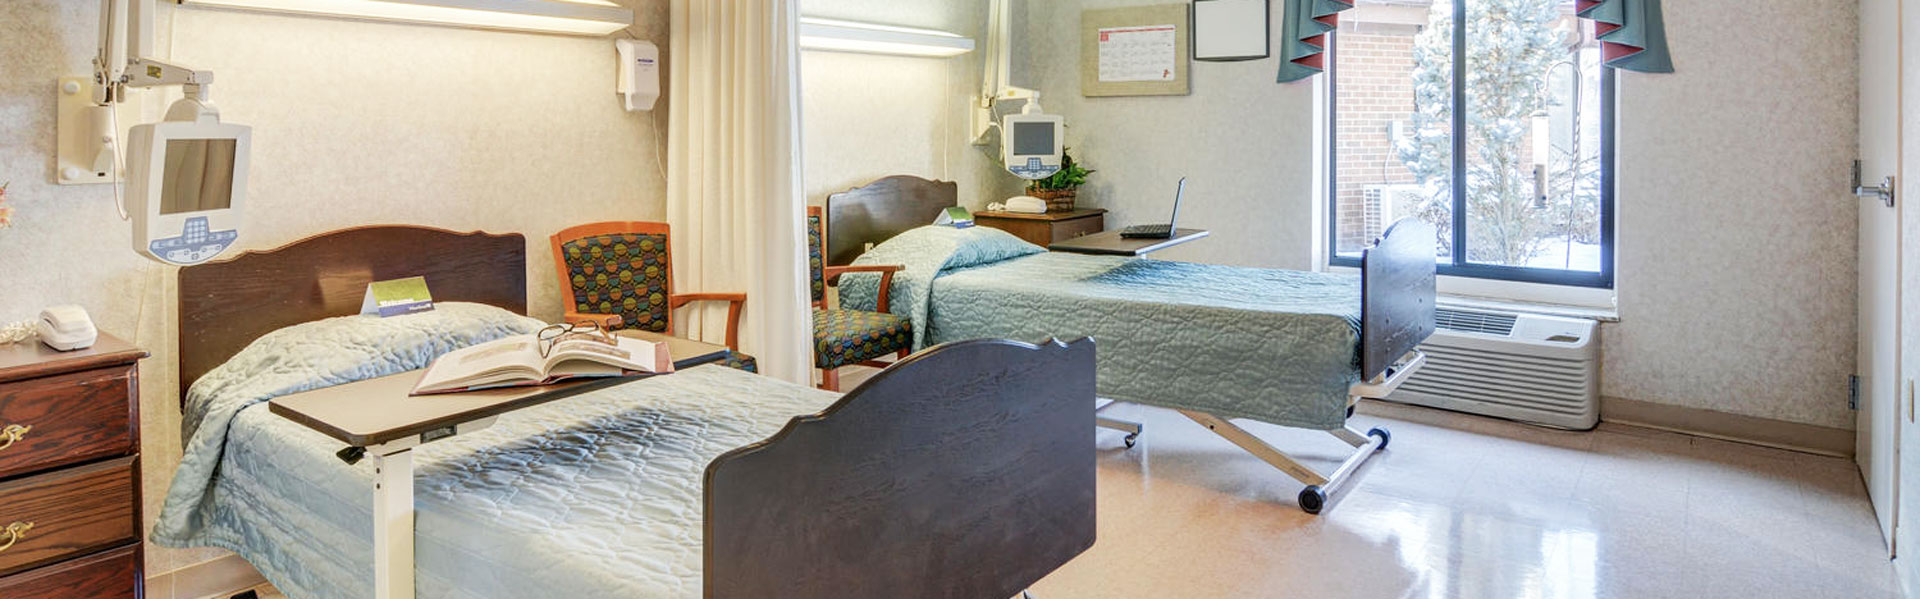

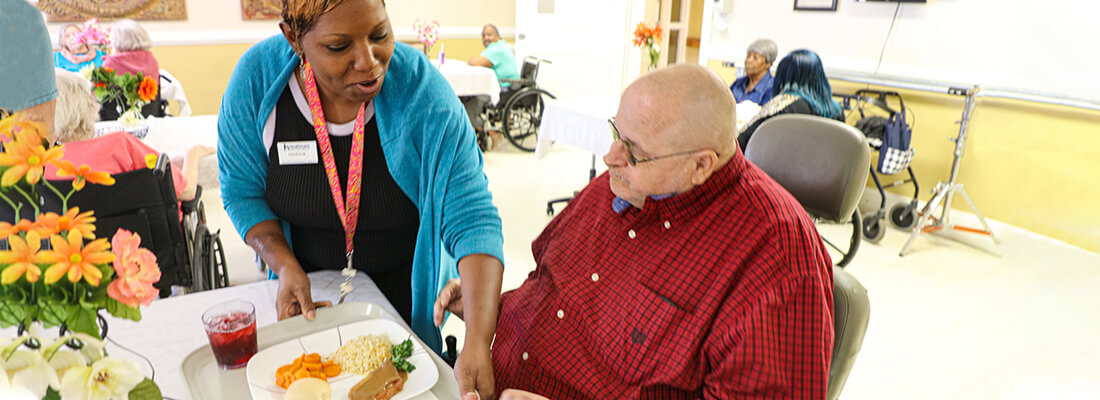

East Cobb Center for Nursing and Healing is a nursing home in Marietta, GA, offering rehabilitation, skilled nursing, and hospice care. Promoting a warm and nurturing environment, the community ensures older adults are well-cared for. Housekeeping, laundry, and well-balanced meals, along with 24-hour comprehensive medical care, are also provided to improve residents’ quality of life. The community also follows a resident-centered approach to care, ensuring residents receive the utmost attention and care based on their needs and preferences.
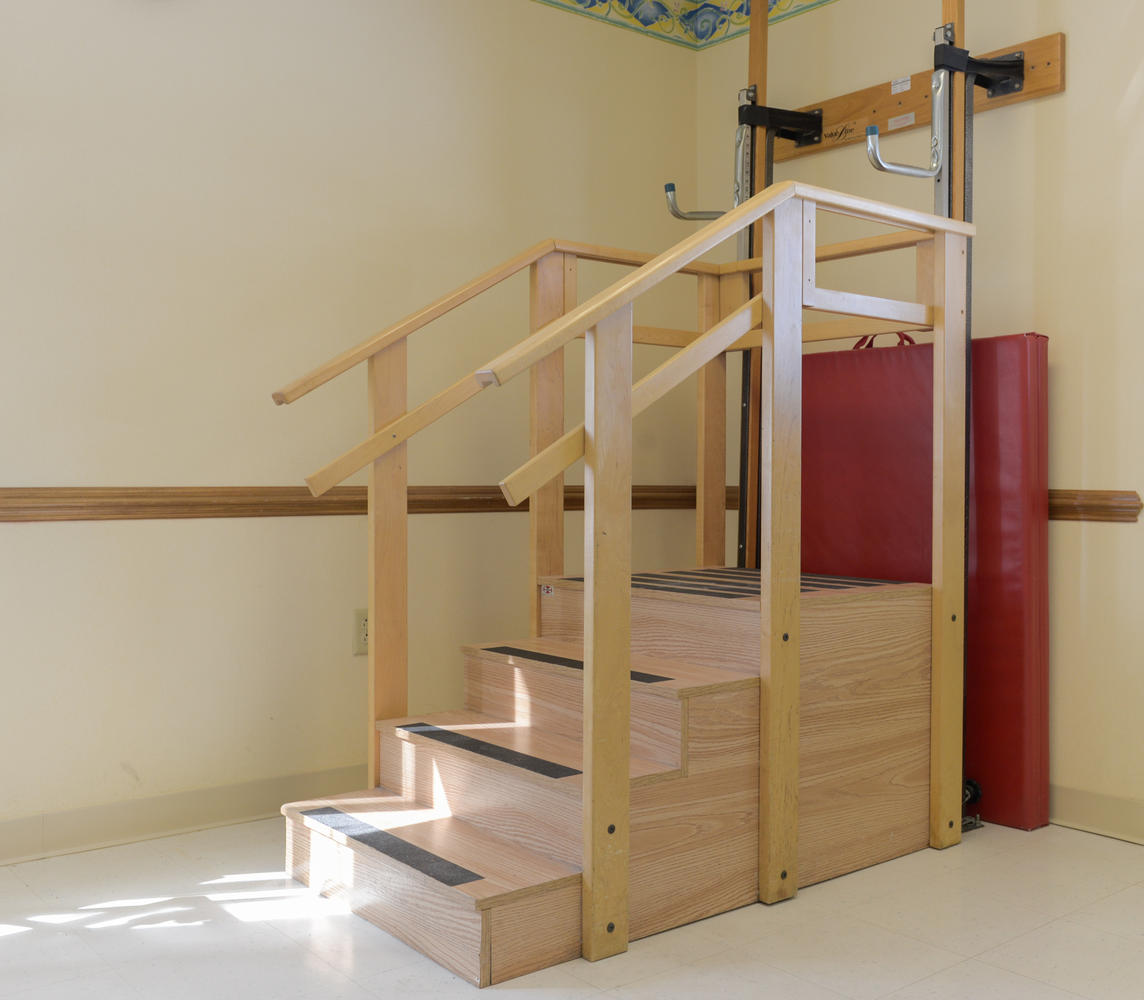
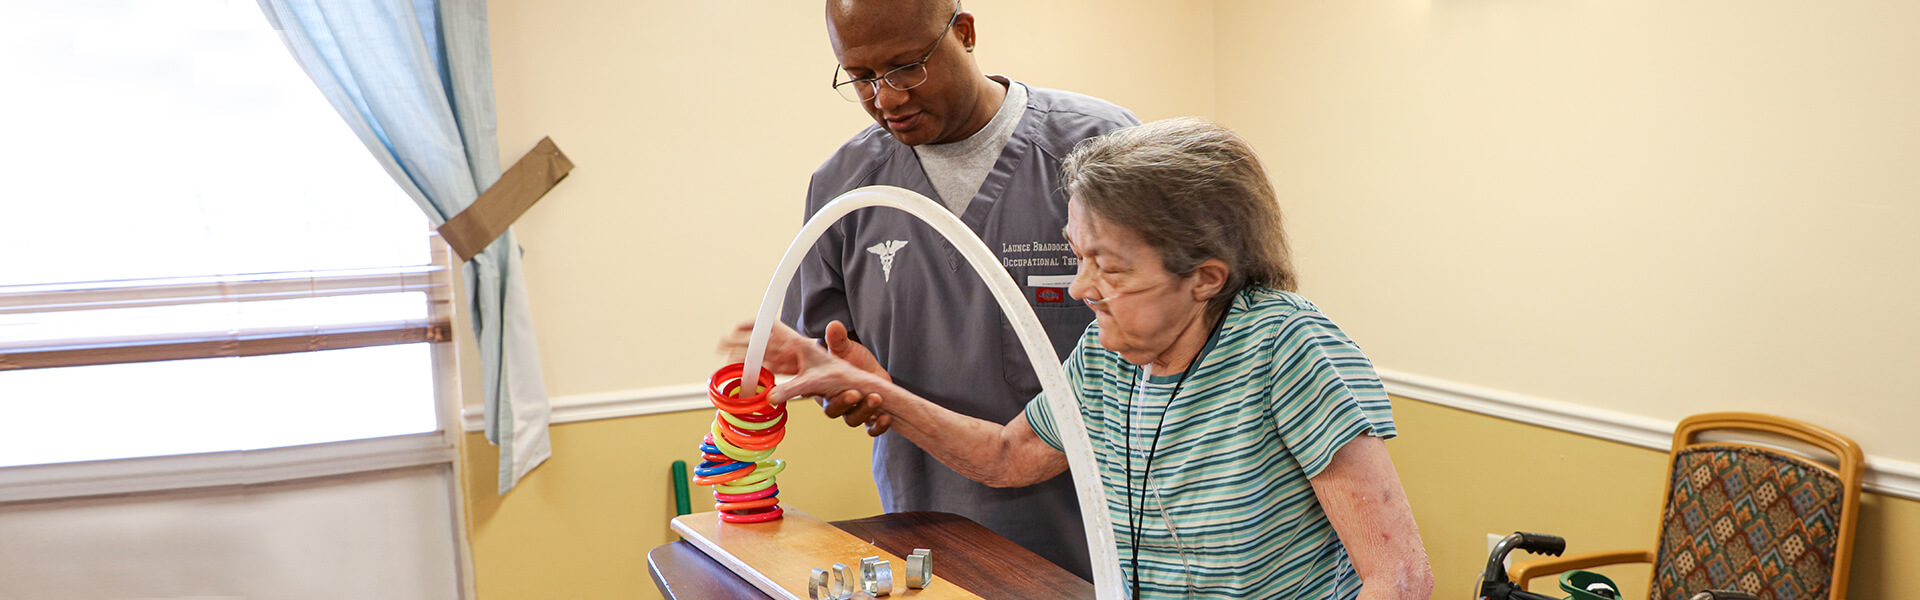
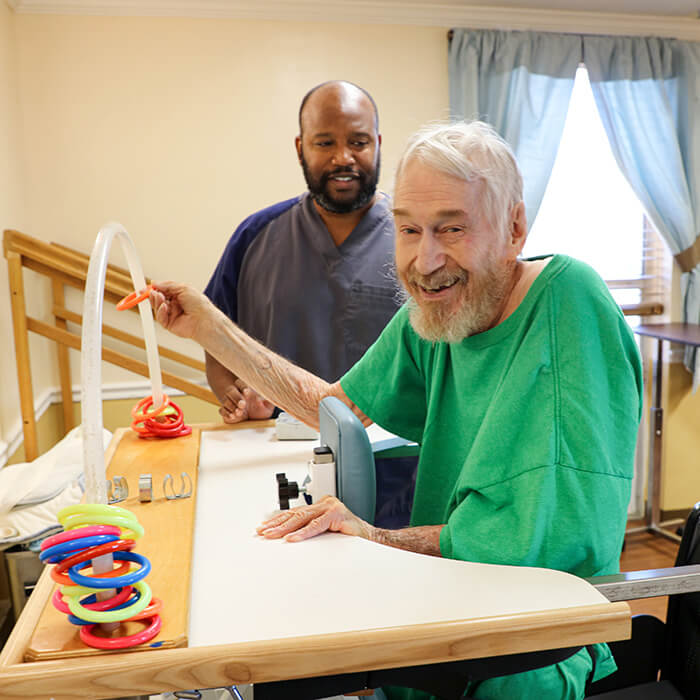
Stretching exercises, social events, and a variety of activities foster engagement and help residents stay active. Residents can also focus on their recovery and wellness with state-of-the-art rehabilitation equipment and a lively dining room. Situated along Johnson Ferry Road, near a bank, restaurants, and shops, the community guarantees quick access to necessities and leisure. As one of the trusted options for senior living in Georgia, this nursing home ensures older adults can live to their potential.
Offers a balance of services and community atmosphere.
Occupancy is moderate, suggesting balanced demand.
Residents typically stay for brief periods, with frequent admissions and discharges throughout the year.
30% of new residents, usually for short-term rehab.
67% of new residents, often for short stays.
4% of new residents, often for long-term daily care.
East Cobb Center for Nursing and Healing is administrated by Ms LINDA KARLING LOTT.
Housing Options: Private / Shared Rooms
Building Type: Single-story
Dining Services
Beauty Services
Housekeeping Services
Exercise Programs
In Georgia, the Department of Community Health, Healthcare Facility Regulation Division conducts unannounced inspections to ensure facilities adhere to state health and safety requirements.
Deficiencies indicate regulatory issues. A higher number implies the facility had several areas requiring improvement.
Georgia average: 21 deficiencies
The most recent inspection on May 8, 2024, found no deficiencies after a revisit survey verified correction of prior issues. Earlier inspections showed a pattern of deficiencies related mainly to medication management, respiratory equipment maintenance, and life safety code compliance, including expired biologicals not discarded on time and corridor doors failing to resist smoke passage. Complaint investigations were mostly unsubstantiated, though a prior substantiated complaint involved failure to provide individualized, person-centered activities for one resident requiring extensive assistance. No fines, immediate jeopardy findings, or license actions were listed in the available reports. The facility appears to have addressed previous deficiencies effectively, as recent follow-up surveys confirmed corrections.
Georgia average 3.4
Last Health inspection on Aug 2025
Georgia average 16.6
Georgia average 4.68
Health citations are formal notices following inspections when they fail to comply with safety and care standards.
9 of 11 citations resulted from standard inspections; and 2 of 11 came from combined inspections (standard and complaint).
Georgia average: 0.7
Georgia average: 0.5
Data sourced from CMS Health Deficiencies reports. Citation severity codes range from A (least serious) to L (most serious). Immediate Jeopardy (J-L) citations indicate situations where the facility's noncompliance has placed residents at risk of death or serious harm.
Nursing Home Licensed facility providing 24/7 skilled nursing care for residents with complex, ongoing medical needs. Staffed by RNs, LPNs, and CNAs. Inspected and star-rated annually by CMS. Accepts Medicare (short-term rehab) and Medicaid (long-term care).
Nursing Home Licensed facility providing 24/7 skilled nursing care for residents with complex, ongoing medical needs. Staffed by RNs, LPNs, and CNAs. Inspected and star-rated annually by CMS. Accepts Medicare (short-term rehab) and Medicaid (long-term care).
Nursing Home Licensed facility providing 24/7 skilled nursing care for residents with complex, ongoing medical needs. Staffed by RNs, LPNs, and CNAs. Inspected and star-rated annually by CMS. Accepts Medicare (short-term rehab) and Medicaid (long-term care).
Nursing Home Licensed facility providing 24/7 skilled nursing care for residents with complex, ongoing medical needs. Staffed by RNs, LPNs, and CNAs. Inspected and star-rated annually by CMS. Accepts Medicare (short-term rehab) and Medicaid (long-term care).
Nursing Home Licensed facility providing 24/7 skilled nursing care for residents with complex, ongoing medical needs. Staffed by RNs, LPNs, and CNAs. Inspected and star-rated annually by CMS. Accepts Medicare (short-term rehab) and Medicaid (long-term care).
![]() 2.1 miles from city center
2.1 miles from city center
![]() 4360 Johnson Ferry Pl, Marietta, GA 30068
4360 Johnson Ferry Pl, Marietta, GA 30068
Add your location
This data corresponds to Q2 2025 and is based on CMS Payroll-Based Journal.
Georgia average ratio: 1.45:1
Georgia average: 8.3 hours
Manages medical care and health needs.
No contractors work on this role.
Assists with medical care and medications.
No contractors work on this role.
Helps with daily care and mobility.
No contractors work on this role.
Total hours from contractors
0 contractor hours this quarter
No contractor roles were reported this quarter.
| Certified Nursing Assistant | 62 | 0 | 62 | 18,884 | 91 | 100% | 8.4 |
| Licensed Practical Nurse | 31 | 0 | 31 | 11,222 | 91 | 100% | 8.8 |
| Physical Therapist | 15 | 0 | 15 | 5,178 | 91 | 100% | 8.7 |
| Registered Nurse | 18 | 0 | 18 | 2,802 | 91 | 100% | 8.1 |
| Respiratory Therapy Technician | 5 | 0 | 5 | 2,028 | 71 | 78% | 8.2 |
| Dietitian | 3 | 0 | 3 | 1,380 | 70 | 77% | 7.7 |
| Physical Therapy Aide | 6 | 0 | 6 | 1,313 | 77 | 85% | 7.5 |
| Physical Therapy Assistant | 4 | 0 | 4 | 1,277 | 75 | 82% | 7.6 |
| Speech Language Pathologist | 3 | 0 | 3 | 1,076 | 73 | 80% | 7.8 |
| Dental Services Staff | 2 | 0 | 2 | 839 | 62 | 68% | 7.8 |
| RN Director of Nursing | 5 | 0 | 5 | 782 | 76 | 84% | 6.8 |
| Mental Health Service Worker | 1 | 0 | 1 | 578 | 65 | 71% | 8.9 |
| Clinical Nurse Specialist | 8 | 0 | 8 | 525 | 61 | 67% | 7.1 |
| Occupational Therapy Aide | 1 | 0 | 1 | 493 | 61 | 67% | 8.1 |
| Qualified Social Worker | 3 | 0 | 3 | 473 | 63 | 69% | 7.1 |
| Nurse Practitioner | 1 | 0 | 1 | 456 | 57 | 63% | 8 |
| Administrator | 1 | 0 | 1 | 428 | 54 | 59% | 7.9 |
| Other Dietary Services Staff | 3 | 0 | 3 | 244 | 38 | 42% | 6.2 |
| Qualified Activities Professional | 2 | 0 | 2 | 56 | 7 | 8% | 8 |
Source: CMS Long-Term Care Facility Characteristics (Data as of Jan 2026)
Residents meet regularly to discuss policies, care quality, and activities
Organized group of residents that meets regularly to discuss facility policies, quality of life, and activities.
Data sourced from CMS Long-Term Care Facility Characteristics quarterly report. Payer mix reflects the current resident census by primary payment source.
These measures show how residents usually do over time at this home, based on health outcomes and preventive care.
Georgia average: 10.3
Georgia average: 17.4
Georgia average: 16.8%
Georgia average: 19.4%
Georgia average: 16.1%
Georgia average: 3.2%
Georgia average: 6.3%
Georgia average: 2.5%
Georgia average: 6.0%
Georgia average: 8.7%
Georgia average: 19.1%
Georgia average: 91.5%
Georgia average: 95.0%
Georgia average: 2.18
Georgia average: 1.97
Georgia average: 80.6%
Georgia average: 2.2%
Georgia average: 78.2%
Georgia average: 24.2%
Georgia average: 12.2%
Georgia average: 0.8%
Georgia average: 53.7%
Georgia average: 50.6%
Quality measures are calculated from Minimum Data Set (MDS) assessments. For most measures, lower percentages indicate better care quality.
Historical financial and operational data for East Cobb Center for Nursing and Healing based on CMS SNF Cost Reports.
Loading trend charts...
Care Cost Calculator: See Prices in Your Area
Nursing Home Data Explorer
Don’t Wait Too Long: 7 Red Flag Signs Your Parent Needs Assisted Living Now
The True Cost of Assisted Living in 2025 – And How Families Are Paying For It
Understanding Senior Living Costs: Pricing Models, Discounts & Financial Assistance

Touring a community? Use this expert-backed checklist to stay organized, ask the right questions, and find the perfect fit.
We'll send you a PDF version of the touring checklist.