East Neck Nursing & Rehabilitation Center
Nursing Home, Hospice Care & Palliative Care · West Babylon, NY
CMS overall rating Info CMS (the Centers for Medicare & Medicaid Services) is the federal agency that rates nursing home quality. Its Overall Rating runs from 1 to 5 stars, combining health inspections, staffing, and quality measures, with inspections weighted most heavily.

East Neck Nursing & Rehabilitation Center

Nursing Home, Hospice Care & Palliative Care · West Babylon, NY
CMS overall rating Info CMS (the Centers for Medicare & Medicaid Services) is the federal agency that rates nursing home quality. Its Overall Rating runs from 1 to 5 stars, combining health inspections, staffing, and quality measures, with inspections weighted most heavily.
Calculator: See prices in your area
East Neck Nursing & Rehabilitation Center accepts Medicare, Medicaid, and private pay.

Overview of East Neck Nursing & Rehabilitation Center

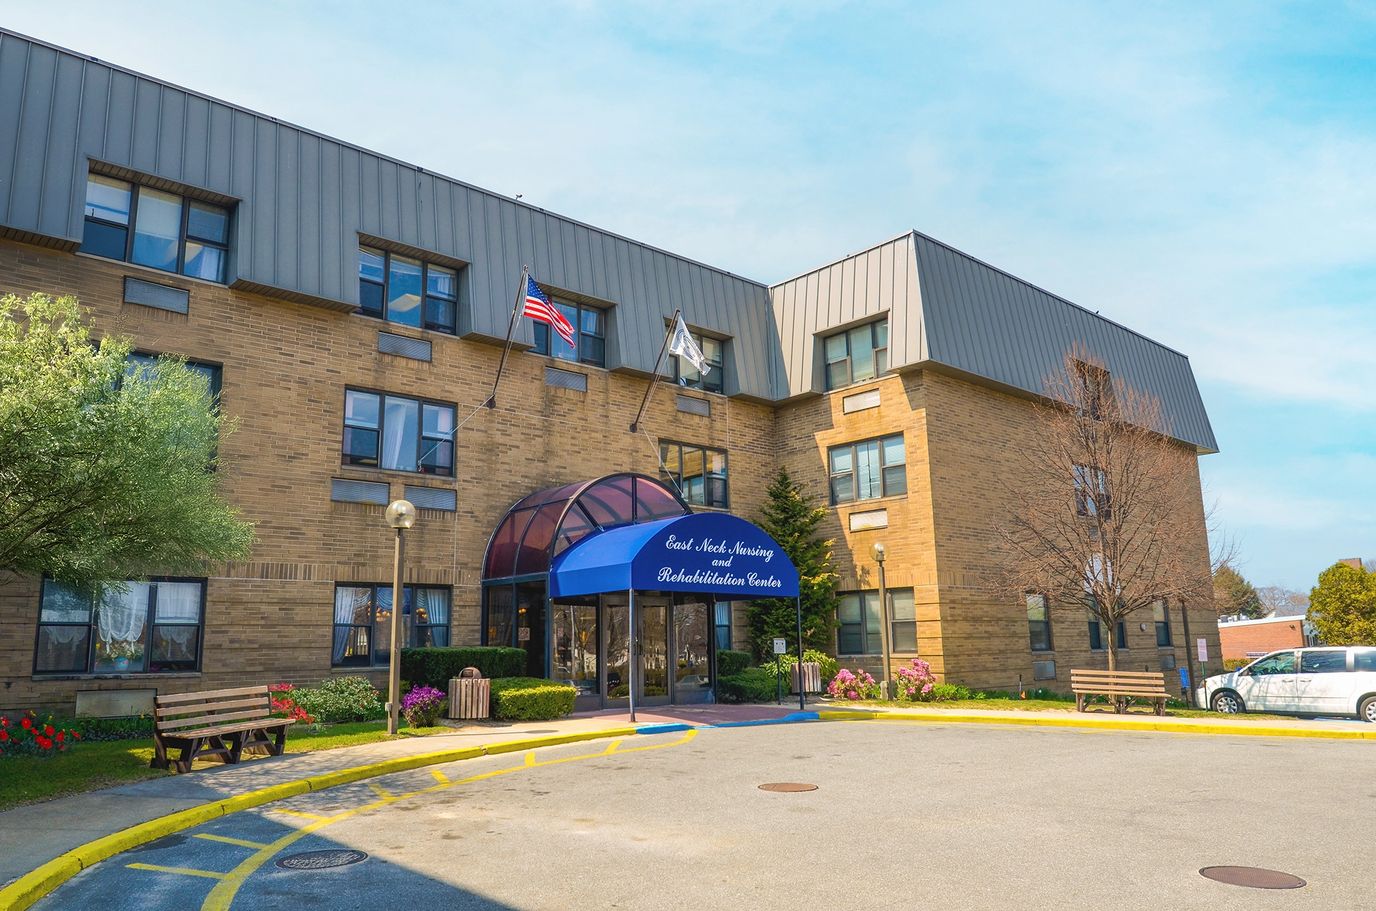
East Neck Nursing & Rehabilitation Center is a top-rated nursing home in West Babylon, NY, offering rehabilitation and skilled nursing. Here, older adults can find a home away from home, especially with a nurturing and welcoming environment. Excellent services, including 24-hour care, well-balanced meals, and transportation, are also provided to enrich residents’ living experiences. Through a holistic approach to care, residents receive the best possible care tailored to their unique needs and habits.

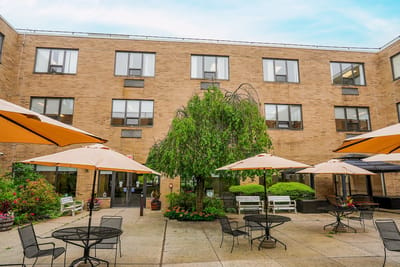
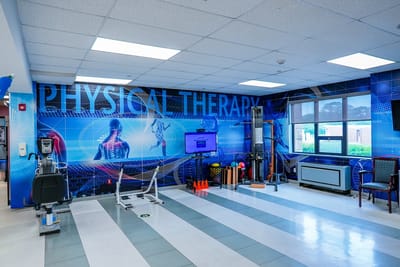
Art classes, outings, and exercise programs ensure residents can explore hobbies and gain meaningful experiences. Residents can also focus on their wellness with luxurious amenities, including the beauty parlor, barber shop, and the spacious courtyard. With restaurants, shops, a pharmacy, and public transportation in the area, residents have quick access to necessities and leisure. This nursing home is best recognized for its high-quality care, making it a great choice for senior living in New York.

(631) 422-4800

Quality ratings

Measured by Centers for Medicare & Medicaid Services (CMS)

Overall rating Info The Overall CMS Rating combines results from health inspections, staffing levels and quality measures. Health inspections carry the most weight. Staffing and quality scores can increase or decrease the final rating based on performance compared to state and national standards.
▼ 2.4% Below NY avg. ▼ 2.4% Below NY avg.NY average: 3.1Click the badge to see the full State ranking.Click here to see the full State ranking.
Health Inspection Info Based on the results of the facility's three most recent standard inspections and any complaint investigations. CMS reviews the number, scope, and severity of deficiencies, with more recent findings weighted more heavily.
▼ 29.3% Below NY avg. ▼ 29.3% Below NY avg.NY average: 2.8Click the badge to see the full State ranking.Click here to see the full State ranking.
Staffing Info Measures average nursing staff hours per resident per day, including Registered Nurses (RNs) and total nursing staff. Ratings are adjusted based on the level of care residents require and are compared to state and national benchmarks.
▲ 10.4% Above NY avg. ▲ 10.4% Above NY avg.NY average: 2.7Click the badge to see the full State ranking.Click here to see the full State ranking.
Quality Measures Info Based on clinical and physical health indicators reported to CMS, such as hospital readmissions, falls, pressure ulcers, and improvements in mobility. These measures reflect how well residents' health needs are being managed.
▲ 30.9% Above NY avg. ▲ 30.9% Above NY avg.NY average: 3.8Click the badge to see the full State ranking.Click here to see the full State ranking.

Staffing hours breakdown

Info Daily nursing hours per resident by staff type, reported to CMS. Higher is generally better — compare this facility to state and national averages to see where staffing stands.

Hours per resident per day — compared to New York state averages

Total nursing care / resident Info This home is ranked 322nd out of 407 homes in New York for nurse hours. Total adjusted nursing hours per resident per day, combining RN, LPN, and aide time. CMS adjusts this for case-mix so facilities can be fairly compared.
2h 48m per day
Rank #322 / 407Nurse hours — State benchmarkedThis home is ranked 322nd out of 407 homes in New York. Shows adjusted nurse hours per resident per day benchmarked to the New York average, with a ranking across 407 New York facilities. More hours mean more direct care. The national average is about 3.5 hrs; below 3.0 is a red flag.Ranking totals vary by category as each rank only includes facilities that report data for that metric. Homes missing that data point aren't included in the ranking.Click the rank badge to see the full State ranking.Click here to see the full State ranking.
This facility New York avg (3h 35m per day)
vs New York avg
-22%

4 of 6 metrics below state avg

Standout metric Weekend RN is +98% above state avg
Staff typeHours / Day / Residentvs state avg
Registered Nurse (RN) Info RNs hold the highest nursing license and can assess residents, interpret test results, and direct care plans. More RN hours per day often signals stronger clinical oversight and faster response to health changes. 1h 10m per day ▲ 67% State avg: 42m per day · National avg: 41m per day
LPN / LVN Info Licensed Practical Nurses (LPNs) or Licensed Vocational Nurses (LVNs) deliver routine hands-on care — medication administration, wound dressing, and monitoring vital signs. They work under RN supervision and make up a large share of daily bedside care. 10m per day ▼ 78% State avg: 47m per day · National avg: 52m per day
Nurse Aide Info Certified Nurse Aides (CNAs) provide the most direct day-to-day assistance: bathing, dressing, feeding, and mobility. Nurse aide hours are typically the largest staffing category and directly affect residents' quality of life. 2h 1m per day ▼ 8% State avg: 2h 11m per day · National avg: 2h 20m per day
Weekend Total Nursing Info Combined nursing hours (RN + LPN + Nurse Aide) per resident per day on weekends. Staffing often drops on weekends — this figure reveals whether the facility maintains adequate coverage outside of weekday hours. 3h 4m per day ▼ 5% State avg: 3h 14m per day · National avg: 3h 27m per day
Physical Therapist Info Hours per resident per day provided by licensed Physical Therapists (PTs) or PT Assistants. PT services help residents recover mobility after injury or illness and are especially important for post-acute (short-stay) rehabilitation. 4m per day ▼ 41% State avg: 7m per day · National avg: 4m per day
Weekend RN Info Registered nurse hours specifically on weekends. Facilities sometimes reduce RN presence on Saturdays and Sundays — a low weekend RN figure compared to weekday hours can indicate reduced clinical oversight when most administrative staff are absent. 57m per day ▲ 98% State avg: 29m per day · National avg: 29m per day

Capacity and availability

This home usually has availability

Lower occupancy than the New York average: 88.3%
Occupancy rate
82.6% Rank #336 / 436Occupancy rate — State benchmarkedThis home is ranked 336th out of 436 homes in New York. Shows this facility's occupancy rate versus the New York average, with its Statewide rank out of 436. Higher occupancy signals strong local demand and financial stability.Ranking totals vary by category as each rank only includes facilities that report data for that metric. Homes missing that data point aren't included in the ranking.Click the rank badge to see the full State ranking.Click here to see the full State ranking.
Avg. Length of Stay
98 days
Bed community size
300-bed community Rank #63 / 748Bed count — State benchmarkedThis home is ranked 63rd out of 748 homes in New York. Shows this facility's certified or reported bed count compared to other New York facilities. Larger communities may offer more amenities, programs, and on-site services for residents and families.Ranking totals vary by category as each rank only includes facilities that report data for that metric. Homes missing that data point aren't included in the ranking.Click the rank badge to see the full State ranking.Click here to see the full State ranking.
A large-scale community that may provide a wide range of amenities, services, and structured programs.
Walk Score
Walk Score: 24 / 100 Rank #1005 / 1173Walk Score — State benchmarkedThis home is ranked 1005th out of 1173 homes in New York. Shows how walkable this facility's neighborhood is compared to the average Walk Score across New York facilities. Higher scores benefit residents, families, and staff.Ranking totals vary by category as each rank only includes facilities that report data for that metric. Homes missing that data point aren't included in the ranking.Click the rank badge to see the full State ranking.Click here to see the full State ranking.
Car-dependent. Most errands require a car, with limited nearby walkable options.

About this community

Contact East Neck Nursing & Rehabilitation Center

Staffing Data

Reporting period: October 1 – December 31, 2025 (Q4 2025). Source: CMS Payroll-Based Journal report.

Total staff 354
Employees 279
Contractors 75
Staff to resident ratio 1.38 : 1
686% more staff per resident than New York average
New York average ratio: 0.18 : 1 New York average ratio: 0.18 : 1See full New York ranking
Avg staff/day 158
Average shift 7.7 hours
0% compared with New York average
New York average: 7.7 hours New York average shift: 7.7 hoursSee full New York ranking
Total staff hours (quarter) 111,754

Nursing staff breakdown

Q4 2025 · Oct 1 – Dec 31 More info This data comes from the CMS Payroll-Based Journal report covering October 1 – December 31, 2025.
Registered Nurse

Manages medical care and health needs.

RN Staff Info 76 total: 62 full-time employees and 14 contractors. 76
Average shift length Info Average shift length. Calculated as total hours divided by days worked and average staff per day. 9.5 hours
Licensed Practical Nurse

Assists with medical care and medications.

LPN Staff Info 12 total: 11 full-time employees and 1 contractor. 12
Average shift length Info Average shift length. Calculated as total hours divided by days worked and average staff per day. 9.7 hours
Certified Nursing Assistant

Helps with daily care and mobility.

CNA Staff Info 145 total: 139 full-time employees and 6 contractors. 145
Average shift length Info Average shift length. Calculated as total hours divided by days worked and average staff per day. 7.2 hours

Contractor staffing

Q4 2025 · Oct 1 – Dec 31 More info This data comes from the CMS Payroll-Based Journal report covering October 1 – December 31, 2025.

Total hours from contractors

16.3%

18,242 contractor hours this quarter

Registered Nurse: 14 Other Physician: 11 Physical Therapy Aide: 9 Certified Nursing Assistant: 6 Physical Therapy Assistant: 6 Speech Language Pathologist: 6 Respiratory Therapy Technician: 6 Feeding Assistant: 5 Qualified Social Worker: 5 Diagnostic X-ray Services Staff: 2 Physician Assistant: 2 Clinical Nurse Specialist: 1 Licensed Practical Nurse: 1 Medical Director: 1

Staff by category

Q4 2025 · Oct 1 – Dec 31 More info This data comes from the CMS Payroll-Based Journal report covering October 1 – December 31, 2025.
Certified Nursing Assistant139614549,16692100%7.2
Registered Nurse62147625,05092100%9.5
Physical Therapist3803812,87692100%7.5
Licensed Practical Nurse111124,10392100%9.7
Clinical Nurse Specialist7183,1306773%7.5
Physical Therapy Aide0992,9458289%7.9
Other Dietary Services Staff8082,53592100%7.2
Speech Language Pathologist0662,0057885%7.9
Respiratory Therapy Technician0661,6147986%7.5
Physical Therapy Assistant0661,5827986%7.5
Mental Health Service Worker4041,5546470%7.5
Occupational Therapy Aide3031,0386672%6.6
Therapeutic Recreation Specialist2028696368%7.3
Other Physician011117346672%3.4
Qualified Social Worker0554936672%6.8
Administrator1014656267%7.5
Dietitian1014205661%7.5
Feeding Assistant0554096672%4.2
Nurse Practitioner3033985358%7.5
Diagnostic X-ray Services Staff0222324549%4
Physician Assistant0221305257%2
Medical Director011844%2
145 Certified Nursing Assistant
% of Days 100%
76 Registered Nurse
% of Days 100%
38 Physical Therapist
% of Days 100%
12 Licensed Practical Nurse
% of Days 100%
8 Clinical Nurse Specialist
% of Days 73%
9 Physical Therapy Aide
% of Days 89%
8 Other Dietary Services Staff
% of Days 100%
6 Speech Language Pathologist
% of Days 85%
6 Respiratory Therapy Technician
% of Days 86%
6 Physical Therapy Assistant
% of Days 86%
4 Mental Health Service Worker
% of Days 70%
3 Occupational Therapy Aide
% of Days 72%
2 Therapeutic Recreation Specialist
% of Days 68%
11 Other Physician
% of Days 72%
5 Qualified Social Worker
% of Days 72%
1 Administrator
% of Days 67%
1 Dietitian
% of Days 61%
5 Feeding Assistant
% of Days 72%
3 Nurse Practitioner
% of Days 58%
2 Diagnostic X-ray Services Staff
% of Days 49%
2 Physician Assistant
% of Days 57%
1 Medical Director
% of Days 4%

Penalties and fines

Federal penalties imposed by CMS for regulatory violations, including civil money penalties (fines) and denials of payment for new Medicare/Medicaid admissions.

Source: CMS Penalties Database

No penalties in the past 3 years

No civil money penalties or payment denials were reported in the last 3 years.

Quality of care over time

These measures show how residents usually do over time at this home, based on health outcomes and preventive care.

High-risk clinical events score Info A composite score based on pressure ulcers, falls with injury, weight loss, walking ability decline, and activities of daily living decline. 6.9
30% better than New York average

New York average: 9.8

Functional decline score Info A composite score based on activities of daily living decline, walking ability decline, and incontinence. 14.0
23% better than New York average

New York average: 18.1

Long-stay resident measures
Need for Help with Daily Activities Increased Info Percent of long-stay residents whose need for help with daily activities has increased 9.7%
41% better than New York average

New York average: 16.4%

Walking Ability Worsened Info Percent of long-stay residents whose ability to move independently worsened 6.5%
61% better than New York average

New York average: 16.6%

Low Risk Residents with Bowel/Bladder Incontinence Info Percent of low risk long-stay residents who lose control of their bowels or bladder 25.7%
20% worse than New York average

New York average: 21.4%

Falls with Major Injury Info Percent of long-stay residents experiencing one or more falls with major injury 3.4%
13% worse than New York average

New York average: 3.0%

High Risk Residents with Pressure Ulcers Info Percent of long-stay high risk residents with pressure ulcers 4.7%
34% better than New York average

New York average: 7.2%

Urinary Tract Infection Info Percent of long-stay residents with a urinary tract infection 0.1%
91% better than New York average

New York average: 1.4%

Lost Too Much Weight Info Percent of long-stay residents who lose too much weight 10.3%
69% worse than New York average

New York average: 6.1%

Depressive Symptoms Info Percent of long-stay residents who have depressive symptoms 38.9%
115% worse than New York average

New York average: 18.1%

Antipsychotic Use Info Percent of long-stay residents who received an antipsychotic medication 14.7%
17% worse than New York average

New York average: 12.6%

Pneumococcal Vaccine Info Percent of long-stay residents assessed and appropriately given the pneumococcal vaccine 99.9%
9% better than New York average

New York average: 91.4%

Influenza Vaccine Info Percent of long-stay residents assessed and appropriately given the seasonal influenza vaccine 94.0%
In line with New York average

New York average: 95.2%

Short-stay resident measures
Pneumococcal Vaccine Info Percent of short-stay residents assessed and appropriately given the pneumococcal vaccine 96.5%
26% better than New York average

New York average: 76.6%

Antipsychotic medication increase Info Percent of short-stay residents who newly received an antipsychotic medication 0.6%
56% better than New York average

New York average: 1.3%

Influenza Vaccine Info Percent of short-stay residents assessed and appropriately given the seasonal influenza vaccine 83.2%
6% better than New York average

New York average: 78.8%

Breakdown by payment type

Medicare

55% of new residents, usually for short-term rehab.

Typical stay 1 - 2 months

Private pay

39% of new residents, often for short stays.

Typical stay 1 - 2 months

Medicaid

6% of new residents, often for long-term daily care.

Typical stay 3 years

Facility Characteristics

Source: CMS Long-Term Care Facility Characteristics (Data as of Jan 2026)

Total residents 257
Medicare
78
30.4% of residents
Medicaid
169
65.8% of residents
Private pay or other
10
3.9% of residents
Programs & Services
Residents Group

Residents meet regularly to discuss policies, care quality, and activities

Family Member Group

Family members meet regularly to discuss policies, care quality, and activities

Active Family Council

Organized group of family members that meets regularly to discuss facility policies, resident care, and activities.

Active Resident Council

Organized group of residents that meets regularly to discuss facility policies, quality of life, and activities.

Finances and operations

Based on CMS SNF Cost Report for fiscal year ending in 12/2023.

Privately-owned community
Operated by a single business entity.
Net patient revenue Info Net patient revenue — what the home actually collects for resident care, after contractual allowances, bad debt and discounts are subtracted from its gross charges (CMS cost report, Worksheet G-3). It covers resident care only; money the home earns from other sources is shown separately as "Other income."
$39.7M
Net patient income Info Net patient income: net patient revenue minus the home's total operating expenses. A positive figure means it earns more from resident care than it spends to deliver it; a negative figure means the opposite. It excludes non-operating "other income."
$2.8M
Privately-owned community Operated by a single business entity.
Net patient revenue Info Net patient revenue — what the home actually collects for resident care, after contractual allowances, bad debt and discounts are subtracted from its gross charges (CMS cost report, Worksheet G-3). It covers resident care only; money the home earns from other sources is shown separately as "Other income."
$39.7M Rank #100 / 403Revenue — State benchmarkedThis home is ranked 100th out of 403 homes in New York. Shows this facility's annual revenue compared to the New York average. Higher revenue generally means more resources for staffing and capital — read alongside Payroll %.Ranking totals vary by category as each rank only includes facilities that report data for that metric. Homes missing that data point aren't included in the ranking.Click the rank badge to see the full State ranking.Click here to see the full State ranking.
Net patient income Info Net patient income: net patient revenue minus the home's total operating expenses. A positive figure means it earns more from resident care than it spends to deliver it; a negative figure means the opposite. It excludes non-operating "other income."
$2.8M
Other income Info Money the home earns outside of resident care — such as investments, grants, rentals and other non-operating sources (CMS cost report, Worksheet G-3). It is tracked separately from net patient revenue: it is not part of that figure, and it is not included in net patient income.
$529.9K
Payroll costs Info Staff salaries plus wage-related costs — benefits such as payroll taxes, health insurance and retirement — from the home's own accounting records (CMS cost report, Worksheet A). Contract or agency labor is counted separately, under other operating costs. Rank #103 / 403Payroll — State benchmarkedThis home is ranked 103rd out of 403 homes in New York. Shows total annual staff payroll benchmarked to the New York average. Higher payroll investment relative to peers often signals better staffing and less reliance on cheaper contract labor.Ranking totals vary by category as each rank only includes facilities that report data for that metric. Homes missing that data point aren't included in the ranking.Click the rank badge to see the full State ranking.Click here to see the full State ranking.
$17.9M 45% of net patient revenue Info Payroll as a share of revenue: staff salaries and wage-related benefits divided by net patient revenue. A higher figure means more of each revenue dollar goes to staff pay. Rank #208 / 403Payroll % — State benchmarkedThis home is ranked 208th out of 403 homes in New York. Shows payroll as a percentage of revenue versus the New York average. Well-run New York facilities typically land around 53–65% — the top third Statewide. Below 25% may signal understaffing or heavy agency use — read with Staffing ratings.Ranking totals vary by category as each rank only includes facilities that report data for that metric. Homes missing that data point aren't included in the ranking.Click the rank badge to see the full State ranking.Click here to see the full State ranking.
Other operating costs Info Everything it costs to run the home apart from payroll — food, utilities, supplies, maintenance, contract labor and administration. Calculated as total operating expense minus payroll (staff salaries and wage-related benefits).
$19.1M
Total costs Info The home's total operating expense for the year — all the costs of running it, salaries included (CMS cost report, Worksheet G-3).
$37.0M

What does this home offer?

Housing options icon

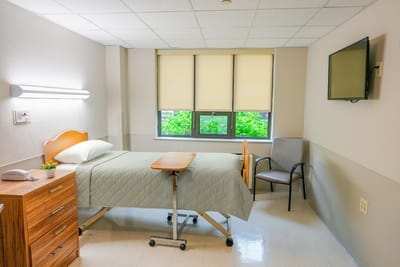
Housing Options: Private / Semi-Private Rooms

Building type icon
Building type icon

Building Type: 3-story

Beauty services icon

Beauty Services

Transportation services icon

Transportation Services

Rehabilitative support icon

Rehabilitative Support

On-site medical care and health services icon

On-site Medical Care and Health Services

Who this home usually serves

TYPE OF STAY

Mostly short-term rehab stays

Most residents typically stay for a few weeks or months before returning home or moving on.

Most new residents arrive under Medicare (55% of admissions), and a typical Medicare stay runs around 1 - 2 months.

Admissions
911 total

Coverage residents most often arrive under.

Medicare 55%
Private pay 39%
Medicaid 6%
Discharges
922 total

Coverage residents most often leave under.

Medicare 45%
Private pay 37%
Medicaid 19%

Places of interest near East Neck Nursing & Rehabilitation Center

Address 2.1 miles from city center Info Estimated distance in miles from West Babylon's city center to East Neck Nursing & Rehabilitation Center's address, calculated via Google Maps.

Calculate Travel Distance to East Neck Nursing & Rehabilitation Center

Add your location

Address

Compare Nursing Home around West Babylon

The information below is reported by the New York State Department of Health.

2 facilities compared · CMS & NY Dept. of Health data

Berkshire Nursing and Rehabilitation Center
NH
MC
PC
W Babylon
175
Facility 175
NY AVG 160
Rank #277 / 748
90.3%
Facility 90.3%
NY AVG 88.3%
Rank #230 / 436
+2%
2.74
Facility 2.74
NY AVG 3.58
Rank #351 / 407
+7%-23%
$31.8k
Facility $31.8k
NY AVG $67.6k
Rank #355 / 415
87
Facility 87
NY AVG 83
Rank #226 / 593
8
Facility 8
NY AVG 18.5
Rank #42 / 414
2.0
Facility 2.0
NY AVG 5.1
Rank #14 / 414
2153-
46
Facility 46
NY AVG 63
Rank #815 / 1173
Susan Aschkenazi
$29.4M
Facility $29.4M
NY AVG $32.0M
Rank #126 / 403
$13.4M
Facility $13.4M
NY AVG $10.7M
Rank #167 / 403
45.5%
Facility 45.5%
NY AVG 37%
Rank #302 / 403
335083
East Neck Nursing & Rehabilitation Center
NH
HC
PC
West Babylon (Moraga)
300
Facility 300
NY AVG 160
Rank #63 / 748
82.6%
Facility 82.6%
NY AVG 88.3%
Rank #336 / 436
-6%
2.80
Facility 2.80
NY AVG 3.58
Rank #322 / 407
+70%-22%
$0
Facility $0
NY AVG $67.6k
Rank #1 / 415
-
24
Facility 24
NY AVG 18.5
Rank #310 / 414
8.0
Facility 8.0
NY AVG 5.1
Rank #363 / 414
-266-
24
Facility 24
NY AVG 63
Rank #1005 / 1173
-
$39.7M
Facility $39.7M
NY AVG $32.0M
Rank #100 / 403
$17.9M
Facility $17.9M
NY AVG $10.7M
Rank #103 / 403
45%
Facility 45%
NY AVG 37%
Rank #208 / 403
335681

Financial Assistance for
Nursing Home in New York

East Neck Nursing & Rehabilitation Center is located in West Babylon, New York.
Here are the financial assistance programs available to residents in New York.

Get Financial aid guidance

Community First Choice Option

NY Medicaid CFCO

Age 65+ or disabled
General New York resident, Medicaid- eligible, care need (not necessarily nursing home level).
Income Limits (2025) ~$2,829/month 300% FBR, individual
Asset Limits $30,182 individual, higher due to NY Medicaid expansion
NY

Higher asset limit; urban density increases demand.

Benefits
Personal care (5-7 hours/day) Respite care (240 hours/year) Home modifications ($1,500 avg.) Assistive technology ($500 avg.)

Expanded In-Home Services for the Elderly Program (EISEP)

NY EISEP

Age 60+
General New York resident, at risk of decline but not nursing home level.
Income Limits ~$2,500/month individual, varies
Asset Limits $15,000 individual
NY

Cost-sharing required above certain income; urban/rural balance.

Benefits
In-home care (3-5 hours/week) Respite (up to 10 days/year) Case management Transportation (~5 trips/month)

Senior Citizen Rent Increase Exemption (SCRIE)

NY SCRIE

Age 62+
General NYC resident, live in rent-controlled/stabilized apartment, spend >1/3 of income on rent.
Income Limits (2025) $50,000/year household
Asset Limits No strict asset cap, but income-focused eligibility.
NY

Limited to NYC’s rent-regulated units; high demand in urban areas.

Benefits
Rent freeze (e.g., covers increases of $50-$200+/month); tax credit for landlord

Senior Citizen Homeowners’ Exemption (SCHE)

NY SCHE

Age 65+
General NYC resident, own and live in a 1-3 family home, co-op, or condo.
Income Limits (2025) $58,399/year household
Asset Limits No strict asset cap, income-driven eligibility.
NY

Applies only in NYC; excludes large apartment buildings.

Benefits
Property tax reduction (5-50%, e.g., $500-$5,000/year based on income and property value)

New York Foundation for Senior Citizens (NYFSC) Home Sharing Program

NYFSC Home Sharing

Age One participant must be 60+ (host or guest)
General NYC resident, able to share living space.
Income Limits No strict limit, but targets those needing cost relief.
Asset Limits Not applicable; focus on housing need.
NY

Primarily NYC-focused; limited slots due to demand.

Benefits
Shared housing (reduces rent/living costs by 30-50%, e.g., $500-$1,000/month savings); optional light assistance between housemates

Frequently Asked Questions about East Neck Nursing & Rehabilitation Center

What neighborhood is East Neck Nursing & Rehabilitation Center in?

East Neck Nursing & Rehabilitation Center is in the Moraga neighborhood.

Is East Neck Nursing & Rehabilitation Center in a walkable area?

East Neck Nursing & Rehabilitation Center has a walk score of 24. Car-dependent. Most errands require a car, with limited nearby walkable options.

What is the occupancy rate at East Neck Nursing & Rehabilitation Center?

East Neck Nursing & Rehabilitation Center's occupancy is 82.6%.

Are there photos of East Neck Nursing & Rehabilitation Center?

Yes — there are 7 photos of East Neck Nursing & Rehabilitation Center in the photo gallery on this page.

What is the address of East Neck Nursing & Rehabilitation Center?

East Neck Nursing & Rehabilitation Center is located at 134 Great East Neck Rd, West Babylon, NY 11704.

What is the phone number of East Neck Nursing & Rehabilitation Center?

(631) 422-4800 will put you in contact with the team at East Neck Nursing & Rehabilitation Center.

Is East Neck Nursing & Rehabilitation Center Medicare or Medicaid certified?

Yes — East Neck Nursing & Rehabilitation Center is a CMS-certified provider of Medicare and Medicaid.

Guides for Better Senior Living

Care Cost Calculator: See Prices in Your Area

Nursing Home Data Explorer

Don’t Wait Too Long: 7 Red Flag Signs Your Parent Needs Assisted Living Now

The True Cost of Assisted Living in 2025 – And How Families Are Paying For It

Understanding Senior Living Costs: Pricing Models, Discounts & Financial Assistance