Eastgate Nursing & Rehabilitation Center

Nursing Home

Eastgate Nursing & Rehabilitation Center

198 Waterman Ave, East Providence, RI 02914 View Map
Nursing Home
icon
Care Cost Calculator: See Prices in Your Area Care Cost Calculator: See Prices in Your Area icon
Overview of Eastgate Nursing & Rehabilitation Center

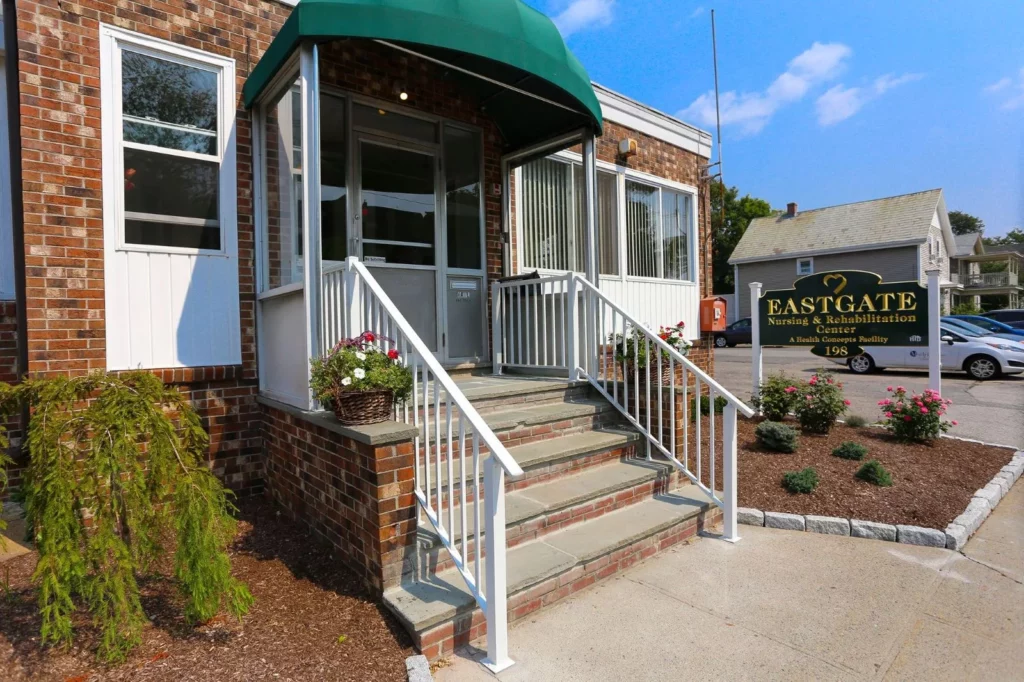
Eastgate Nursing and Rehabilitation Center is one of the trusted nursing homes in East Providence. The dedicated team of professionals approaches their service with the understanding that their residents need a sense of safety and wellness– both physically and emotionally. A rehabilitation, short-term care, and long-term nursing home, the community inspires residents to grow as better individuals through their enhanced lifestyle in a vibrant and positive environment.

Eastgate’s recovery experience is centered on skilled nursing, wellness, and therapy. Residents can feel confident knowing it is filled with safe, comfortable, and therapeutic service. Seniors are encouraged to maintain independence and individuality by staying active and engaged with social, recreational, and stimulating activities.

(401) 431-2087

Quality ratings

Measured by Centers for Medicare & Medicaid Services (CMS)

Overall rating Info Official CMS rating based on health inspections, staffing and quality measures.
4/5
Rhode Island average: 3.1/5
Health Inspection Info Official CMS rating based on deficiencies found during state health inspections.
4/5
Rhode Island average: 2.9/5
Staffing Info Official CMS rating based on nurse staffing hours per resident per day.
4/5
Rhode Island average: 3.5/5
Quality Measures Info Official CMS rating based on clinical outcomes for residents.
4/5
Rhode Island average: 3.2/5

Nursing care per resident

Info Average daily nursing hours per resident (adjusted for acuity). Higher values indicate more nursing time per resident.
3h 58m per day

This home provides 1% less nursing time per resident than the state average.

Rhode Island average: 4h 1m per day

Staffing hours breakdown

Info Hours of care per resident per day, broken down by staff type. Data from CMS Medicare.
Staff type Facility State avg National avg
Registered Nurse (RN) Info Registered nurse hours per resident per day. 43m per day 46m per day 41m per day
LPN / LVN Info Licensed Practical Nurse / Licensed Vocational Nurse hours per resident per day. 22m per day 29m per day 52m per day
Nurse Aide Info Nurse aide hours per resident per day. 2h 22m per day 2h 28m per day 2h 21m per day
Total Nursing (Weekend) Info Total number of nurse staff hours per resident per day on weekends. 3h 2m per day 3h 18m per day 3h 26m per day
Physical Therapist Info Physical therapist staff hours per resident per day. 5m per day 3m per day 4m per day
RN (Weekend) Info Registered nurse hours per resident per day on weekends. 30m per day 34m per day 29m per day

Capacity and availability

Smaller home

May offer a more intimate, personalized care environment.

Total beds 68

This home usually has limited availability

Occupancy is moderate, suggesting balanced demand.

Similar demand to the Rhode Island average
Occupancy rate 87.3%
Residents per day (avg) 62
Occupancy rate
87.3%
Residents per day (avg)
62

Who this home usually serves

TYPE OF STAY

Mix of rehab and long-term care

This home supports both short-term rehab and long-term care, with residents staying for a wide range of durations.

Breakdown by payment type

Medicare

27% of new residents, usually for short-term rehab.

Typical stay 20 days

Private pay

57% of new residents, often for short stays.

Typical stay 30 days

Medicaid

16% of new residents, often for long-term daily care.

Typical stay 10 - 11 months

Finances and operations

Proprietary home
Other
Home revenue
$11.2M
Profit
$257.3K
Proprietary home Other
Home revenue
$11,238,601.00
Profit
$257,252.00
Payroll costs Info The portion of the home's budget spent on staff, including nurses, caregivers, and other employees who support care and operations.
$3.8M
33.8% of revenue
Other operating costs Info All remaining costs needed to run the home, such as food, utilities, building maintenance, supplies and administrative expenses.
$7.2M
Total costs $11.0M
Bed community size
68-bed community
A moderately sized community that may balance personal attention with shared amenities and social activities.
Years in operation
1 year in operation
A newer community that may feature more recent facilities and programs.
Walk Score
Walk Score: 81 / 100
Very walkable. Most errands can be accomplished on foot, and many essentials are within a short walk.

About this community

License Status
Active
Facility Type
Nursing Facility
License Date
December 26, 2024
License Expiration
December 31, 2025

Additional licensing details

License number: LTC00839

Ownership & operating entity

Eastgate Nursing & Rehabilitation Center is legally operated by ALAN RICHARDS, ADMINISTRATOR.

Type Of Units

Nursing Home
68 units
Total beds
68 units

Contact Information

Fax: (401) 435-6465

Types of Care at Eastgate Nursing & Rehabilitation Center

Skilled Nursing
Contact Eastgate Nursing & Rehabilitation Center

Compare Nursing Homes around East Providence

The information below is reported by the Rhode Island Department of Health, Center for Health Facilities Regulation.
Elmwood Nursing and Rehabilitation Center
MC

Memory Care Specialized care for those with Memory Loss, Alzheimer's, or dementia, ensuring safety and support.

SNF

Nursing Homes 24/7 care needed

Providence (West End)
70
No
-
80
DELISI, KENNETH
89.8%
$9,064,044.00
$4,238,069.00
46.8%
63.20
4/5
4.2548
5/5
4/5
1/5
-
15
-
+38%
+6%
+7%
Eastgate Nursing & Rehabilitation Center
SNF

Nursing Homes 24/7 care needed

East Providence
68
No
-
81
RYAN, KEVIN
87.3%
$10,550,565.00
$3,801,507.00
36%
62.00
4/5
3.9638
4/5
4/5
4/5
-
14
-
-25%
-1%
+4%
Hattie Ide Chaffee Home
SNF

Nursing Homes 24/7 care needed

RC

Respite Care

Riverside (Riverside)
69
No
A+
36
ZELTZER, BARRY
77.8%
$8,298,492.00
$5,425,515.00
65.4%
65.70
4/5
6.2203
3/5
5/5
4/5
1
19
1
+4%
+55%
-7%
Bethany Home of Rhode Island
SNF

Nursing Homes 24/7 care needed

Providence (Wayland)
33
No
-
83
BETHANY HOME OF RHODE ISLAND
85.6%
$5,447,665.00
$3,402,355.00
62.5%
27.90
4/5
5.1516
3/5
5/5
3/5
-
16
1
0%
+28%
+2%
Linn Health & Rehabilitation
SNF

Nursing Homes 24/7 care needed

East Providence
84
No
-
74
#N/A
80.1%
$10,447,955.00
$5,876,546.00
56.2%
-
-
-
-
-
-
-
-
-
-
-
-4%

Places of interest near Eastgate Nursing & Rehabilitation Center

Address 0.9 miles from city center — 1.5 miles to nearest hospital (Butler Hospital)

Address 198 Waterman Ave, East Providence, RI 02914

Calculate Travel Distance to Eastgate Nursing & Rehabilitation Center

Add your location

Address

Staffing Data

Source: CMS Payroll-Based Journal (Q2 2025)

247
Total Staff
151
Employees
96
Contractors
25,587
Total Hours (Quarter)
40
Avg Staff/Day
7
Avg Shift (hrs)
Nursing Staff Breakdown
Role Count Avg Shift (hrs) Uses Contractors?
Registered Nurse267.8 Yes
Licensed Practical Nurse157 Yes
Certified Nursing Assistant1467.2 Yes
Staff by Category
Administration
2 staff
5.8hs shift avg
Nursing Staff
211 staff
7.2hs shift avg
Physicians & Practitioners
3 staff
6.7hs shift avg
Therapy Services
19 staff
6hs shift avg
Activities & Recreation
0 staff
0hs shift avg
Social Services
4 staff
5.9hs shift avg
Dietary Services
7 staff
7.1hs shift avg
Other Services
1 staff
8hs shift avg
Contractor Analysis
7.2%
of total hours from contractors
1,836 contractor hours this quarter
Certified Nursing Assistant: 75 Licensed Practical Nurse: 2 Medication Aide/Technician: 7 Medical Director: 1 Registered Nurse: 10 Occupational Therapy Assistant: 1
Role Employees Contractors Total Staff Total Hours Days Worked % of Days Avg Shift (hrs)
Certified Nursing Assistant717514611,43091100%7.2
Registered Nurse1610263,14891100%7.8
Licensed Practical Nurse132152,23591100%7
Medication Aide/Technician177242,08191100%6.7
Other Dietary Services Staff6068738897%6.7
Speech Language Pathologist4048376774%6.6
Physical Therapy Aide3037819099%5.4
Respiratory Therapy Technician4045886470%6.9
Clinical Nurse Specialist2025766268%6
Physical Therapy Assistant6065487684%6.2
Mental Health Service Worker1015126470%8
Dietitian1014966268%8
Administrator1014485662%8
Nurse Practitioner1014245358%8
Qualified Social Worker4044046774%5.9
Occupational Therapy Aide1011041516%6.9
Medical Director011593235%1.8
Occupational Therapy Assistant011442426%1.8

Health Inspection History

Inspections
Total health inspections 5

Rhode Island average 8.3


Last Health inspection on Nov 2024

Total health citations 14
Citations per inspection
2.8

Health citations are formal notices following inspections when they fail to comply with safety and care standards.

12 of 14 citations resulted from standard inspections; and 2 of 14 resulted from complaint investigations.

Breakdown of citation severity (last 3 years)
Critical Health citations More info 0
100% better than Rhode Island average

Rhode Island average: 1.6


Serious Health citations More info 0
100% better than Rhode Island average

Rhode Island average: 1.7

0 critical citations More info Rhode Island average: 1.6

0 serious citations More info Rhode Island average: 1.7

14 moderate citations More info Rhode Island average: 24.3

0 minor citations More info Rhode Island average: 0.5
Citations history (last 3 years)
Infection Control moderate citation Nov 21, 2024
Corrected

Nutrition moderate citation Nov 21, 2024
Corrected

Quality of Care moderate citation Nov 21, 2024
Corrected

Quality of Care moderate citation Nov 21, 2024
Corrected

Facility Characteristics

Source: CMS Long-Term Care Facility Characteristics (Data as of Jan 2026)

Ownership: For-Profit LLC
Resident Census by Payment Source
59 Total Residents
Medicare 3 (5.1%)
Medicaid 46 (78%)
Private Pay/Other 10 (16.9%)
Programs & Services
Residents' Group
Family Engagement

Active councils help families stay involved in care decisions and facility operations.

Quality of care over time

These measures show how residents usually do over time at this home, based on health outcomes and preventive care.

High-risk clinical events score Info A composite score based on pressure ulcers, falls with injury, weight loss, walking ability decline, and activities of daily living decline. 8.6
16% better than Rhode Island average

Rhode Island average: 10.3

Functional decline score Info A composite score based on activities of daily living decline, walking ability decline, and incontinence. 17.2
15% better than Rhode Island average

Rhode Island average: 20.2

Long-stay resident measures
Need for Help with Daily Activities Increased Info Percent of long-stay residents whose need for help with daily activities has increased 17.8%
9% better than Rhode Island average

Rhode Island average: 19.5%

Walking Ability Worsened Info Percent of long-stay residents whose ability to move independently worsened 15.2%
16% better than Rhode Island average

Rhode Island average: 18.2%

Low Risk Residents with Bowel/Bladder Incontinence Info Percent of low risk long-stay residents who lose control of their bowels or bladder 18.7%
18% better than Rhode Island average

Rhode Island average: 22.9%

Falls with Major Injury Info Percent of long-stay residents experiencing one or more falls with major injury 2.5%
33% better than Rhode Island average

Rhode Island average: 3.7%

High Risk Residents with Pressure Ulcers Info Percent of long-stay high risk residents with pressure ulcers 1.9%
59% better than Rhode Island average

Rhode Island average: 4.7%

Urinary Tract Infection Info Percent of long-stay residents with a urinary tract infection 1.0%
57% better than Rhode Island average

Rhode Island average: 2.3%

Lost Too Much Weight Info Percent of long-stay residents who lose too much weight 5.8%
7% worse than Rhode Island average

Rhode Island average: 5.4%

Depressive Symptoms Info Percent of long-stay residents who have depressive symptoms 2.6%
81% better than Rhode Island average

Rhode Island average: 13.5%

Antipsychotic Use Info Percent of long-stay residents who received an antipsychotic medication 20.3%
5% better than Rhode Island average

Rhode Island average: 21.5%

Pneumococcal Vaccine Info Percent of long-stay residents assessed and appropriately given the pneumococcal vaccine 100.0%
7% better than Rhode Island average

Rhode Island average: 93.1%

Influenza Vaccine Info Percent of long-stay residents assessed and appropriately given the seasonal influenza vaccine 98.1%
In line with Rhode Island average

Rhode Island average: 95.3%

Short-stay resident measures
Pneumococcal Vaccine Info Percent of short-stay residents assessed and appropriately given the pneumococcal vaccine 94.8%
24% better than Rhode Island average

Rhode Island average: 76.2%

Antipsychotic medication increase Info Percent of short-stay residents who newly received an antipsychotic medication 0.5%
78% better than Rhode Island average

Rhode Island average: 2.0%

Influenza Vaccine Info Percent of short-stay residents assessed and appropriately given the seasonal influenza vaccine 97.1%
24% better than Rhode Island average

Rhode Island average: 78.2%

Re-hospitalized after SNF stay Info Percentage of short-stay residents who were re-hospitalized after their nursing home admission. 24.6%
In line with Rhode Island average

Rhode Island average: 25.1%

Emergency department visits Info Percentage of short-stay residents who had an outpatient emergency department visit. 31.9%
102% worse than Rhode Island average

Rhode Island average: 15.8%

Falls with major injury Info Percentage of SNF residents who experience falls with major injury during their stay. 0.0%
100% better than Rhode Island average

Rhode Island average: 0.8%

Ability to care for self at discharge Info Percentage of residents at or above expected ability to care for themselves at discharge. 45.0%
16% worse than Rhode Island average

Rhode Island average: 53.7%

Successful return to home or community Info Rate of successful return to home or community from a skilled nursing facility. 57.0%
13% better than Rhode Island average

Rhode Island average: 50.6%

Guides for Better Senior Living

Care Cost Calculator: See Prices in Your Area

Nursing Home Data Explorer

Don’t Wait Too Long: 7 Red Flag Signs Your Parent Needs Assisted Living Now

The True Cost of Assisted Living in 2025 – And How Families Are Paying For It

Understanding Senior Living Costs: Pricing Models, Discounts & Financial Assistance

Financial Aid for Rhode Island Seniors

Get financial aid guidance

Rhode Island Home and Community Care Services

RI Medicaid HCCS

Age 65+ or disabled, Rhode Island resident, Medicaid-eligible, nursing home-level care need.

~$2,829/month (300% FBR, individual).

$4,000 (individual, higher than most states).

Higher asset limit; small state aids quicker processing.

Rhode Island Caregiver Support Program

RI NFCSP Respite

Caregiver of someone 60+ (or with dementia), Rhode Island resident.

No strict limit; prioritizes low-income.

Not applicable.

Limited slots; urban focus due to small size.

Program of All-Inclusive Care for the Elderly (PACE)

Rhode Island PACE

Age 55+, RI resident (specific counties), NFLOC, safe with PACE support.

~$2,829/month (Medicaid-eligible); private pay option available.

$4,000 (individual), $6,000 (couple) for Medicaid enrollees.

Operated by PACE Organization of Rhode Island; covers 4 counties (Providence, Kent, Washington, Newport).

@Home Cost Share Program

Rhode Island @Home Cost Share

Age 65+, RI resident, need help with 1+ ADL/IADL, not Medicaid-eligible.

~$1,255-$2,829/month (100%-300% FPL); sliding scale fees.

Not strictly assessed; focus on income/need.

Administered by Division of Elderly Affairs (DEA); complements Medicaid.

SSI Enhanced Assisted Living Program

Rhode Island SSI Enhanced AL

Age 65+ (or disabled), RI resident, SSI-eligible, living in approved AL facility.

$943/month (SSI federal rate) + state supplement ($332/month).

$2,000 (individual), $3,000 (couple).

Supplement increases to ~$1,275/month total for AL residents; ~50 facilities participate.

Medicare Savings Program (MSP)

Rhode Island Medicare Savings Program

Age 65+ or disabled, RI resident, Medicare Part A/B.

~$2,510/month (QMB), ~$3,380/month (SLMB), ~$3,598/month (QI)—individual.

$9,430 (individual), $14,130 (couple).

Three tiers; includes Extra Help for Part D; no waitlist.

Low-Income Home Energy Assistance Program (LIHEAP)

Rhode Island LIHEAP

Age 60+ prioritized, RI resident, low-income household.

~$3,970/month (individual, 185% FPL).

Not assessed; income-focused.

Covers gas, electric, oil; emergency aid available.

VA Aid and Attendance (A&A) and Housebound Benefits

Rhode Island VA Aid and Attendance/Housebound

Age 65+ or disabled veteran/spouse, RI resident, wartime service, need for ADL help (A&A) or homebound.

Net income < ~$1,984/month (veteran with dependent, A&A); pension offsets income.

~$155,356 (net worth limit).

High veteran demand; supports rural/urban care needs.

Senior Farmers’ Market Nutrition Program (SFMNP)

Rhode Island SFMNP

Age 60+, RI resident, low-income.

~$2,322/month (individual, 185% FPL).

Not assessed.

Vouchers (~$50/season); serves ~10,000 annually.

Property Tax Relief for Seniors

Rhode Island Property Tax Relief Credit

Age 65+ (or disabled), RI resident, homeowner/renter, low-income.

~$35,000/year (household).

Not assessed; income-focused.

Credit up to $400; local exemptions vary by municipality.

Who we are

Your Senior Care Partner, Every Step of the Way

We help families find affordable senior communities and unlock same day discounts, Medicaid, and Medicare options tailored to your needs.

Contact us Today