Eastgate Nursing & Rehabilitation Center
Nursing Home, Hospice Care, Nursing Care & Palliative Care · East Providence, RI
CMS overall rating Info CMS (the Centers for Medicare & Medicaid Services) is the federal agency that rates nursing home quality. Its Overall Rating runs from 1 to 5 stars, combining health inspections, staffing, and quality measures, with inspections weighted most heavily.

Eastgate Nursing & Rehabilitation Center

Nursing Home, Hospice Care, Nursing Care & Palliative Care · East Providence, RI
CMS overall rating Info CMS (the Centers for Medicare & Medicaid Services) is the federal agency that rates nursing home quality. Its Overall Rating runs from 1 to 5 stars, combining health inspections, staffing, and quality measures, with inspections weighted most heavily.
Calculator: See prices in your area
Eastgate Nursing & Rehabilitation Center accepts Medicare, Medicaid, and private pay.

Overview of Eastgate Nursing & Rehabilitation Center

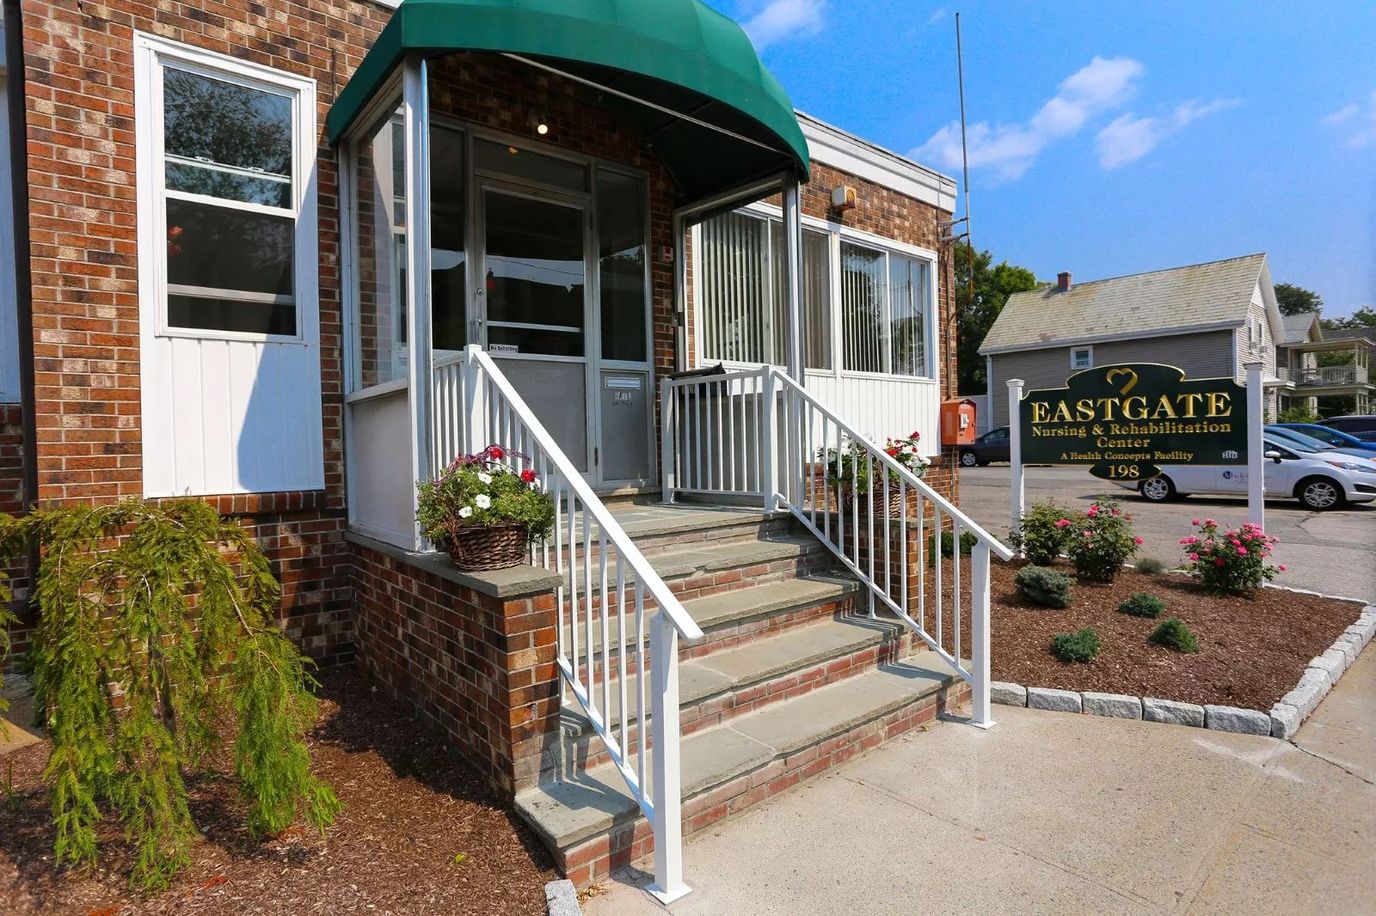
Eastgate Nursing and Rehabilitation Center is one of the trusted nursing homes in East Providence. The dedicated team of professionals approaches their service with the understanding that their residents need a sense of safety and wellness– both physically and emotionally. A rehabilitation, short-term care, and long-term nursing home, the community inspires residents to grow as better individuals through their enhanced lifestyle in a vibrant and positive environment.

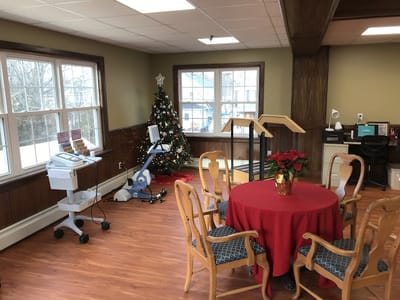
Eastgate’s recovery experience is centered on skilled nursing, wellness, and therapy. Residents can feel confident knowing it is filled with safe, comfortable, and therapeutic service. Seniors are encouraged to maintain independence and individuality by staying active and engaged with social, recreational, and stimulating activities.

(401) 431-2087

Quality ratings

Measured by Centers for Medicare & Medicaid Services (CMS)

Overall rating Info The Overall CMS Rating combines results from health inspections, staffing levels and quality measures. Health inspections carry the most weight. Staffing and quality scores can increase or decrease the final rating based on performance compared to state and national standards.
▲ 62.9% Above RI avg. ▲ 62.9% Above RI avg.RI average: 3.1Click the badge to see the full State ranking.Click here to see the full State ranking.
Health Inspection Info Based on the results of the facility's three most recent standard inspections and any complaint investigations. CMS reviews the number, scope, and severity of deficiencies, with more recent findings weighted more heavily.
▲ 72.2% Above RI avg. ▲ 72.2% Above RI avg.RI average: 2.9Click the badge to see the full State ranking.Click here to see the full State ranking.
Staffing Info Measures average nursing staff hours per resident per day, including Registered Nurses (RNs) and total nursing staff. Ratings are adjusted based on the level of care residents require and are compared to state and national benchmarks.
▲ 15.7% Above RI avg. ▲ 15.7% Above RI avg.RI average: 3.5Click the badge to see the full State ranking.Click here to see the full State ranking.
Quality Measures Info Based on clinical and physical health indicators reported to CMS, such as hospital readmissions, falls, pressure ulcers, and improvements in mobility. These measures reflect how well residents' health needs are being managed.
▲ 55.2% Above RI avg. ▲ 55.2% Above RI avg.RI average: 3.2Click the badge to see the full State ranking.Click here to see the full State ranking.

Staffing hours breakdown

Info Daily nursing hours per resident by staff type, reported to CMS. Higher is generally better — compare this facility to state and national averages to see where staffing stands.

Hours per resident per day — compared to Rhode Island state averages

Total nursing care / resident Info This home is ranked 25th out of 56 homes in Rhode Island for nurse hours. Total adjusted nursing hours per resident per day, combining RN, LPN, and aide time. CMS adjusts this for case-mix so facilities can be fairly compared.
3h 58m per day
Rank #25 / 56Nurse hours — State benchmarkedThis home is ranked 25th out of 56 homes in Rhode Island. Shows adjusted nurse hours per resident per day benchmarked to the Rhode Island average, with a ranking across 56 Rhode Island facilities. More hours mean more direct care. The national average is about 3.5 hrs; below 3.0 is a red flag.Ranking totals vary by category as each rank only includes facilities that report data for that metric. Homes missing that data point aren't included in the ranking.Click the rank badge to see the full State ranking.Click here to see the full State ranking.
This facility Rhode Island avg (4h 1m per day)
vs Rhode Island avg
-1%

4 of 6 metrics below state avg

Standout metric Physical Therapist is +38% above state avg
Staff typeHours / Day / Residentvs state avg
Registered Nurse (RN) Info RNs hold the highest nursing license and can assess residents, interpret test results, and direct care plans. More RN hours per day often signals stronger clinical oversight and faster response to health changes. 45m per day ■ Avg State avg: 46m per day · National avg: 41m per day
LPN / LVN Info Licensed Practical Nurses (LPNs) or Licensed Vocational Nurses (LVNs) deliver routine hands-on care — medication administration, wound dressing, and monitoring vital signs. They work under RN supervision and make up a large share of daily bedside care. 22m per day ▼ 23% State avg: 29m per day · National avg: 52m per day
Nurse Aide Info Certified Nurse Aides (CNAs) provide the most direct day-to-day assistance: bathing, dressing, feeding, and mobility. Nurse aide hours are typically the largest staffing category and directly affect residents' quality of life. 2h 18m per day ▼ 7% State avg: 2h 28m per day · National avg: 2h 21m per day
Weekend Total Nursing Info Combined nursing hours (RN + LPN + Nurse Aide) per resident per day on weekends. Staffing often drops on weekends — this figure reveals whether the facility maintains adequate coverage outside of weekday hours. 3h 5m per day ▼ 6% State avg: 3h 18m per day · National avg: 3h 26m per day
Physical Therapist Info Hours per resident per day provided by licensed Physical Therapists (PTs) or PT Assistants. PT services help residents recover mobility after injury or illness and are especially important for post-acute (short-stay) rehabilitation. 4m per day ▲ 38% State avg: 3m per day · National avg: 4m per day
Weekend RN Info Registered nurse hours specifically on weekends. Facilities sometimes reduce RN presence on Saturdays and Sundays — a low weekend RN figure compared to weekday hours can indicate reduced clinical oversight when most administrative staff are absent. 30m per day ▼ 12% State avg: 34m per day · National avg: 29m per day

Capacity and availability

Avg. Length of Stay
71 days
Bed community size
68-bed community Rank #82 / 109Bed count — State benchmarkedThis home is ranked 82nd out of 109 homes in Rhode Island. Shows this facility's certified or reported bed count compared to other Rhode Island facilities. Larger communities may offer more amenities, programs, and on-site services for residents and families.Ranking totals vary by category as each rank only includes facilities that report data for that metric. Homes missing that data point aren't included in the ranking.Click the rank badge to see the full State ranking.Click here to see the full State ranking.
A moderately sized community that may balance personal attention with shared amenities and social activities.
Years in operation
1 year in operation Rank #81 / 89Years in operation — State benchmarkedThis home is ranked 81st out of 89 homes in Rhode Island. Shows how long this facility has been in operation compared to other Rhode Island facilities. Longer operating histories may benefit residents, families, and staff.Ranking totals vary by category as each rank only includes facilities that report data for that metric. Homes missing that data point aren't included in the ranking.Click the rank badge to see the full State ranking.Click here to see the full State ranking.
A newer community that may feature more recent facilities and programs.
Walk Score
Walk Score: 81 / 100 Rank #15 / 118Walk Score — State benchmarkedThis home is ranked 15th out of 118 homes in Rhode Island. Shows how walkable this facility's neighborhood is compared to the average Walk Score across Rhode Island facilities. Higher scores benefit residents, families, and staff.Ranking totals vary by category as each rank only includes facilities that report data for that metric. Homes missing that data point aren't included in the ranking.Click the rank badge to see the full State ranking.Click here to see the full State ranking.
Very walkable. Most errands can be accomplished on foot, and many essentials are within a short walk.

About this community

Occupancy

Occupancy rate
87%
Rank #27 / 63Occupancy rate — State benchmarkedThis home is ranked 27th out of 63 homes in Rhode Island. Shows this facility's occupancy rate versus the Rhode Island average, with its Statewide rank out of 63. Higher occupancy signals strong local demand and financial stability.Ranking totals vary by category as each rank only includes facilities that report data for that metric. Homes missing that data point aren't included in the ranking.Click the rank badge to see the full State ranking.Click here to see the full State ranking.
Similar to the Rhode Island average: 83.7%
Occupied beds
59 / 68
Average occupied beds in Rhode Island homes 95 beds

License Details

Facility TypeNursing Facility
StatusActive
IssuanceDecember 26, 2024
ExpirationDecember 31, 2025
License NumberLTC00839

Ownership & Operating Entity

Eastgate Nursing & Rehabilitation Center is legally operated by Alan Richards, Administrator.

Type Of Units

Nursing Home
68 units
Total beds
68 units

Contact Information

Fax(401) 435-6465

Contact Eastgate Nursing & Rehabilitation Center

Inspection History

In Rhode Island, the Department of Health, Center for Health Facilities Regulation is the primary authority for inspecting, licensing, and reporting on all long-term care facilities.

Since 2022 · 4 years of data 13 deficiencies

Inspection Scorecard Info This scorecard compares key inspection, citation, and complaint metrics at this facility against the Rhode Island state average. Metrics rated ≥15% worse than average are highlighted in red; those ≥15% better are highlighted in green.

Since 2022 vs. Rhode Island state average
Overall vs. RI average 0 Worse No metrics in this bucket. 2 Better Metrics better than Rhode Island average:
• Total deficiencies (62% below)
• Deficiencies per year (61% below)
Latest Inspection November 21, 2024 Complaint Investigation

Deficiencies Info Deficiencies are formal regulatory issues recorded during state inspections.

This FacilityRI Averagevs. RI Avg
Total deficiencies Info Formal regulatory issues recorded by inspectors across all inspection types. 1334 This facility has 62% fewer total deficiencies than a typical Rhode Island nursing home (13 vs. RI avg 34).↓ 62% better
Deficiencies per year Info Average deficiencies per year since 2022. 3.38.5 This facility has 61% fewer deficiencies per year than a typical Rhode Island nursing home (3.3 vs. RI avg 8.5).↓ 61% better

Inspection Reports Summary Info An editor-reviewed summary of the themes and findings across this facility's recent inspection reports.

  • November 21, 2024 complaint inspection found six deficiencies including failure to implement person-centered care plans, improper use of mechanical lifts, respiratory care lapses, food safety violations, and infection control failures.
  • March 1, 2024 substantiated complaint documented a significant medication error where one resident received another’s medications due to improper resident identification.
  • December 1, 2023 complaint investigation found medication errors administering drugs outside blood pressure parameters and unsafe, unsanitary microwaves with rust and food buildup.

Health Inspection History

Inspections since 2022
Total health inspections 5

Rhode Island average 8.3


Last Health inspection on Nov 2024

Total health citations
14 Rank #9 / 58Health citations — State benchmarkedThis home is ranked 9th out of 58 homes in Rhode Island. Shows this facility's total health deficiency citations benchmarked to the Rhode Island State average, with a ranking across all 58 RI facilities. Lower citation counts earn a better rank.Ranking totals vary by category as each rank only includes facilities that report data for that metric. Homes missing that data point aren't included in the ranking.Click the rank badge to see the full State ranking.Click here to see the full State ranking.

Rhode Island average 28.1

Citations per inspection
2.8 Rank #9 / 58Citations per inspection — State benchmarkedThis home is ranked 9th out of 58 homes in Rhode Island. Shows average deficiency citations per CMS inspection for this facility versus the Rhode Island mean across 58 facilities with citation data. Lower is better.Ranking totals vary by category as each rank only includes facilities that report data for that metric. Homes missing that data point aren't included in the ranking.Click the rank badge to see the full State ranking.Click here to see the full State ranking.

Rhode Island average 3.48


Health citations are formal notices following inspections when they fail to comply with safety and care standards.

12 of 14 citations resulted from standard inspections; and 2 of 14 resulted from complaint investigations.

Breakdown of citation severity (last 4 years)
Critical health citations
0
100% better than Rhode Island average

Rhode Island average: 1.6


Serious health citations
0
100% better than Rhode Island average

Rhode Island average: 1.7

0 critical citations Rhode Island average: 1.6

0 serious citations Rhode Island average: 1.7

14 moderate citations Rhode Island average: 24.3

0 minor citations Rhode Island average: 0.5
Citations history (last 4 years)
Infection Control moderate citation Nov 21, 2024
Corrected

Nutrition moderate citation Nov 21, 2024
Corrected

Quality of Care moderate citation Nov 21, 2024
Corrected

Quality of Care moderate citation Nov 21, 2024
Corrected

Staffing Data

Reporting period: October 1 – December 31, 2025 (Q4 2025). Source: CMS Payroll-Based Journal report.

Total staff 231
Employees 83
Contractors 148
Staff to resident ratio 3.92 : 1
112% more staff per resident than Rhode Island average
Rhode Island average ratio: 1.85 : 1 Rhode Island average ratio: 1.85 : 1See full Rhode Island ranking
Avg staff/day 40
Average shift 7 hours
8% worse than Rhode Island average
Rhode Island average: 7.6 hours Rhode Island average shift: 7.6 hoursSee full Rhode Island ranking
Total staff hours (quarter) 25,714

Nursing staff breakdown

Q4 2025 · Oct 1 – Dec 31 More info This data comes from the CMS Payroll-Based Journal report covering October 1 – December 31, 2025.
Registered Nurse

Manages medical care and health needs.

RN Staff Info 26 total: 9 full-time employees and 17 contractors. 26
Average shift length Info Average shift length. Calculated as total hours divided by days worked and average staff per day. 7.9 hours
Licensed Practical Nurse

Assists with medical care and medications.

LPN Staff Info 11 total: 7 full-time employees and 4 contractors. 11
Average shift length Info Average shift length. Calculated as total hours divided by days worked and average staff per day. 7 hours
Certified Nursing Assistant

Helps with daily care and mobility.

CNA Staff Info 123 total: 25 full-time employees and 98 contractors. 123
Average shift length Info Average shift length. Calculated as total hours divided by days worked and average staff per day. 7.2 hours

Contractor staffing

Q4 2025 · Oct 1 – Dec 31 More info This data comes from the CMS Payroll-Based Journal report covering October 1 – December 31, 2025.

Total hours from contractors

10.8%

2,776 contractor hours this quarter

Certified Nursing Assistant: 98 Medication Aide/Technician: 26 Registered Nurse: 17 Licensed Practical Nurse: 4 Medical Director: 1 Occupational Therapy Assistant: 1 Occupational Therapy Aide: 1

Staff by category

Q4 2025 · Oct 1 – Dec 31 More info This data comes from the CMS Payroll-Based Journal report covering October 1 – December 31, 2025.
Certified Nursing Assistant259812310,99292100%7.2
Registered Nurse917262,77592100%7.9
Medication Aide/Technician1026362,19492100%6.7
Licensed Practical Nurse74112,12192100%7
Clinical Nurse Specialist3031,0506571%7
Speech Language Pathologist4049267582%6.7
Dental Services Staff2027346267%7.4
Other Dietary Services Staff4047028896%6.3
Physical Therapy Aide2026709199%5.9
Physical Therapy Assistant6065837784%5.8
Nurse Practitioner1014966267%8
Administrator1014886166%8
Mental Health Service Worker1014806065%8
Dietitian1014565762%8
Qualified Social Worker3034326975%6.3
Respiratory Therapy Technician4043975964%5.3
Occupational Therapy Aide0111181415%8.4
Medical Director011562830%2
Occupational Therapy Assistant011473033%1.6
123 Certified Nursing Assistant
% of Days 100%
26 Registered Nurse
% of Days 100%
36 Medication Aide/Technician
% of Days 100%
11 Licensed Practical Nurse
% of Days 100%
3 Clinical Nurse Specialist
% of Days 71%
4 Speech Language Pathologist
% of Days 82%
2 Dental Services Staff
% of Days 67%
4 Other Dietary Services Staff
% of Days 96%
2 Physical Therapy Aide
% of Days 99%
6 Physical Therapy Assistant
% of Days 84%
1 Nurse Practitioner
% of Days 67%
1 Administrator
% of Days 66%
1 Mental Health Service Worker
% of Days 65%
1 Dietitian
% of Days 62%
3 Qualified Social Worker
% of Days 75%
4 Respiratory Therapy Technician
% of Days 64%
1 Occupational Therapy Aide
% of Days 15%
1 Medical Director
% of Days 30%
1 Occupational Therapy Assistant
% of Days 33%

Penalties and fines

Federal penalties imposed by CMS for regulatory violations, including civil money penalties (fines) and denials of payment for new Medicare/Medicaid admissions.

Source: CMS Penalties Database

No penalties in the past 3 years

No civil money penalties or payment denials were reported in the last 3 years.

Quality of care over time

These measures show how residents usually do over time at this home, based on health outcomes and preventive care.

High-risk clinical events score Info A composite score based on pressure ulcers, falls with injury, weight loss, walking ability decline, and activities of daily living decline. 8.6
16% better than Rhode Island average

Rhode Island average: 10.3

Functional decline score Info A composite score based on activities of daily living decline, walking ability decline, and incontinence. 17.2
15% better than Rhode Island average

Rhode Island average: 20.2

Long-stay resident measures
Significantly above average Rhode Island avg: 3.2 Info CMS star rating based on long-stay quality measure performance. 5 stars = significantly above average, 1 star = significantly below average.
Need for Help with Daily Activities Increased Info Percent of long-stay residents whose need for help with daily activities has increased 17.8%
9% better than Rhode Island average

Rhode Island average: 19.5%

Walking Ability Worsened Info Percent of long-stay residents whose ability to move independently worsened 15.2%
16% better than Rhode Island average

Rhode Island average: 18.2%

Low Risk Residents with Bowel/Bladder Incontinence Info Percent of low risk long-stay residents who lose control of their bowels or bladder 18.7%
18% better than Rhode Island average

Rhode Island average: 22.9%

Falls with Major Injury Info Percent of long-stay residents experiencing one or more falls with major injury 2.5%
33% better than Rhode Island average

Rhode Island average: 3.7%

High Risk Residents with Pressure Ulcers Info Percent of long-stay high risk residents with pressure ulcers 1.9%
59% better than Rhode Island average

Rhode Island average: 4.7%

Urinary Tract Infection Info Percent of long-stay residents with a urinary tract infection 1.0%
57% better than Rhode Island average

Rhode Island average: 2.3%

Lost Too Much Weight Info Percent of long-stay residents who lose too much weight 5.8%
7% worse than Rhode Island average

Rhode Island average: 5.4%

Depressive Symptoms Info Percent of long-stay residents who have depressive symptoms 2.6%
81% better than Rhode Island average

Rhode Island average: 13.5%

Antipsychotic Use Info Percent of long-stay residents who received an antipsychotic medication 20.3%
5% better than Rhode Island average

Rhode Island average: 21.5%

Pneumococcal Vaccine Info Percent of long-stay residents assessed and appropriately given the pneumococcal vaccine 100.0%
7% better than Rhode Island average

Rhode Island average: 93.1%

Influenza Vaccine Info Percent of long-stay residents assessed and appropriately given the seasonal influenza vaccine 98.1%
In line with Rhode Island average

Rhode Island average: 95.3%

Short-stay resident measures
Above average Rhode Island avg: 2.4 Info CMS star rating based on short-stay quality measure performance. 5 stars = much above average, 1 star = much below average.
Pneumococcal Vaccine Info Percent of short-stay residents assessed and appropriately given the pneumococcal vaccine 94.8%
24% better than Rhode Island average

Rhode Island average: 76.2%

Antipsychotic medication increase Info Percent of short-stay residents who newly received an antipsychotic medication 0.5%
78% better than Rhode Island average

Rhode Island average: 2.0%

Influenza Vaccine Info Percent of short-stay residents assessed and appropriately given the seasonal influenza vaccine 97.1%
24% better than Rhode Island average

Rhode Island average: 78.2%

Re-hospitalized after SNF stay Info Percentage of short-stay residents who were re-hospitalized after their nursing home admission. 24.6%
In line with Rhode Island average

Rhode Island average: 25.1%

Emergency department visits Info Percentage of short-stay residents who had an outpatient emergency department visit. 31.9%
102% worse than Rhode Island average

Rhode Island average: 15.8%

Falls with major injury Info Percentage of SNF residents who experience falls with major injury during their stay. 0.0%
100% better than Rhode Island average

Rhode Island average: 0.8%

Ability to care for self at discharge Info Percentage of residents at or above expected ability to care for themselves at discharge. 45.0%
16% worse than Rhode Island average

Rhode Island average: 53.7%

Successful return to home or community Info Rate of successful return to home or community from a skilled nursing facility. 57.0%
13% better than Rhode Island average

Rhode Island average: 50.6%

Breakdown by payment type

Medicare

27% of new residents, usually for short-term rehab.

Typical stay 20 days

Private pay

57% of new residents, often for short stays.

Typical stay 30 days

Medicaid

16% of new residents, often for long-term daily care.

Typical stay 10 - 11 months

Facility Characteristics

Source: CMS Long-Term Care Facility Characteristics (Data as of Jan 2026)

Total residents 59
Medicare
3
5.1% of residents
Medicaid
46
78% of residents
Private pay or other
10
16.9% of residents
Programs & Services
Residents Group

Residents meet regularly to discuss policies, care quality, and activities

Active Resident Council

Organized group of residents that meets regularly to discuss facility policies, quality of life, and activities.

Finances and operations

Based on CMS SNF Cost Report for fiscal year ending in 12/2023.

Privately-owned community
Operated by a single business entity.
Net patient revenue Info Net patient revenue — what the home actually collects for resident care, after contractual allowances, bad debt and discounts are subtracted from its gross charges (CMS cost report, Worksheet G-3). It covers resident care only; money the home earns from other sources is shown separately as "Other income."
$7.6M
Net patient income Info Net patient income: net patient revenue minus the home's total operating expenses. A positive figure means it earns more from resident care than it spends to deliver it; a negative figure means the opposite. It excludes non-operating "other income."
-$430.8K
Privately-owned community Operated by a single business entity.
Net patient revenue Info Net patient revenue — what the home actually collects for resident care, after contractual allowances, bad debt and discounts are subtracted from its gross charges (CMS cost report, Worksheet G-3). It covers resident care only; money the home earns from other sources is shown separately as "Other income."
$7.6M Rank #41 / 60Revenue — State benchmarkedThis home is ranked 41st out of 60 homes in Rhode Island. Shows this facility's annual revenue compared to the Rhode Island average. Higher revenue generally means more resources for staffing and capital — read alongside Payroll %.Ranking totals vary by category as each rank only includes facilities that report data for that metric. Homes missing that data point aren't included in the ranking.Click the rank badge to see the full State ranking.Click here to see the full State ranking.
Net patient income Info Net patient income: net patient revenue minus the home's total operating expenses. A positive figure means it earns more from resident care than it spends to deliver it; a negative figure means the opposite. It excludes non-operating "other income."
-$430.8K
Other income Info Money the home earns outside of resident care — such as investments, grants, rentals and other non-operating sources (CMS cost report, Worksheet G-3). It is tracked separately from net patient revenue: it is not part of that figure, and it is not included in net patient income.
$688.0K
Payroll costs Info Staff salaries plus wage-related costs — benefits such as payroll taxes, health insurance and retirement — from the home's own accounting records (CMS cost report, Worksheet A). Contract or agency labor is counted separately, under other operating costs. Rank #48 / 60Payroll — State benchmarkedThis home is ranked 48th out of 60 homes in Rhode Island. Shows total annual staff payroll benchmarked to the Rhode Island average. Higher payroll investment relative to peers often signals better staffing and less reliance on cheaper contract labor.Ranking totals vary by category as each rank only includes facilities that report data for that metric. Homes missing that data point aren't included in the ranking.Click the rank badge to see the full State ranking.Click here to see the full State ranking.
$4.7M 62.5% of net patient revenue Info Payroll as a share of revenue: staff salaries and wage-related benefits divided by net patient revenue. A higher figure means more of each revenue dollar goes to staff pay. Rank #49 / 60Payroll % — State benchmarkedThis home is ranked 49th out of 60 homes in Rhode Island. Shows payroll as a percentage of revenue versus the Rhode Island average. Well-run Rhode Island facilities typically land around 60–70% — the top third Statewide. Below 25% may signal understaffing or heavy agency use — read with Staffing ratings.Ranking totals vary by category as each rank only includes facilities that report data for that metric. Homes missing that data point aren't included in the ranking.Click the rank badge to see the full State ranking.Click here to see the full State ranking.
Other operating costs Info Everything it costs to run the home apart from payroll — food, utilities, supplies, maintenance, contract labor and administration. Calculated as total operating expense minus payroll (staff salaries and wage-related benefits).
$3.3M
Total costs Info The home's total operating expense for the year — all the costs of running it, salaries included (CMS cost report, Worksheet G-3).
$8.0M

Who this home usually serves

TYPE OF STAY

Mix of rehab and long-term care

This home supports both short-term rehab and long-term care, with residents staying for a wide range of durations.

Most new residents arrive under private pay (57% of admissions), and a typical private pay stay runs around 30 days.

Admissions
306 total

Coverage residents most often arrive under.

Medicare 27%
Private pay 57%
Medicaid 16%
Discharges
305 total

Coverage residents most often leave under.

Medicare 29%
Private pay 59%
Medicaid 13%

Places of interest near Eastgate Nursing & Rehabilitation Center

Address 0.9 miles from city center Info Estimated distance in miles from East Providence's city center to Eastgate Nursing & Rehabilitation Center's address, calculated via Google Maps. — 1.5 miles to nearest hospital (Butler Hospital)

Calculate Travel Distance to Eastgate Nursing & Rehabilitation Center

Add your location

Address

Compare Nursing Home around East Providence

The information below is reported by the Rhode Island Department of Health, Center for Health Facilities Regulation.

5 facilities compared · CMS & RI Dept. of Health data

Eastgate Nursing & Rehabilitation Center
NH
HC
NC
PC
East Providence (Six Corners)
68
Facility 68
RI AVG 107
Rank #82 / 109
87.3%
Facility 87.3%
RI AVG 83.7%
Rank #27 / 63
+4%
3.96
Facility 3.96
RI AVG 4.01
Rank #25 / 56
-17%-1%
$0
Facility $0
RI AVG $97.5k
Rank #1 / 58
14
Facility 14
RI AVG 28.1
Rank #9 / 58
2.8
Facility 2.8
RI AVG 3.5
Rank #9 / 58
-62-
81
Facility 81
RI AVG 47
Rank #15 / 118
Kevin Ryan
$7.6M
Facility $7.6M
RI AVG $14.1M
Rank #41 / 60
$4.7M
Facility $4.7M
RI AVG $5.9M
Rank #48 / 60
62.5%
Facility 62.5%
RI AVG 43.7%
Rank #49 / 60
415083
Hattie Ide Chaffee Home
NH
HC
MC
RC
Riverside
69
Facility 69
RI AVG 107
Rank #81 / 109
98.6%
Facility 98.6%
RI AVG 83.7%
Rank #2 / 63
+18%
6.22
Facility 6.22
RI AVG 4.01
Rank #2 / 56
+19%+55%
$40.3k
Facility $40.3k
RI AVG $97.5k
Rank #32 / 58
19
Facility 19
RI AVG 28.1
Rank #16 / 58
3.2
Facility 3.2
RI AVG 3.5
Rank #22 / 58
168A+
36
Facility 36
RI AVG 47
Rank #70 / 118
Barry Zeltzer
$7.7M
Facility $7.7M
RI AVG $14.1M
Rank #49 / 60
$6.5M
Facility $6.5M
RI AVG $5.9M
Rank #41 / 60
83.9%
Facility 83.9%
RI AVG 43.7%
Rank #7 / 60
415002
Bethany Home of Rhode Island
NH
RC
Providence (Wayland)
33
Facility 33
RI AVG 107
Rank #103 / 109
81.8%
Facility 81.8%
RI AVG 83.7%
Rank #36 / 63
-2%
5.15
Facility 5.15
RI AVG 4.01
Rank #4 / 56
+4%+28%
$12.7k
Facility $12.7k
RI AVG $97.5k
Rank #22 / 58
16
Facility 16
RI AVG 28.1
Rank #12 / 58
4.0
Facility 4.0
RI AVG 3.5
Rank #37 / 58
126-
83
Facility 83
RI AVG 47
Rank #10 / 118
Bethany Home Of Rhode Island
$4.5M
Facility $4.5M
RI AVG $14.1M
Rank #57 / 60
$4.2M
Facility $4.2M
RI AVG $5.9M
Rank #53 / 60
94%
Facility 94%
RI AVG 43.7%
Rank #15 / 60
415096
Waterview Villa Rehabilitation and Health Care Center
NH
AL
HC
MC
East Providence (Ingrams Corner)
132
Facility 132
RI AVG 107
Rank #30 / 109
93.2%
Facility 93.2%
RI AVG 83.7%
Rank #14 / 63
+11%
3.23
Facility 3.23
RI AVG 4.01
Rank #50 / 56
-20%-19%
$20.6k
Facility $20.6k
RI AVG $97.5k
Rank #26 / 58
24
Facility 24
RI AVG 28.1
Rank #22 / 58
4.0
Facility 4.0
RI AVG 3.5
Rank #37 / 58
4117-
54
Facility 54
RI AVG 47
Rank #52 / 118
Athena Health Care Systems Ri LLC
$11.3M
Facility $11.3M
RI AVG $14.1M
Rank #17 / 60
$8.4M
Facility $8.4M
RI AVG $5.9M
Rank #29 / 60
74.8%
Facility 74.8%
RI AVG 43.7%
Rank #59 / 60
415042
Orchard View Manor
NH
HC
MC
NC
RC
East Providence (Riverside)
166
Facility 166
RI AVG 107
Rank #15 / 109
75.3%
Facility 75.3%
RI AVG 83.7%
Rank #51 / 63
-10%
3.79
Facility 3.79
RI AVG 4.01
Rank #33 / 56
-20%-6%
$132.7k
Facility $132.7k
RI AVG $97.5k
Rank #46 / 58
63
Facility 63
RI AVG 28.1
Rank #56 / 58
3.0
Facility 3.0
RI AVG 3.5
Rank #16 / 58
13127-
11
Facility 11
RI AVG 47
Rank #103 / 118
Morenike Adeoye Administrator
$12.8M
Facility $12.8M
RI AVG $14.1M
Rank #6 / 60
$11.5M
Facility $11.5M
RI AVG $5.9M
Rank #11 / 60
90.1%
Facility 90.1%
RI AVG 43.7%
Rank #48 / 60
415059

Financial Assistance for
Nursing Home in Rhode Island

Eastgate Nursing & Rehabilitation Center is located in East Providence, Rhode Island.
Here are the financial assistance programs available to residents in Rhode Island.

Get Financial aid guidance

Rhode Island Home and Community Care Services

RI Medicaid HCCS

Age 65+ or disabled
General Rhode Island resident, Medicaid-eligible, nursing home-level care need.
Income Limits (2025) ~$2,829/month 300% FBR, individual
Asset Limits $4,000 individual, higher than most states
RI

Higher asset limit; small state aids quicker processing.

Benefits
Personal care (5-7 hours/day) Respite (240 hours/year) Adult day care ($65/day) Home modifications ($1,500 avg.)

Rhode Island Caregiver Support Program

RI NFCSP Respite

Age Caregiver of someone 60+ (or with dementia)
General Rhode Island resident.
Income Limits No strict limit; prioritizes low-income.
Asset Limits Not applicable.
RI

Limited slots; urban focus due to small size.

Benefits
In-home respite (4-6 hours/day) Adult day care (~$65/day) Short-term facility care (up to 5 days)

Program of All-Inclusive Care for the Elderly (PACE)

Rhode Island PACE

Age 55+
General RI resident (specific counties), NFLOC, safe with PACE support.
Income Limits (2025) ~$2,829/month (Medicaid-eligible); private pay option available.
Asset Limits $4,000 (individual), $6,000 (couple) for Medicaid enrollees.
RI

Operated by PACE Organization of Rhode Island; covers 4 counties (Providence, Kent, Washington, Newport).

Benefits
Personal care (5-7 hours/day) Medical care Meals Transportation Respite Therapies

@Home Cost Share Program

Rhode Island @Home Cost Share

Age 65+
General RI resident, need help with 1+ ADL/IADL, not Medicaid-eligible.
Income Limits (2025) ~$1,255-$2,829/month (100%-300% FPL); sliding scale fees.
Asset Limits Not strictly assessed; focus on income/need.
RI

Administered by Division of Elderly Affairs (DEA); complements Medicaid.

Benefits
Personal care (4-6 hours/week) Homemaker services Respite (~5 days/year) Transportation

SSI Enhanced Assisted Living Program

Rhode Island SSI Enhanced AL

Age 65+ (or disabled)
General RI resident, SSI-eligible, living in approved AL facility.
Income Limits (2025) $943/month (SSI federal rate) + state supplement ($332/month).
Asset Limits $2,000 (individual), $3,000 (couple).
RI

Supplement increases to ~$1,275/month total for AL residents; ~50 facilities participate.

Benefits
Financial aid (~$332/month extra) for AL costs (personal care, meals, activities)

Medicare Savings Program (MSP)

Rhode Island Medicare Savings Program

Age 65+ or disabled
General RI resident, Medicare Part A/B.
Income Limits (2025) ~$2,510/month (QMB), ~$3,380/month (SLMB), ~$3,598/month (QI)—individual.
Asset Limits $9,430 (individual), $14,130 (couple).
RI

Three tiers; includes Extra Help for Part D; no waitlist.

Benefits
Covers Part B premiums ($174.70/month) Deductibles ($240/year) Copays (~20%)

VA Aid and Attendance (A&A) and Housebound Benefits

Rhode Island VA Aid and Attendance/Housebound

Age 65+ or disabled veteran/spouse
General RI resident, wartime service, need for ADL help (A&A) or homebound.
Income Limits (2025) Net income < ~$1,984/month (veteran with dependent, A&A); pension offsets income.
Asset Limits ~$155,356 net worth limit
RI

High veteran demand; supports rural/urban care needs.

Benefits
Cash (~$1,433-$2,642/month veteran, ~$951-$1,318 spouse) for care costs (e.g., in-home, assisted living)

Senior Farmers’ Market Nutrition Program (SFMNP)

Rhode Island SFMNP

Age 60+
General RI resident, low-income.
Income Limits (2025) ~$2,322/month individual, 185% FPL
Asset Limits Not assessed.
RI

Vouchers (~$50/season); serves ~10,000 annually.

Benefits
Vouchers (~$50/season) for fresh produce at approved markets

Property Tax Relief for Seniors

Rhode Island Property Tax Relief Credit

Age 65+ (or disabled)
General RI resident, homeowner/renter, low-income.
Income Limits (2025) ~$35,000/year household
Asset Limits Not assessed; income-focused.
RI

Credit up to $400; local exemptions vary by municipality.

Benefits
Tax credit (~$100-$400/year avg., depending on income)

Frequently Asked Questions about Eastgate Nursing & Rehabilitation Center

What neighborhood is Eastgate Nursing & Rehabilitation Center in?

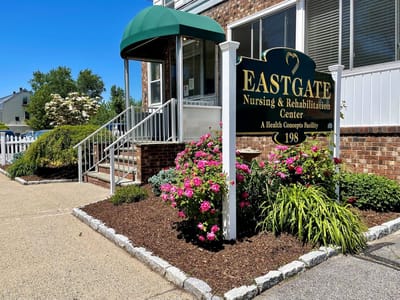
Eastgate Nursing & Rehabilitation Center is in the Six Corners neighborhood of East Providence.

Who is the owner of Eastgate Nursing & Rehabilitation Center?

The legal owner and operator of Eastgate Nursing & Rehabilitation Center is Alan Richards, Administrator.

Is Eastgate Nursing & Rehabilitation Center in a walkable area?

Eastgate Nursing & Rehabilitation Center has a walk score of 81. Very walkable. Most errands can be accomplished on foot, and many essentials are within a short walk.

What is the license number of Eastgate Nursing & Rehabilitation Center?

According to RI state health department records, Eastgate Nursing & Rehabilitation Center's license number is LTC00839.

When does Eastgate Nursing & Rehabilitation Center's license expire?

According to RI state health department records, Eastgate Nursing & Rehabilitation Center's license expires on December 31, 2025.

What is the occupancy rate at Eastgate Nursing & Rehabilitation Center?

Eastgate Nursing & Rehabilitation Center's occupancy is 87%.

How many beds does Eastgate Nursing & Rehabilitation Center have?

Eastgate Nursing & Rehabilitation Center has 68 beds.

Guides for Better Senior Living

Care Cost Calculator: See Prices in Your Area

Nursing Home Data Explorer

Don’t Wait Too Long: 7 Red Flag Signs Your Parent Needs Assisted Living Now

The True Cost of Assisted Living in 2025 – And How Families Are Paying For It

Understanding Senior Living Costs: Pricing Models, Discounts & Financial Assistance