Explore Open Rooms
1 Contact details
2 What type of senior care service are you looking for?
3 What budget do you have in mind for senior care?
4 How soon do you need to find care?
5 Additional details

Thank you for your interest!

Our team will be in touch shortly to help with next steps.

Assisted Living in Prospect Heights

CMS overall rating Info The Overall CMS Rating combines results from health inspections, staffing levels and quality measures. Health inspections carry the most weight. Staffing and quality scores can increase or decrease the final rating based on performance compared to state and national standards.

Eden Vista Prospect Heights

Overview of Eden Vista Prospect Heights

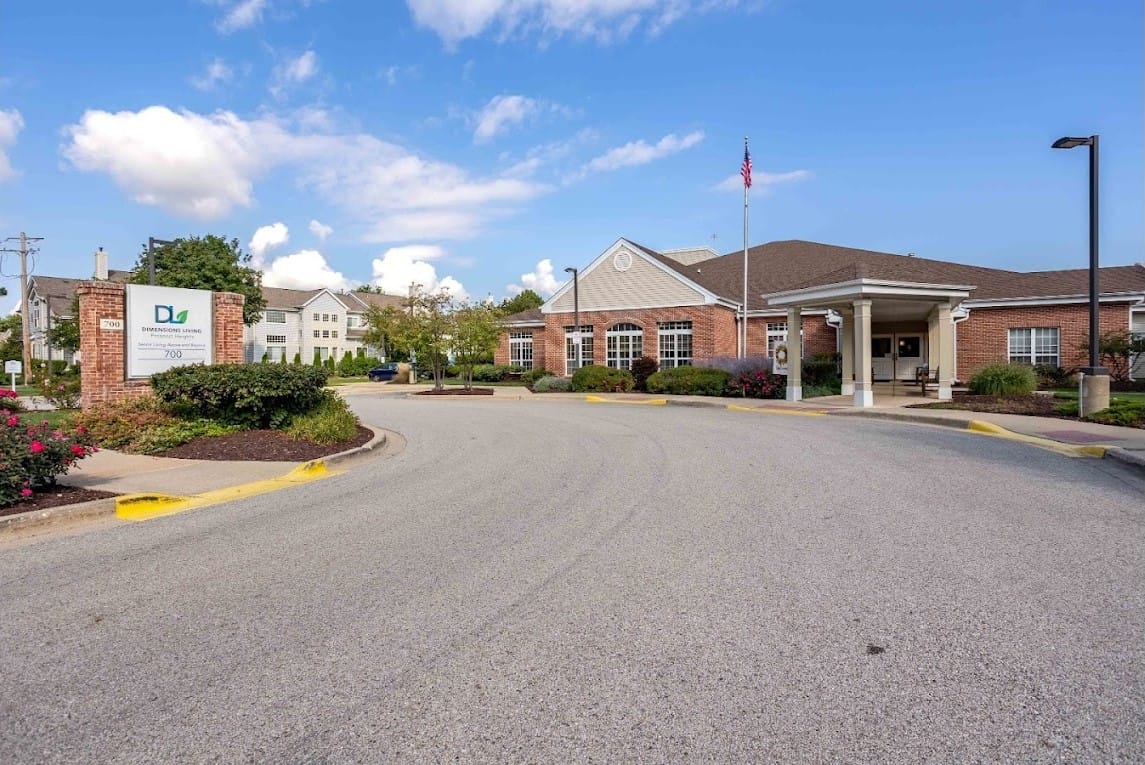
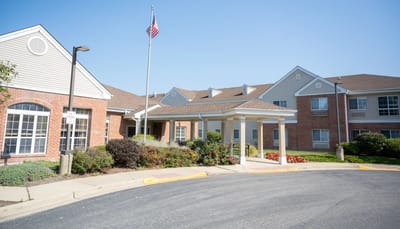
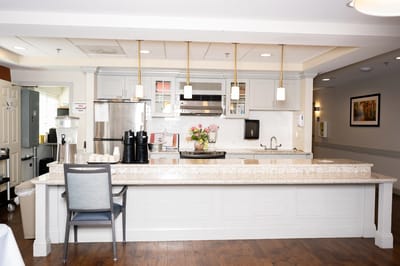
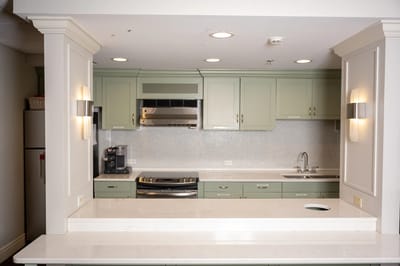
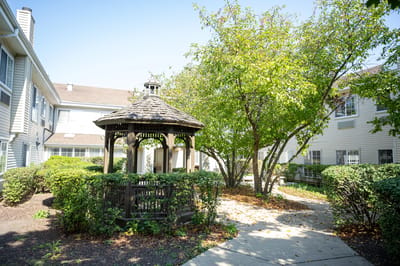
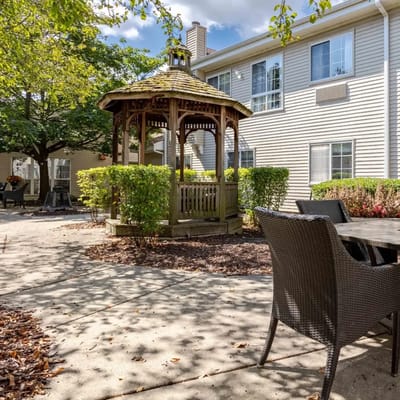
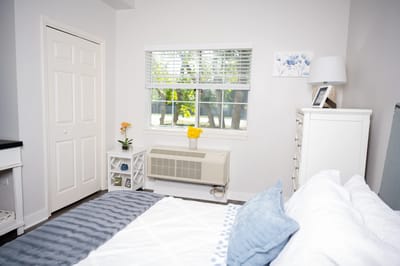
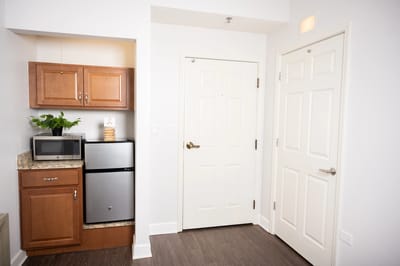
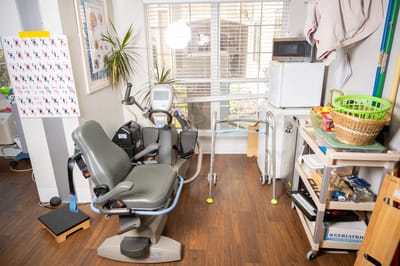
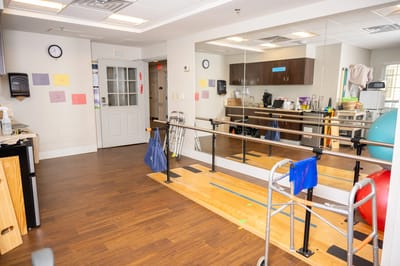
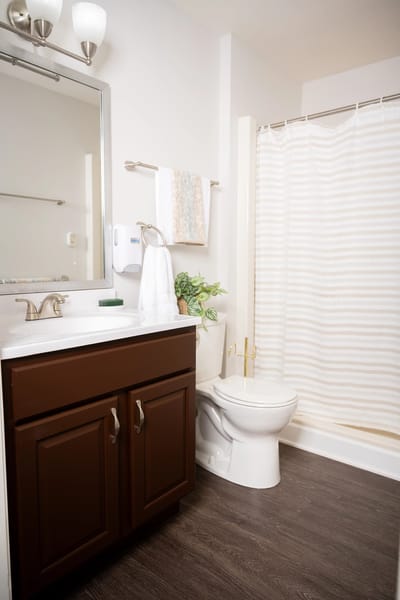
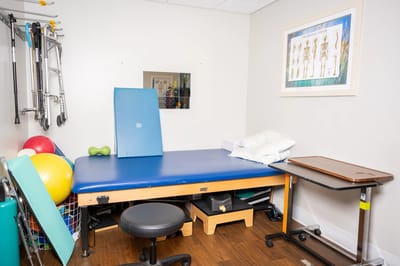
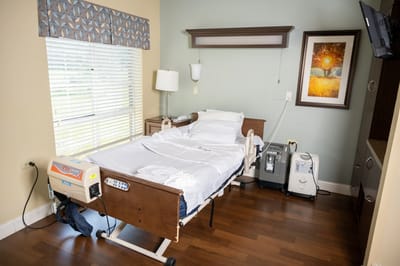
Located in the beautiful setting of Euclid Avenue, Prospect Heights, IL, Eden Vista Prospect Heights is an astounding senior living community offering assisted living, independent living, and memory care. The community works closely with seniors to carefully devise a care plan that best suits their needs and preferences. With a well-trained and reliable care team attending to seniors’ daily living activities, families can keep their peace of mind knowing their loved ones are well-cared for.

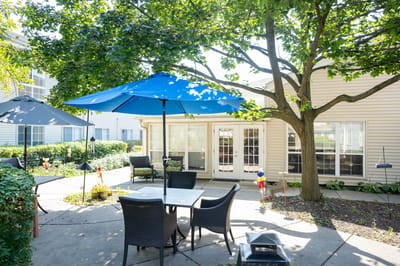
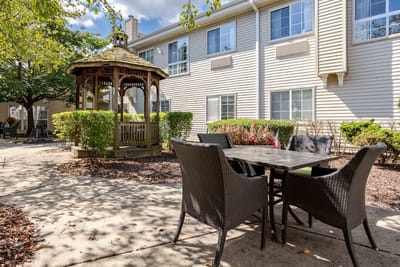
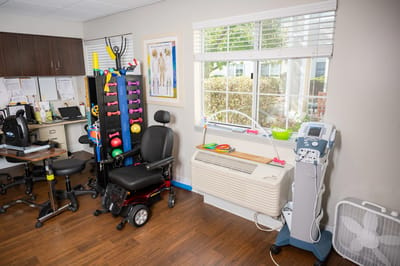
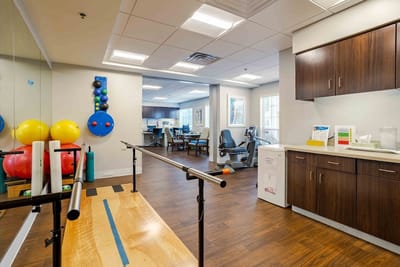
Enrich retirement with a variety of engaging activities and exciting events that aims to keep residents happy and well-engaged. Meals are also freshly-prepared to ensure residents enjoy hassle-free dining. Eden Vista Prospect Heights goes above and beyond to provide a safe place for seniors to make the most of their best years blissfully.

Quality ratings

Measured by Centers for Medicare & Medicaid Services (CMS)

Overall rating Info The Overall CMS Rating combines results from health inspections, staffing levels and quality measures. Health inspections carry the most weight. Staffing and quality scores can increase or decrease the final rating based on performance compared to state and national standards.
5/5
Illinois average: 2.5/5
Health Inspection Info Based on the results of the facility's three most recent standard inspections and any complaint investigations. CMS reviews the number, scope, and severity of deficiencies, with more recent findings weighted more heavily.
5/5
Illinois average: 2.8/5
Staffing Info Measures average nursing staff hours per resident per day, including Registered Nurses (RNs) and total nursing staff. Ratings are adjusted based on the level of care residents require and are compared to state and national benchmarks.
5/5
Illinois average: 2.1/5
Quality Measures Info Based on clinical and physical health indicators reported to CMS, such as hospital readmissions, falls, pressure ulcers, and improvements in mobility. These measures reflect how well residents' health needs are being managed.
2/5
Illinois average: 2.8/5

Nursing care per resident

Info This shows how many total hours of nursing staff time are available per resident each day. Higher numbers usually mean more staff support.
5h 19m per day

This home provides 71% more nursing time per resident than the Illinois average.

Illinois average: 3h 6m per day

Staffing hours breakdown

Info Hours of care per resident per day, broken down by staff type. Data from CMS Medicare.
Staff type Facility State avg National avg
Registered Nurse (RN) Info Registered nurse hours per resident per day. 2h 51m per day 44m per day 41m per day
Nurse Aide Info Nurse aide hours per resident per day. 3h 46m per day 2h 8m per day 2h 21m per day
Total Nursing (Weekend) Info Total number of nurse staff hours per resident per day on weekends. 6h 8m per day 3h 5m per day 3h 26m per day
Physical Therapist Info Physical therapist staff hours per resident per day. 32m per day 3m per day 4m per day
RN (Weekend) Info Registered nurse hours per resident per day on weekends. 2h 4m per day 34m per day 29m per day

Capacity and availability

Medium-capacity home

Offers a balance of services and community atmosphere.

Total beds 158

This home usually has availability

Lower occupancy suggests more openings may be available.

Lower demand than the Illinois average
Occupancy rate 46.8%
Residents per day (avg) 19
Occupancy rate
46.8%
Residents per day (avg)
19

Who this home usually serves

TYPE OF STAY

Mostly short-term rehab stays

Most residents typically stay for a few weeks or months before returning home or moving on.

Might be optimal for
Short stays Recovery Medicare-covered care

Breakdown by payment type

Medicare

64% of new residents, usually for short-term rehab.

Typical stay 1 - 2 months

Private pay

36% of new residents, often for short stays.

Typical stay 1 - 2 years

Finances and operations

Privately-owned community
Operated by a business corporation.
Home revenue
$9.1M
Operating loss
-$1.6M
Privately-owned community Operated by a business corporation.
Home revenue
$9.1M
Operating loss
-$1.6M
Payroll costs Info The portion of the home's budget spent on staff, including nurses, caregivers, and other employees who support care and operations.
$3.9M
43.2% of revenue
Other operating costs Info All remaining costs needed to run the home, such as food, utilities, building maintenance, supplies and administrative expenses.
$6.8M
Total costs $10.7M
Walk Score
Walk Score: 45 / 100
Somewhat walkable. A few nearby services may be reachable on foot, but most trips require transportation.

About this community

Therapy & Rehabilitation

3 services
Rehabilitation Services
Respite Care
Short-Term Rehab

Staffing & Medical

4 services
Nursing Services
Skilled Nursing
Licensed Nurses/CNAs
24-Hour Staffing

Amenities & Lifestyle

11 amenities
Cable Tv
Phone Service
Outdoor Courtyards
Laundry Service
Beauty Salon/Spa Services
24/7 Care Givers
Transportation Service
Fitness Programming
Physician Services
Banking Services
Pet Visitation
Specific ProgramsAssisted Living, Memory Care, Skilled Nursing, Palliative & Hospice Care, Post-Surgical & Medically Complex Care, Advance Cardiac Care, Specialized-Stroke Recovery Care, Pulmonary & Respiratory Care, Memory Care Programming

Dining & Nutrition

Food DescriptionEden Vista Prospect Heights provides chef-inspired meals prepared by on-site registered dieticians who customize menus based on individual needs and tastes. Dining is offered in a restaurant-style setting with in-room service available.
Meals IncludedYes

What does this home offer?

Building type icon
Building type icon

Building Type: Two-story

Types of Care at Eden Vista Prospect Heights

Independent Living Assisted Living Memory Care

Contact Eden Vista Prospect Heights

Health Inspection History

Inspections
Total health inspections 3

Illinois average 10.4


Last Health inspection on Feb 2025

Total health citations 16

Illinois average 36.8

Citations per inspection
5.33

Illinois average 3.68


Health citations are formal notices following inspections when they fail to comply with safety and care standards.

15 of 16 citations resulted from standard inspections; and 1 of 16 resulted from complaint investigations.

Breakdown of citation severity (last 3 years)
Critical Health citations More info 0
100% better than Illinois average

Illinois average: 0.7


Serious Health citations More info 2
44% better than Illinois average

Illinois average: 3.6

0 critical citations More info Illinois average: 0.7

2 serious citations More info Illinois average: 3.6

14 moderate citations More info Illinois average: 32

0 minor citations More info Illinois average: 0.5
Citations history (last 3 years)
Quality of Care moderate citation Info Issues related to how well residents receive appropriate treatment and support for their medical and daily care needs. Feb 26, 2025
Corrected

Nutrition moderate citation Info Issues related to food quality, meal service, and resident's nutritional needs. May 18, 2023
Corrected

Pharmacy moderate citation Info Issues related to medication management, including how drugs are stored, administered, and monitored. May 18, 2023
Corrected

Quality of Care serious citation Info Issues related to how well residents receive appropriate treatment and support for their medical and daily care needs. May 18, 2023
Corrected

Compare Assisted Living around Prospect Heights The information below is reported by the Illinois Department of Public Health, Office of Health Care Regulation.

Filter by care type
Eden Vista Prospect Heights
NH

Nursing Home Licensed facility providing 24/7 skilled nursing care for residents with complex, ongoing medical needs. Staffed by RNs, LPNs, and CNAs. Inspected and star-rated annually by CMS. Accepts Medicare (short-term rehab) and Medicaid (long-term care).

AL

Assisted Living A licensed, long-term care setting for seniors or individuals with disabilities who need help with daily activities — like bathing, dressing, and medication management — but not 24-hour skilled nursing. Offers housing, meals, and around-the-clock support while aiming to maximize resident independence.

IL

Independent Living Lifestyle-focused communities for older adults offering dining, activities, and transportation with minimal personal care. Best for active, independent seniors who want community without medical support.

MC

Memory Care Secured, specialized care for people living with Alzheimer's or dementia. Staff trained in cognitive impairment, with higher staff-to-resident ratios and an environment designed to reduce confusion and wandering risk.

Prospect Heights
158
No
45
-
-
0
0
0
-
Sunrise of Prospect Heights
AL

Assisted Living A licensed, long-term care setting for seniors or individuals with disabilities who need help with daily activities — like bathing, dressing, and medication management — but not 24-hour skilled nursing. Offers housing, meals, and around-the-clock support while aiming to maximize resident independence.

MC

Memory Care Secured, specialized care for people living with Alzheimer's or dementia. Staff trained in cognitive impairment, with higher staff-to-resident ratios and an environment designed to reduce confusion and wandering risk.

Prospect Heights
101
Yes
52
-
Aspired Living Prospect Heights Opco Llc
7
2
1
-
The Reserve of Geneva – Independent Living Community
IL

Independent Living Lifestyle-focused communities for older adults offering dining, activities, and transportation with minimal personal care. Best for active, independent seniors who want community without medical support.

Geneva
-
No
45
-
-
0
0
0
-

Places of interest near Eden Vista Prospect Heights

Address 2.5 miles from city center

Calculate Travel Distance to Eden Vista Prospect Heights

Add your location

Address

Staffing Data (Q2 2025)

This data corresponds to Q2 2025 and is based on CMS Payroll-Based Journal.

Total staff 62
Employees 43
Contractors 19
Staff to resident ratio 12.40:1
553% better than Illinois average

Illinois average ratio: 1.90:1

Avg staff/day 23
Average shift 7 hours
8% worse than Illinois average

Illinois average: 7.6 hours

Total staff hours (quarter) 14,737
Nursing staff breakdown
Registered Nurse

Manages medical care and health needs.

Total count 12
Average shift length Info Average shift length. Calculated as total hours divided by days worked and average staff per day. 7.4 hours

No contractors work on this role.

Licensed Practical Nurse

Assists with medical care and medications.

Total count 3
Average shift length Info Average shift length. Calculated as total hours divided by days worked and average staff per day. 7.9 hours

No contractors work on this role.

Certified Nursing Assistant

Helps with daily care and mobility.

Total count 22
Average shift length Info Average shift length. Calculated as total hours divided by days worked and average staff per day. 6.9 hours

This role is partially covered by contractors.

Contractor staffing

Total hours from contractors

18%

2,652 contractor hours this quarter

Physical Therapy Assistant: 6 Respiratory Therapy Technician: 3 Qualified Social Worker: 3 Certified Nursing Assistant: 2 Medical Director: 2 Physical Therapy Aide: 2 Speech Language Pathologist: 1
Staff by category
Certified Nursing Assistant202225,75891100%6.9
Registered Nurse120122,92891100%7.4
Respiratory Therapy Technician0331,0087785%7.2
Clinical Nurse Specialist2029606470%7.5
Licensed Practical Nurse3037756470%7.9
Physical Therapy Assistant0666357380%6.4
Speech Language Pathologist0115056369%8
Administrator1014806470%7.5
Nurse Practitioner1014806470%7.5
Other Dietary Services Staff2023775156%7
Mental Health Service Worker1013284246%7.8
Medical Director0221852527%6.9
Qualified Social Worker0331705560%2.7
Physical Therapy Aide0221412932%4.9
Dietitian101811%7.7
22 Certified Nursing Assistant
% of Days 100%
12 Registered Nurse
% of Days 100%
3 Respiratory Therapy Technician
% of Days 85%
2 Clinical Nurse Specialist
% of Days 70%
3 Licensed Practical Nurse
% of Days 70%
6 Physical Therapy Assistant
% of Days 80%
1 Speech Language Pathologist
% of Days 69%
1 Administrator
% of Days 70%
1 Nurse Practitioner
% of Days 70%
2 Other Dietary Services Staff
% of Days 56%
1 Mental Health Service Worker
% of Days 46%
2 Medical Director
% of Days 27%
3 Qualified Social Worker
% of Days 60%
2 Physical Therapy Aide
% of Days 32%
1 Dietitian
% of Days 1%

Facility Characteristics

Source: CMS Long-Term Care Facility Characteristics (Data as of Jan 2026)

Total census
5 residents
Residents by payment source
Medicare
5 residents (100%)
Programs & Services
Residents' Group

Residents meet regularly to discuss policies, care quality, and activities

Active Resident Council

Organized group of residents that meets regularly to discuss facility policies, quality of life, and activities.

Quality of care over time

These measures show how residents usually do over time at this home, based on health outcomes and preventive care.

High-risk clinical events score Info A composite score based on pressure ulcers, falls with injury, weight loss, walking ability decline, and activities of daily living decline. 5.0
48% better than Illinois average

Illinois average: 9.7

Functional decline score Info A composite score based on activities of daily living decline, walking ability decline, and incontinence. 27.7
49% worse than Illinois average

Illinois average: 18.6

Long-stay resident measures
Low Risk Residents with Bowel/Bladder Incontinence Info Percent of low risk long-stay residents who lose control of their bowels or bladder 27.7%
28% worse than Illinois average

Illinois average: 21.6%

Falls with Major Injury Info Percent of long-stay residents experiencing one or more falls with major injury 5.3%
57% worse than Illinois average

Illinois average: 3.4%

High Risk Residents with Pressure Ulcers Info Percent of long-stay high risk residents with pressure ulcers 5.5%
5% worse than Illinois average

Illinois average: 5.3%

Urinary Tract Infection Info Percent of long-stay residents with a urinary tract infection 0.0%
100% better than Illinois average

Illinois average: 1.8%

Lost Too Much Weight Info Percent of long-stay residents who lose too much weight 4.4%
33% better than Illinois average

Illinois average: 6.5%

Depressive Symptoms Info Percent of long-stay residents who have depressive symptoms 2.6%
95% better than Illinois average

Illinois average: 48.1%

Antipsychotic Use Info Percent of long-stay residents who received an antipsychotic medication 31.6%
56% worse than Illinois average

Illinois average: 20.2%

Pneumococcal Vaccine Info Percent of long-stay residents assessed and appropriately given the pneumococcal vaccine 97.4%
9% better than Illinois average

Illinois average: 89.2%

Short-stay resident measures
Significantly below average Illinois avg: 2.0 Info CMS star rating based on short-stay quality measure performance. 5 stars = much above average, 1 star = much below average.
Pneumococcal Vaccine Info Percent of short-stay residents assessed and appropriately given the pneumococcal vaccine 49.7%
27% worse than Illinois average

Illinois average: 68.3%

Antipsychotic medication increase Info Percent of short-stay residents who newly received an antipsychotic medication 5.7%
142% worse than Illinois average

Illinois average: 2.3%

Influenza Vaccine Info Percent of short-stay residents assessed and appropriately given the seasonal influenza vaccine 64.4%
In line with Illinois average

Illinois average: 63.0%

Re-hospitalized after SNF stay Info Percentage of short-stay residents who were re-hospitalized after their nursing home admission. 20.1%
23% better than Illinois average

Illinois average: 26.2%

Emergency department visits Info Percentage of short-stay residents who had an outpatient emergency department visit. 9.6%
31% better than Illinois average

Illinois average: 14.0%

Falls with major injury Info Percentage of SNF residents who experience falls with major injury during their stay. 2.3%
195% worse than Illinois average

Illinois average: 0.8%

Ability to care for self at discharge Info Percentage of residents at or above expected ability to care for themselves at discharge. 61.3%
14% better than Illinois average

Illinois average: 53.7%

Successful return to home or community Info Rate of successful return to home or community from a skilled nursing facility. 31.9%
37% worse than Illinois average

Illinois average: 50.6%

Guides for Better Senior Living

Care Cost Calculator: See Prices in Your Area

Nursing Home Data Explorer

Don’t Wait Too Long: 7 Red Flag Signs Your Parent Needs Assisted Living Now

The True Cost of Assisted Living in 2025 – And How Families Are Paying For It

Understanding Senior Living Costs: Pricing Models, Discounts & Financial Assistance

Financial Aid for Illinois Seniors

Get financial aid guidance

Community Care Program

Illinois CCP

Age 60+, Illinois resident, at risk of nursing home placement.

~$1,215/month (individual).

$17,500 (individual, excludes home, car).

High demand in urban areas; waitlists possible.

Illinois Respite Program

IL Respite (via NFCSP)

Caregiver of someone 60+ (or with dementia), Illinois resident.

No strict limit; prioritizes low-income.

Not applicable.

Limited slots; urban/rural balance.

Supportive Living Program (SLP)

Illinois Medicaid Supportive Living Program

Age 65+ or 22-64 with disability, Illinois resident, Medicaid-eligible, needs moderate assistance (not nursing home-level).

~$2,829/month (300% FBR, individual); QIT allowed.

$2,000 (individual), $3,000 (couple) (excludes home, car).

~200 SLP sites statewide; room/board not covered.

Persons Who Are Elderly Waiver

Illinois Medicaid Elderly Waiver

Age 65+, Illinois resident, Medicaid-eligible, nursing home-level care need.

~$2,829/month (300% FBR, individual).

$2,000 (individual), $3,000 (couple).

Part of HealthChoice Illinois; consumer-directed options available.

Medicare Savings Program (MSP)

Illinois Medicare Savings Program

Age 65+ or disabled, Illinois resident, Medicare Part A/B.

~$2,510/month (QMB), ~$3,380/month (SLMB), ~$3,598/month (QI)—individual.

$9,430 (individual), $14,130 (couple).

Three tiers; no waitlist.

Senior Community Service Employment Program (SCSEP)

Illinois SCSEP

Age 55+, unemployed, low-income, Illinois resident.

~$1,983/month (125% FPL).

Not specified; income-focused.

Priority for veterans, rural residents.

Optional State Supplementation (OSS)

Illinois Optional State Supplementation

Age 65+ or disabled, Illinois resident, in approved facility, SSI recipient or low-income.

~$1,004/month (including SSI).

$2,000 (individual), $3,000 (couple).

~$50-$500/month based on facility type.

VA Aid and Attendance (A&A) and Housebound Benefits

Illinois VA Aid and Attendance/Housebound

Age 65+ or disabled veteran/spouse, Illinois resident, wartime service, need for ADL help (A&A) or homebound.

Net income < ~$1,984/month (veteran with dependent, A&A); pension offsets income.

~$155,356 (net worth limit).

High veteran demand in urban/rural areas.

Tour Icon
Planning a tour? Check our touring checklist.
Chat Icon
Thinking of living here? We can help you speak to a current resident