Edgewood Health & Rehab
Nursing Home · Mississippi, MS
CMS overall rating Info The Overall CMS Rating is scored from 1 to 5 stars and combines results from health inspections, staffing levels, and quality measures. Health inspections carry the most weight. Staffing and quality scores can increase or decrease the final rating based on performance compared to state and national standards.

Edgewood Health & Rehab

Nursing Home · Mississippi, MS
CMS overall rating Info The Overall CMS Rating is scored from 1 to 5 stars and combines results from health inspections, staffing levels, and quality measures. Health inspections carry the most weight. Staffing and quality scores can increase or decrease the final rating based on performance compared to state and national standards.
Calculator: See prices in your area
Edgewood Health & Rehab accepts Medicaid, Medicare, and private pay.

Overview of Edgewood Health & Rehab

Edgewood Health & Rehab offers skilled nursing care in Springdale, Arkansas. The facility provides short-term rehab, long-term care, and respite care services, all delivered by a dedicated team. Residents enjoy a supportive environment with engaging activities and nutritious meals.
(601) 362-5394

Quality ratings

Measured by Centers for Medicare & Medicaid Services (CMS)

Overall rating Info The Overall CMS Rating combines results from health inspections, staffing levels and quality measures. Health inspections carry the most weight. Staffing and quality scores can increase or decrease the final rating based on performance compared to state and national standards.
▼ 60.9% Below MS avg. ▼ 60.9% Below MS avg.Click the badge to see the full State ranking.Click here to see the full State ranking.
Health Inspection Info Based on the results of the facility's three most recent standard inspections and any complaint investigations. CMS reviews the number, scope, and severity of deficiencies, with more recent findings weighted more heavily.
▼ 64.7% Below MS avg. ▼ 64.7% Below MS avg.Click the badge to see the full State ranking.Click here to see the full State ranking.
Staffing Info Measures average nursing staff hours per resident per day, including Registered Nurses (RNs) and total nursing staff. Ratings are adjusted based on the level of care residents require and are compared to state and national benchmarks.
▼ 8.3% Below MS avg. ▼ 8.3% Below MS avg.Click the badge to see the full State ranking.Click here to see the full State ranking.
Quality Measures Info Based on clinical and physical health indicators reported to CMS, such as hospital readmissions, falls, pressure ulcers, and improvements in mobility. These measures reflect how well residents' health needs are being managed.
▼ 53.9% Below MS avg. ▼ 53.9% Below MS avg.Click the badge to see the full State ranking.Click here to see the full State ranking.

Staffing hours breakdown

Info Daily nursing hours per resident by staff type, reported to CMS. Higher is generally better — compare this facility to state and national averages to see where staffing stands.

Hours per resident per day — compared to Mississippi state averages

Total nursing care / resident Info This home is ranked 19th out of 100 homes in Mississippi. Total adjusted nursing hours per resident per day, combining RN, LPN, and aide time. CMS adjusts this for case-mix so facilities can be fairly compared.
5h 10m per day
Rank #19 / 100Nurse hours — State benchmarkedThis home is ranked 19th out of 100 homes in Mississippi. Shows adjusted nurse hours per resident per day benchmarked to the Mississippi average, with a ranking across 100 Mississippi SNFs. More hours mean more direct care. The national average is about 3.5 hrs; below 3.0 is a red flag.Click the rank badge to see the full State ranking.Click here to see the full State ranking.
This facility Mississippi avg (4h 20m per day)
vs Mississippi avg
+19%

3 of 6 metrics below state avg

Standout metric Physical Therapist is +100% above state avg
Staff typeHours / Day / Residentvs state avg
Registered Nurse (RN) Info RNs hold the highest nursing license and can assess residents, interpret test results, and direct care plans. More RN hours per day often signals stronger clinical oversight and faster response to health changes. 18m per day ▼ 53% State avg: 38m per day · National avg: 41m per day
LPN / LVN Info Licensed Practical Nurses (LPNs) or Licensed Vocational Nurses (LVNs) deliver routine hands-on care — medication administration, wound dressing, and monitoring vital signs. They work under RN supervision and make up a large share of daily bedside care. 59m per day ▼ 11% State avg: 1h 6m per day · National avg: 52m per day
Nurse Aide Info Certified Nurse Aides (CNAs) provide the most direct day-to-day assistance: bathing, dressing, feeding, and mobility. Nurse aide hours are typically the largest staffing category and directly affect residents' quality of life. 3h 32m per day ▲ 42% State avg: 2h 29m per day · National avg: 2h 20m per day
Total Nursing (Weekend) Info Combined nursing hours (RN + LPN + Nurse Aide) per resident per day on weekends. Staffing often drops on weekends — this figure reveals whether the facility maintains adequate coverage outside of weekday hours. 3h 35m per day ■ Avg State avg: 3h 31m per day · National avg: 3h 26m per day
Physical Therapist Info Hours per resident per day provided by licensed Physical Therapists (PTs) or PT Assistants. PT services help residents recover mobility after injury or illness and are especially important for post-acute (short-stay) rehabilitation. 4m per day ▲ 100% State avg: 2m per day · National avg: 4m per day
RN (Weekend) Info Registered nurse hours specifically on weekends. Facilities sometimes reduce RN presence on Saturdays and Sundays — a low weekend RN figure compared to weekday hours can indicate reduced clinical oversight when most administrative staff are absent. 11m per day ▼ 50% State avg: 22m per day · National avg: 28m per day

Capacity and availability

This home usually has limited availability

Occupancy between 85% and 95% suggests balanced demand.

Higher occupancy than the Mississippi average: 82.3%
Occupancy rate 92.8% Rank #22 / 99Occupancy rate — State benchmarkedThis home is ranked 22nd out of 99 homes in Mississippi. Shows this facility's occupancy rate versus the Mississippi average, with its Statewide rank out of 99. Higher occupancy signals strong local demand and financial stability.Click the rank badge to see the full State ranking.Click here to see the full State ranking.
Avg. Length of Stay 322 days
Occupancy rate
92.8% Rank #22 / 99Occupancy rate — State benchmarkedThis home is ranked 22nd out of 99 homes in Mississippi. Shows this facility's occupancy rate versus the Mississippi average, with its Statewide rank out of 99. Higher occupancy signals strong local demand and financial stability.Click the rank badge to see the full State ranking.Click here to see the full State ranking.
Avg. Length of Stay
322 days
Bed community size
119-bed community Rank #26 / 104Bed count — State benchmarkedThis home is ranked 26th out of 104 homes in Mississippi. Shows this facility's certified or reported bed count compared to other Mississippi SNFs. Larger communities may offer more amenities, programs, and on-site services for residents and families.Click the rank badge to see the full State ranking.Click here to see the full State ranking.
A larger shared setting that may offer more common spaces and organized community services.
Walk Score
Walk Score: 1 / 100 Rank #97 / 98Walk Score — State benchmarkedThis home is ranked 97th out of 98 homes in Mississippi. Shows how walkable this facility's neighborhood is compared to the average Walk Score across Mississippi SNFs. Higher scores benefit residents, families, and staff.Click the rank badge to see the full State ranking.Click here to see the full State ranking.
Car-dependent. Most errands require a car, with limited nearby walkable options.

About this community

License Details

Facility TypeNursing Home Facilities
CountyHinds
CMS Certification Number255103

Ownership & Operating Entity

Edgewood Health & Rehab is administrated by Darren Massey.

Therapy & Rehabilitation

2 services
Rehabilitation Services
Respite Care

Staffing & Medical

1 service
24-Hour Staffing

Amenities & Lifestyle

Communal Dining Space
Dedicated Activity Area
Outdoor Courtyard
Therapy Gym
Salon Services
ActivitiesDaily opportunities for entertainment and socialization, with a diverse calendar of activities.
Specific ProgramsShort-Term Rehab, Additional Services

Dining & Nutrition

Food DescriptionNutritious meals crafted by a certified dietary manager and cooks, accommodating food allergies and preferences.

Contact Edgewood Health & Rehab

Health Inspection History

Inspections Since 2020
Total health inspections 12

Mississippi average 4.4


Last Health inspection on Oct 2025

Total health citations
44 Rank #101 / 103Health citations — State benchmarkedThis home is ranked 101st out of 103 homes in Mississippi. Shows this facility's total health deficiency citations benchmarked to the Mississippi State average, with a ranking across all 103 MS SNFs. Lower citation counts earn a better rank.Click the rank badge to see the full State ranking.Click here to see the full State ranking.

Mississippi average 16.9

Citations per inspection
3.67 Rank #46 / 103Citations per inspection — State benchmarkedThis home is ranked 46th out of 103 homes in Mississippi. Shows average deficiency citations per CMS inspection for this facility versus the Mississippi mean across 103 SNFs with citation data. Lower is better.Click the rank badge to see the full State ranking.Click here to see the full State ranking.

Mississippi average 3.83


Health citations are formal notices following inspections when they fail to comply with safety and care standards.

18 of 44 citations resulted from standard inspections; 25 of 44 resulted from complaint investigations; and 1 of 44 came from combined inspections (standard and complaint).

Breakdown of citation severity (last 6 years)
Critical Health citations
3
200% worse than Mississippi average

Mississippi average: 1


Serious Health citations
9 Rank #50 / 50Serious citations (G–I) — State benchmarkedThis home is ranked 50th out of 50 homes in Mississippi. Shows G–I scope serious health citations for this facility versus other Mississippi SNFs. Lower counts rank better.Click the rank badge to see the full State ranking.Click here to see the full State ranking.
718% worse than Mississippi average

Mississippi average: 1.1

3 critical citations Mississippi average: 1

9 serious citations Mississippi average: 1.1

31 moderate citations Mississippi average: 14.6

1 minor citation Mississippi average: 0.3
Citations history (last 6 years)
Nursing Services moderate citation Oct 29, 2025
Corrected

Quality of Care serious citation Oct 29, 2025
Corrected

Care Planning serious citation Oct 29, 2025
Corrected

Quality of Care critical citation Jun 19, 2025
Corrected

Staffing Data

Reporting period: April 1 – June 30, 2025 (Q2 2025). Source: CMS Payroll-Based Journal report.

Total staff 221
Employees 218
Contractors 3
Staff to resident ratio 1.94:1
14% better than Mississippi average
Mississippi average ratio: 1.69:1 Mississippi average ratio: 1.69:1See full Mississippi ranking
Avg staff/day 71
Average shift 7.6 hours
5% worse than Mississippi average
Mississippi average: 8 hours Mississippi average shift: 8 hoursSee full Mississippi ranking
Total staff hours (quarter) 49,306

Nursing staff breakdown

Q2 2025 · Apr 1 – Jun 30 More info This data comes from the CMS Payroll-Based Journal report covering April 1 – June 30, 2025.
Registered Nurse

Manages medical care and health needs.

Total count 14
Average shift length Info Average shift length. Calculated as total hours divided by days worked and average staff per day. 7.6 hours

No contractors work on this role.

Licensed Practical Nurse

Assists with medical care and medications.

Total count 50
Average shift length Info Average shift length. Calculated as total hours divided by days worked and average staff per day. 8.5 hours

No contractors work on this role.

Certified Nursing Assistant

Helps with daily care and mobility.

Total count 140
Average shift length Info Average shift length. Calculated as total hours divided by days worked and average staff per day. 7.3 hours

No contractors work on this role.

Contractor staffing

Q2 2025 · Apr 1 – Jun 30 More info This data comes from the CMS Payroll-Based Journal report covering April 1 – June 30, 2025.

Total hours from contractors

0.3%

130 contractor hours this quarter

Occupational Therapy Aide: 2 Medical Director: 1

Staff by category

Q2 2025 · Apr 1 – Jun 30 More info This data comes from the CMS Payroll-Based Journal report covering April 1 – June 30, 2025.
Certified Nursing Assistant140014032,36491100%7.3
Licensed Practical Nurse5005010,62691100%8.5
Registered Nurse140141,85791100%7.6
RN Director of Nursing6069906774%8.1
Nurse Practitioner2026476470%7.8
Mental Health Service Worker1015966167%9.8
Dietitian1015596673%8.5
Other Dietary Services Staff1015256470%8.2
Administrator1015126470%8
Clinical Nurse Specialist2025015965%8.2
Occupational Therapy Aide022941112%8.5
Medical Director011361415%2.6
140 Certified Nursing Assistant
% of Days 100%
50 Licensed Practical Nurse
% of Days 100%
14 Registered Nurse
% of Days 100%
6 RN Director of Nursing
% of Days 74%
2 Nurse Practitioner
% of Days 70%
1 Mental Health Service Worker
% of Days 67%
1 Dietitian
% of Days 73%
1 Other Dietary Services Staff
% of Days 70%
1 Administrator
% of Days 70%
2 Clinical Nurse Specialist
% of Days 65%
2 Occupational Therapy Aide
% of Days 12%
1 Medical Director
% of Days 15%

Penalties and fines

Includes penalties issued in 2023-2025

Federal penalties imposed by CMS for regulatory violations, including civil money penalties (fines) and denials of payment for new Medicare/Medicaid admissions.

Source: CMS Penalties Database (Data as of Jan 2026)

Total fines amount $110K Rank #96 / 104Federal fines — State benchmarkedThis home is ranked 96th out of 104 homes in Mississippi. Shows this facility's cumulative CMS federal fine dollars versus the Mississippi average among facilities with fines, and where it ranks among 104 skilled nursing facilities in the pool. Lower total dollars mean a better rank.Click the rank badge to see the full State ranking.Click here to see the full State ranking.
180% higher than Mississippi average

Mississippi average: $39K

Number of fines 7
250% more fines than Mississippi average

Mississippi average: 2.0

Payment Denials Info Serious action where Medicare and/or Medicaid temporarily stops payments for new residents until issues are fixed. 2
780% more payment denials than Mississippi average

Mississippi average: 0.2

Fines amount comparison
This facility $110K
Mississippi average $39K
Penalty History

Penalties are imposed by CMS for violations of federal nursing home regulations.

9 penalties in the past 3 years

Multiple penalties were reported in the last 3 years.

Civil Money Penalty Info Fines imposed for noncompliance, which can be assessed per day or per instance of violation. Jun 19, 2025
$12K
Civil Money Penalty Info Fines imposed for noncompliance, which can be assessed per day or per instance of violation. Aug 1, 2024
$7K
Civil Money Penalty Info Fines imposed for noncompliance, which can be assessed per day or per instance of violation. Aug 1, 2024
$7K
Civil Money Penalty Info Fines imposed for noncompliance, which can be assessed per day or per instance of violation. Jun 24, 2024
$10K

Last updated: Jan 2026

Quality of care over time

These measures show how residents usually do over time at this home, based on health outcomes and preventive care.

High-risk clinical events score Info A composite score based on pressure ulcers, falls with injury, weight loss, walking ability decline, and activities of daily living decline. 13.9
12% worse than Mississippi average

Mississippi average: 12.4

Functional decline score Info A composite score based on activities of daily living decline, walking ability decline, and incontinence. 25.9
16% worse than Mississippi average

Mississippi average: 22.3

Long-stay resident measures
Significantly below average Mississippi avg: 2.0 Info CMS star rating based on long-stay quality measure performance. 5 stars = significantly above average, 1 star = significantly below average.
Need for Help with Daily Activities Increased Info Percent of long-stay residents whose need for help with daily activities has increased 24.4%
15% worse than Mississippi average

Mississippi average: 21.2%

Walking Ability Worsened Info Percent of long-stay residents whose ability to move independently worsened 31.0%
26% worse than Mississippi average

Mississippi average: 24.5%

Low Risk Residents with Bowel/Bladder Incontinence Info Percent of low risk long-stay residents who lose control of their bowels or bladder 22.5%
5% worse than Mississippi average

Mississippi average: 21.4%

Falls with Major Injury Info Percent of long-stay residents experiencing one or more falls with major injury 1.0%
70% better than Mississippi average

Mississippi average: 3.2%

High Risk Residents with Pressure Ulcers Info Percent of long-stay high risk residents with pressure ulcers 6.0%
17% better than Mississippi average

Mississippi average: 7.1%

Urinary Tract Infection Info Percent of long-stay residents with a urinary tract infection 2.2%
16% better than Mississippi average

Mississippi average: 2.6%

Lost Too Much Weight Info Percent of long-stay residents who lose too much weight 7.1%
14% worse than Mississippi average

Mississippi average: 6.2%

Depressive Symptoms Info Percent of long-stay residents who have depressive symptoms 0.0%
100% better than Mississippi average

Mississippi average: 1.5%

Antipsychotic Use Info Percent of long-stay residents who received an antipsychotic medication 25.5%
20% worse than Mississippi average

Mississippi average: 21.2%

Pneumococcal Vaccine Info Percent of long-stay residents assessed and appropriately given the pneumococcal vaccine 94.0%
In line with Mississippi average

Mississippi average: 95.9%

Influenza Vaccine Info Percent of long-stay residents assessed and appropriately given the seasonal influenza vaccine 97.3%
In line with Mississippi average

Mississippi average: 97.0%

Hospitalizations per 1,000 days Info Number of hospitalizations per 1,000 long-stay resident days. 4.03
65% worse than Mississippi average

Mississippi average: 2.44

ED visits per 1,000 days Info Number of outpatient emergency department visits per 1,000 long-stay resident days. 2.73
5% better than Mississippi average

Mississippi average: 2.88

Short-stay resident measures
Below average Mississippi avg: 1.9 Info CMS star rating based on short-stay quality measure performance. 5 stars = much above average, 1 star = much below average.
Pneumococcal Vaccine Info Percent of short-stay residents assessed and appropriately given the pneumococcal vaccine 71.8%
18% worse than Mississippi average

Mississippi average: 87.9%

Antipsychotic medication increase Info Percent of short-stay residents who newly received an antipsychotic medication 4.1%
66% worse than Mississippi average

Mississippi average: 2.5%

Influenza Vaccine Info Percent of short-stay residents assessed and appropriately given the seasonal influenza vaccine 61.2%
28% worse than Mississippi average

Mississippi average: 84.6%

Re-hospitalized after SNF stay Info Percentage of short-stay residents who were re-hospitalized after their nursing home admission. 29.2%
5% worse than Mississippi average

Mississippi average: 27.9%

Emergency department visits Info Percentage of short-stay residents who had an outpatient emergency department visit. 12.0%
22% better than Mississippi average

Mississippi average: 15.3%

Falls with major injury Info Percentage of SNF residents who experience falls with major injury during their stay. 0.0%
100% better than Mississippi average

Mississippi average: 0.8%

Ability to care for self at discharge Info Percentage of residents at or above expected ability to care for themselves at discharge. 41.2%
23% worse than Mississippi average

Mississippi average: 53.7%

Successful return to home or community Info Rate of successful return to home or community from a skilled nursing facility. 51.5%
In line with Mississippi average

Mississippi average: 50.6%

Breakdown by payment type

Medicare

71% of new residents, usually for short-term rehab.

Typical stay 1 - 2 months

Private pay

16% of new residents, often for short stays.

Typical stay 7 - 8 months

Medicaid

13% of new residents, often for long-term daily care.

Typical stay 4 - 5 years

Facility Characteristics

Source: CMS Long-Term Care Facility Characteristics (Data as of Jan 2026)

Total residents 114
Medicare
14
12.3% of residents
Medicaid
79
69.3% of residents
Private pay or other
21
18.4% of residents
Programs & Services
Residents Group

Residents meet regularly to discuss policies, care quality, and activities

Active Resident Council

Organized group of residents that meets regularly to discuss facility policies, quality of life, and activities.

Finances and operations

Privately-owned community
Operated by a partnership between two or more business owners.
Home revenue
$13.8M
Profit
$432.1K
Privately-owned community Operated by a partnership between two or more business owners.
Home revenue
$13.8M Rank #14 / 99Revenue — State benchmarkedThis home is ranked 14th out of 99 homes in Mississippi. Shows this facility's annual revenue compared to the Mississippi SNF average. Higher revenue generally means more resources for staffing and capital — read alongside Payroll %.Click the rank badge to see the full State ranking.Click here to see the full State ranking.
Profit
$432.1K
Payroll costs Info The portion of the home's budget spent on staff, including nurses, caregivers, and other employees who support care and operations. Rank #15 / 99Payroll — State benchmarkedThis home is ranked 15th out of 99 homes in Mississippi. Shows total annual staff payroll benchmarked to the Mississippi average. Higher payroll investment relative to peers often signals better staffing and less reliance on cheaper contract labor.Click the rank badge to see the full State ranking.Click here to see the full State ranking.
$6.2M
45.3% of revenue Rank #58 / 99Payroll % — State benchmarkedThis home is ranked 58th out of 99 homes in Mississippi. Shows payroll as a percentage of revenue versus the Mississippi average. Well-run Mississippi SNFs typically land around 51–70% — the top third Statewide. Below 25% may signal understaffing or heavy agency use — read with Staffing ratings.Click the rank badge to see the full State ranking.Click here to see the full State ranking.
Other operating costs Info All remaining costs needed to run the home, such as food, utilities, building maintenance, supplies and administrative expenses.
$7.1M
Total costs $13.3M

Who this home usually serves

TYPE OF STAY

Mostly short-term rehab stays

Most residents typically stay for a few weeks or months before returning home or moving on.

Places of interest near Edgewood Health & Rehab

Address 2.5 miles from city center Info Estimated distance in miles from Byram's city center to Edgewood Health & Rehab's address, calculated via Google Maps.

Calculate Travel Distance to Edgewood Health & Rehab

Add your location

Address

Financial Assistance for
Nursing Home in Mississippi

Edgewood Health & Rehab is located in Byram, Mississippi.
Here are the financial assistance programs available to residents in Mississippi.

Get Financial aid guidance

Elderly and Disabled Waiver

Mississippi Medicaid E&D Waiver

Age 65+ or disabled
General Mississippi resident, Medicaid- eligible, nursing home-level care need.
Income Limits (2025) ~$2,829/month 300% FBR, individual
Asset Limits $4,000 individual, higher than most states
MS

Higher asset limit; rural focus.

Benefits
Personal care (5-7 hours/day) Respite (240 hours/year) Adult day care ($60/day) Meals ($6/meal)

Mississippi Caregiver Respite Program

MS NFCSP Respite

Age Caregiver of someone 60+
General Mississippi resident.
Income Limits No strict limit; prioritizes low-income.
Asset Limits Not applicable.
MS

Limited slots; rural emphasis.

Benefits
In-home respite (4-6 hours/day) Adult day care (~$60/day) Short-term facility care (up to 5 days)

Assisted Living (AL) Waiver

Mississippi Assisted Living Waiver

Age 65+ or disabled
General Mississippi resident, Medicaid-eligible, NFLOC, living in approved AL facility.
Income Limits (2025) ~$2,829/month (300% FBR, individual); QIT required.
Asset Limits $4,000 (individual), $6,000 (couple).
MS

Only for AL facilities with waiver contracts; small program size.

Benefits
Personal care Meals Medication management Respite Transportation within AL facility

Independent Living (IL) Waiver

Mississippi Independent Living Waiver

Age 16+ (65+ for seniors)
General Mississippi resident, Medicaid-eligible, NFLOC but capable of self-direction.
Income Limits (2025) ~$2,829/month (300% FBR, individual); QIT required.
Asset Limits $4,000 (individual), $6,000 (couple).
MS

Self-directed care; limited to in-home settings.

Benefits
Personal care (4-6 hours/day) Respite (~200 hours/year) Home mods Assistive tech Transition services

Medicare Savings Program (MSP)

Mississippi Medicare Savings Program

Age 65+ or disabled
General Mississippi resident, Medicare Part A/B.
Income Limits (2025) ~$2,510/month (QMB), ~$3,380/month (SLMB), ~$3,598/month (QI)—individual.
Asset Limits $9,430 (individual), $14,130 (couple).
MS

Three tiers; no waitlist; includes Extra Help for Part D.

Benefits
Covers Part B premiums ($174.70/month) Deductibles ($240/year) Copays (~20%)

Mississippi Homemaker Program

Mississippi Homemaker Program (via Area Agencies on Aging)

Age 60+
General Mississippi resident, not Medicaid-eligible, needs assistance with daily living.
Income Limits (2025) ~$1,063/month (100% FPL, individual); prioritizes low-income.
Asset Limits Not strictly assessed; need-based focus.
MS

10 AAAs; waitlist possible due to funding caps.

Benefits
Homemaker services (2-4 hours/day, e.g., cleaning, meal prep) Respite (~2 days/year) Transportation Meals

VA Aid and Attendance (A&A) and Housebound Benefits

Mississippi VA Aid and Attendance/Housebound

Age 65+ or disabled veteran/spouse
General Mississippi resident, wartime service, need for ADL help (A&A) or homebound.
Income Limits (2025) Net income < ~$1,984/month (veteran with dependent, A&A); pension offsets income.
Asset Limits ~$155,356 net worth limit
MS

High veteran population in rural areas.

Benefits
Cash (~$1,433-$2,642/month veteran, ~$951-$1,318 spouse) for care costs (e.g., in-home, assisted living)

Compare Nursing Home around Mississippi

The information below is reported by the Mississippi State Department of Health, Bureau of Health Facilities Licensure.

5 facilities compared · CMS & MS Dept. of Health data

Filter by care type
Billdora Senior Care
NH

Nursing Home Licensed facility providing 24/7 skilled nursing care for residents with complex, ongoing medical needs. Staffed by RNs, LPNs, and CNAs. Inspected and star-rated annually by CMS. Accepts Medicare (short-term rehab) and Medicaid (long-term care).

AL

Assisted Living A licensed, long-term care setting for seniors or individuals with disabilities who need help with daily activities — like bathing, dressing, and medication management — but not 24-hour skilled nursing. Offers housing, meals, and around-the-clock support while aiming to maximize resident independence.

Tylertown60 77.1% -6%5.14 -26%+11%$11.6k92.3149 41 -$6.3M$3.1M49.5%255243
Azalea Gardens Nursing Center
NH

Nursing Home Licensed facility providing 24/7 skilled nursing care for residents with complex, ongoing medical needs. Staffed by RNs, LPNs, and CNAs. Inspected and star-rated annually by CMS. Accepts Medicare (short-term rehab) and Medicaid (long-term care).

AL

Assisted Living A licensed, long-term care setting for seniors or individuals with disabilities who need help with daily activities — like bathing, dressing, and medication management — but not 24-hour skilled nursing. Offers housing, meals, and around-the-clock support while aiming to maximize resident independence.

Wiggins99 65.4% -21%4.32 -16%-7%$0133.3661 47 Avonna Cain$9.4M$4.3M45.8%255233
Attala County Nursing Center
NH

Nursing Home Licensed facility providing 24/7 skilled nursing care for residents with complex, ongoing medical needs. Staffed by RNs, LPNs, and CNAs. Inspected and star-rated annually by CMS. Accepts Medicare (short-term rehab) and Medicaid (long-term care).

AL

Assisted Living A licensed, long-term care setting for seniors or individuals with disabilities who need help with daily activities — like bathing, dressing, and medication management — but not 24-hour skilled nursing. Offers housing, meals, and around-the-clock support while aiming to maximize resident independence.

Kosciusko120 75.9% -8%4.03 -7%-13%$0184.52100 55 Amy Hood$8.8M$6.2M70%255191
Bedford Care Center of Mendenhall
NH

Nursing Home Licensed facility providing 24/7 skilled nursing care for residents with complex, ongoing medical needs. Staffed by RNs, LPNs, and CNAs. Inspected and star-rated annually by CMS. Accepts Medicare (short-term rehab) and Medicaid (long-term care).

AL

Assisted Living A licensed, long-term care setting for seniors or individuals with disabilities who need help with daily activities — like bathing, dressing, and medication management — but not 24-hour skilled nursing. Offers housing, meals, and around-the-clock support while aiming to maximize resident independence.

Mendenhall60 93.5% +14%4.59 +22%-1%$39.4k205.0356 40 Hattiesburg Medical Park Management Corp.$8.3M$3.8M45.4%255150
Edgewood Health & Rehab
NH

Nursing Home Licensed facility providing 24/7 skilled nursing care for residents with complex, ongoing medical needs. Staffed by RNs, LPNs, and CNAs. Inspected and star-rated annually by CMS. Accepts Medicare (short-term rehab) and Medicaid (long-term care).

AL

Assisted Living A licensed, long-term care setting for seniors or individuals with disabilities who need help with daily activities — like bathing, dressing, and medication management — but not 24-hour skilled nursing. Offers housing, meals, and around-the-clock support while aiming to maximize resident independence.

Byram119 92.8% +13%5.16 -32%+11%$116.8k443.712114 1 Rita Kelly$13.8M$6.2M45.3%255103

Frequently Asked Questions about Edgewood Health & Rehab

Is Edgewood Health & Rehab in a walkable area?

Edgewood Health & Rehab has a walk score of 1. Car-dependent. Most errands require a car, with limited nearby walkable options.

Who is the administrator of Edgewood Health & Rehab?

Darren Massey is the administrator of Edgewood Health & Rehab.

How many beds does Edgewood Health & Rehab have?

Edgewood Health & Rehab has 119 beds.

Are there photos of Edgewood Health & Rehab?

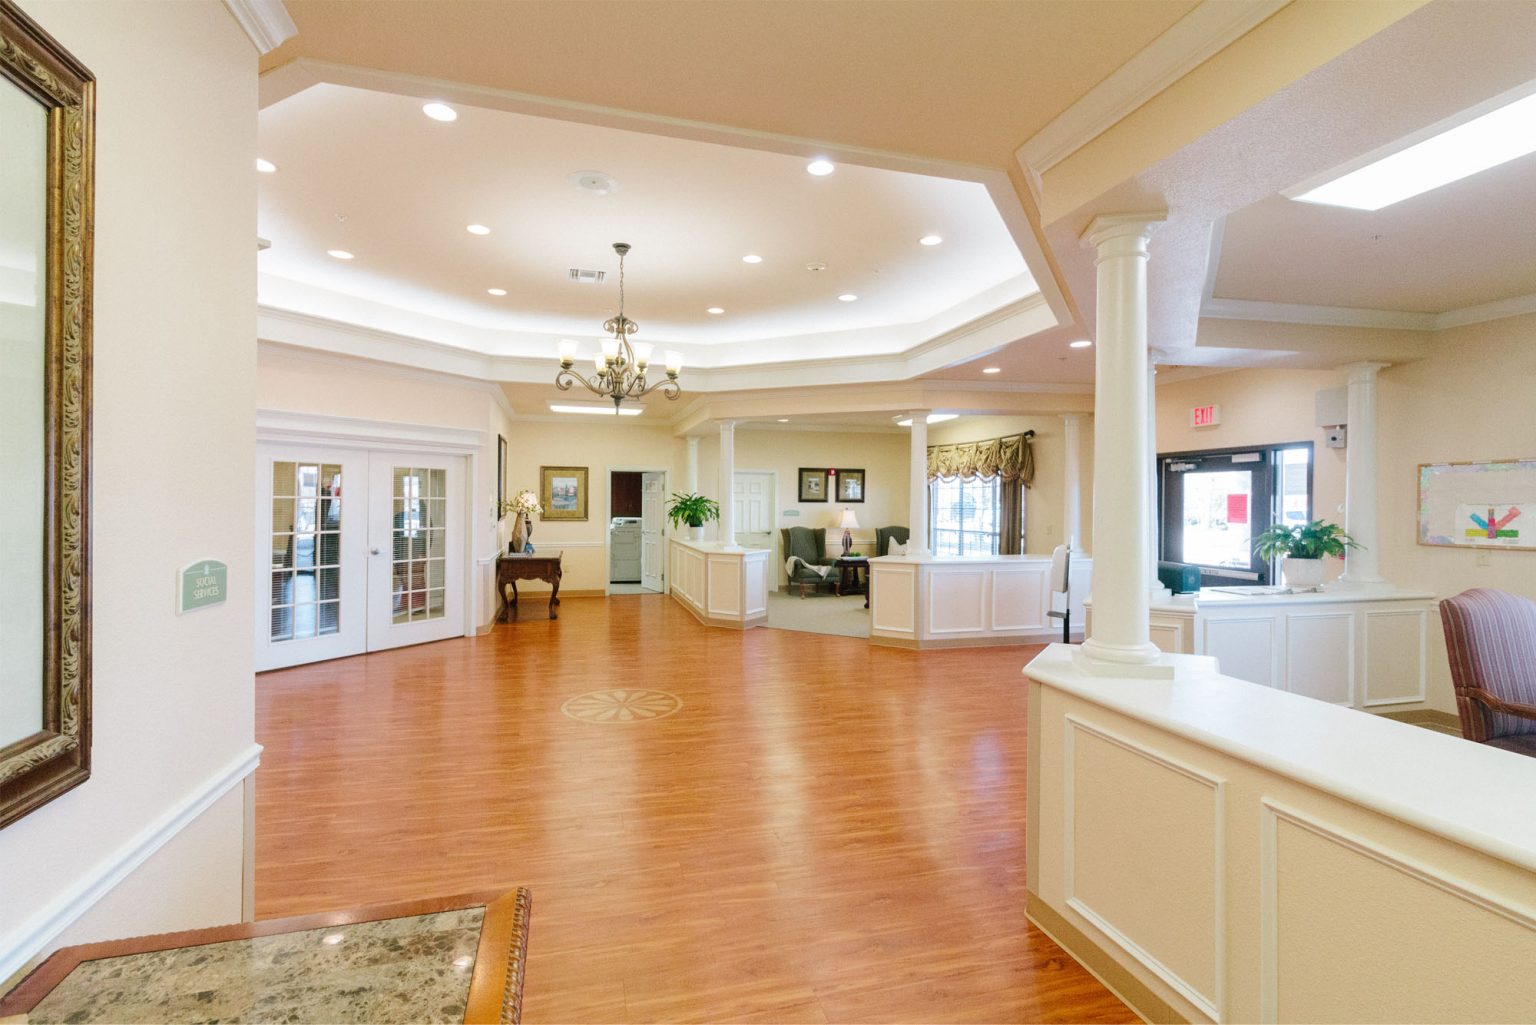
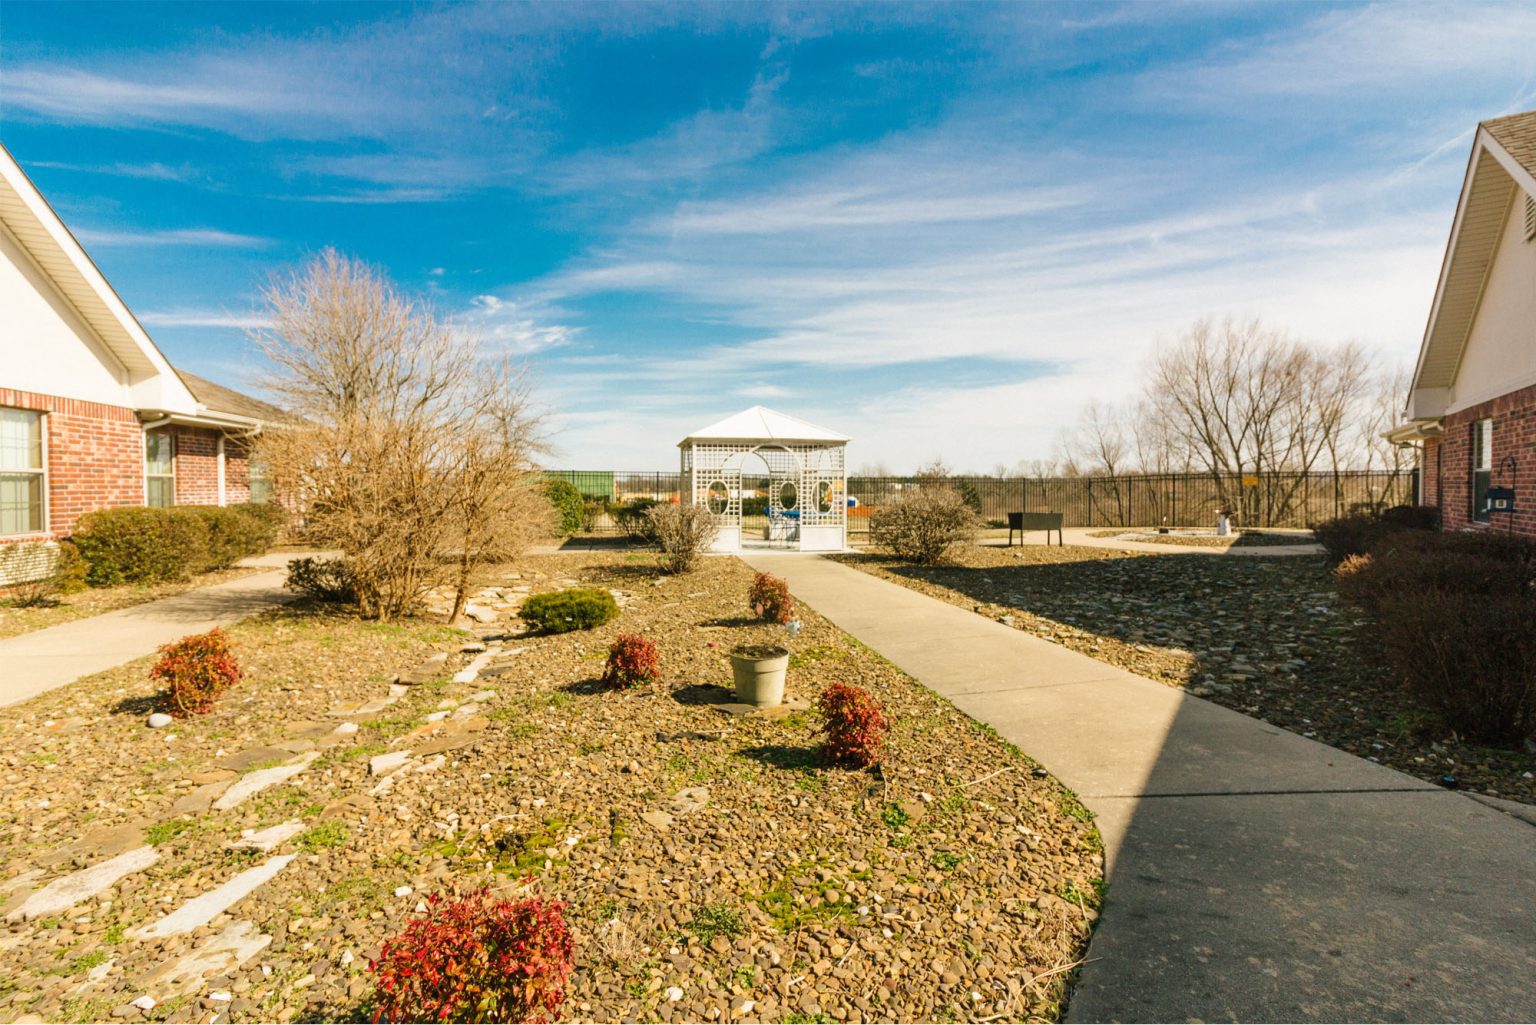
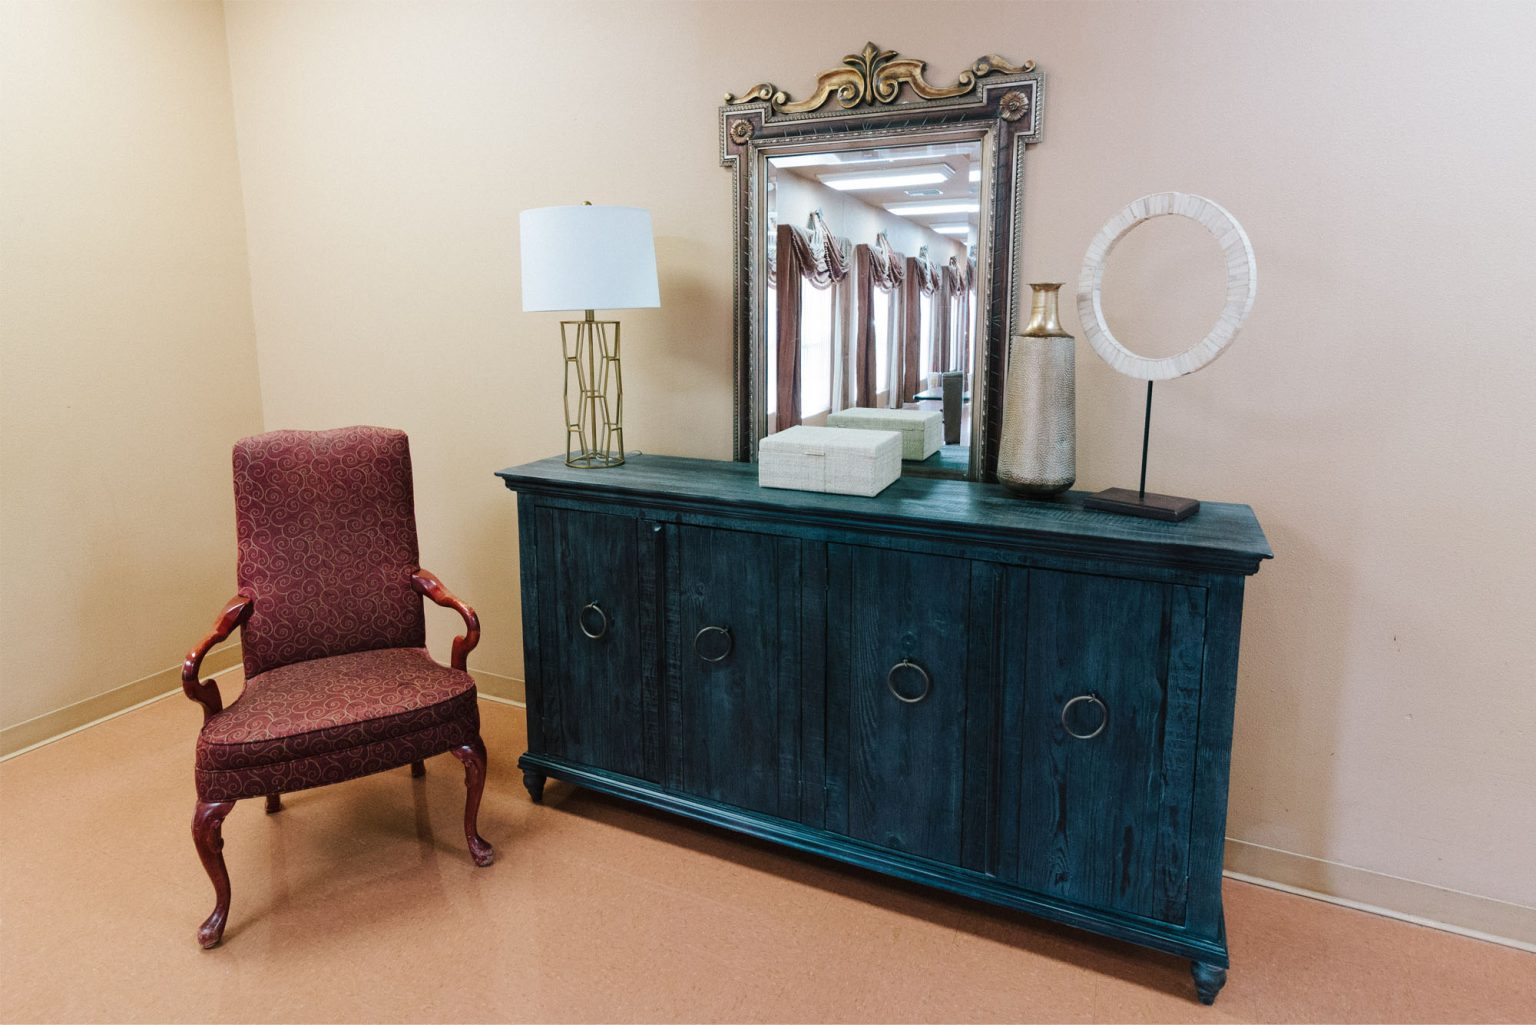
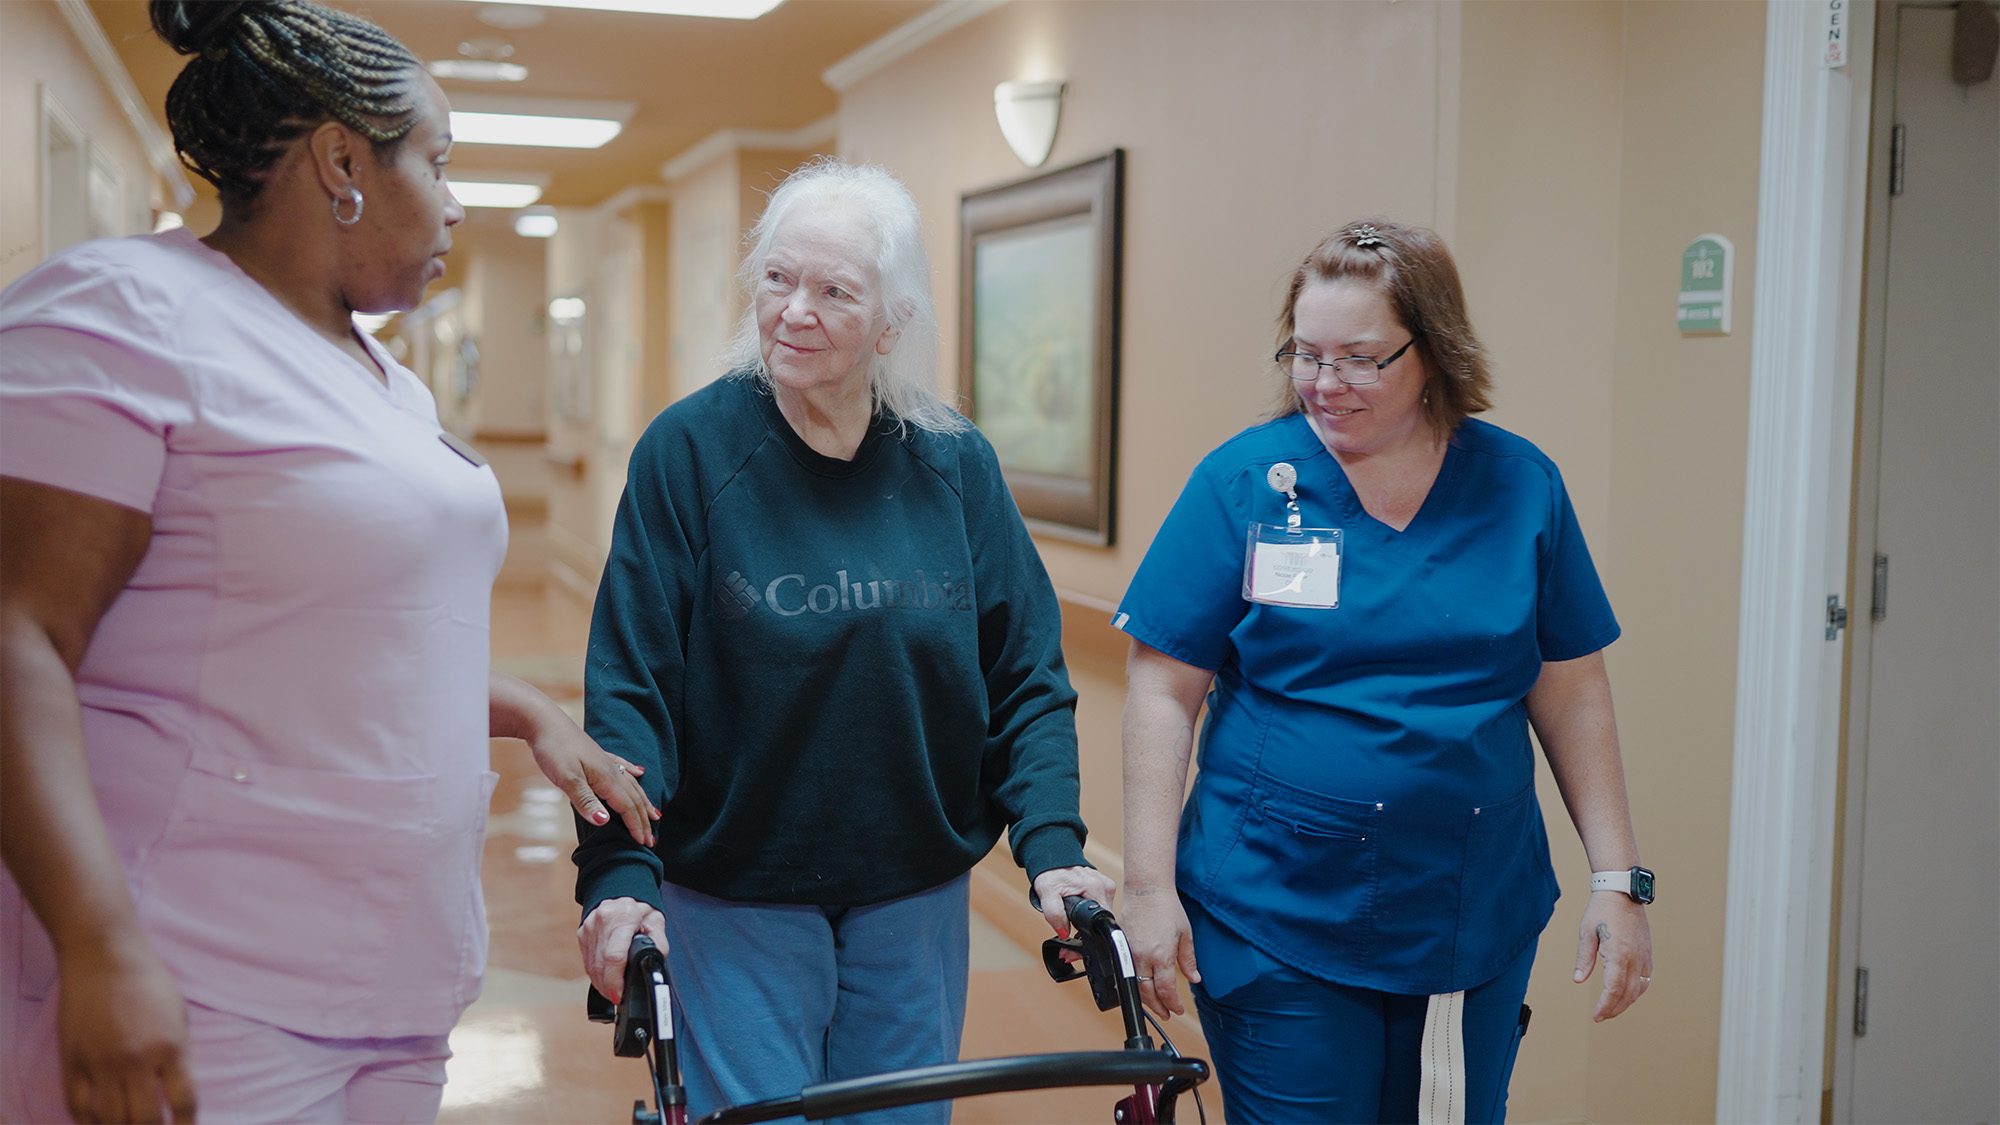
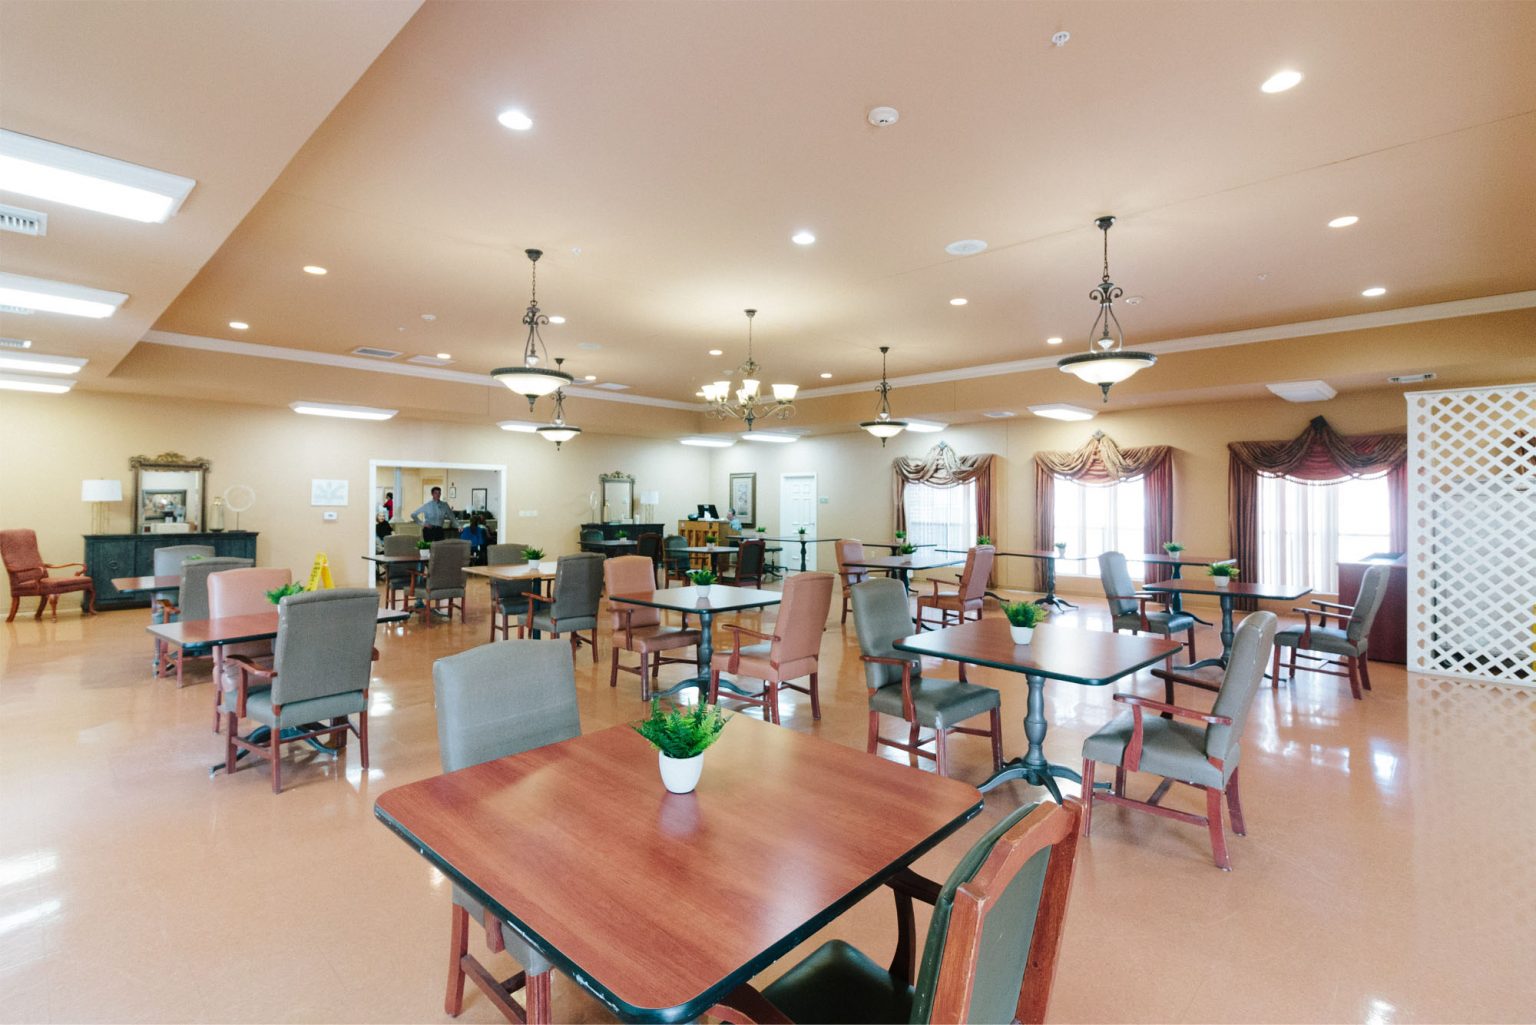
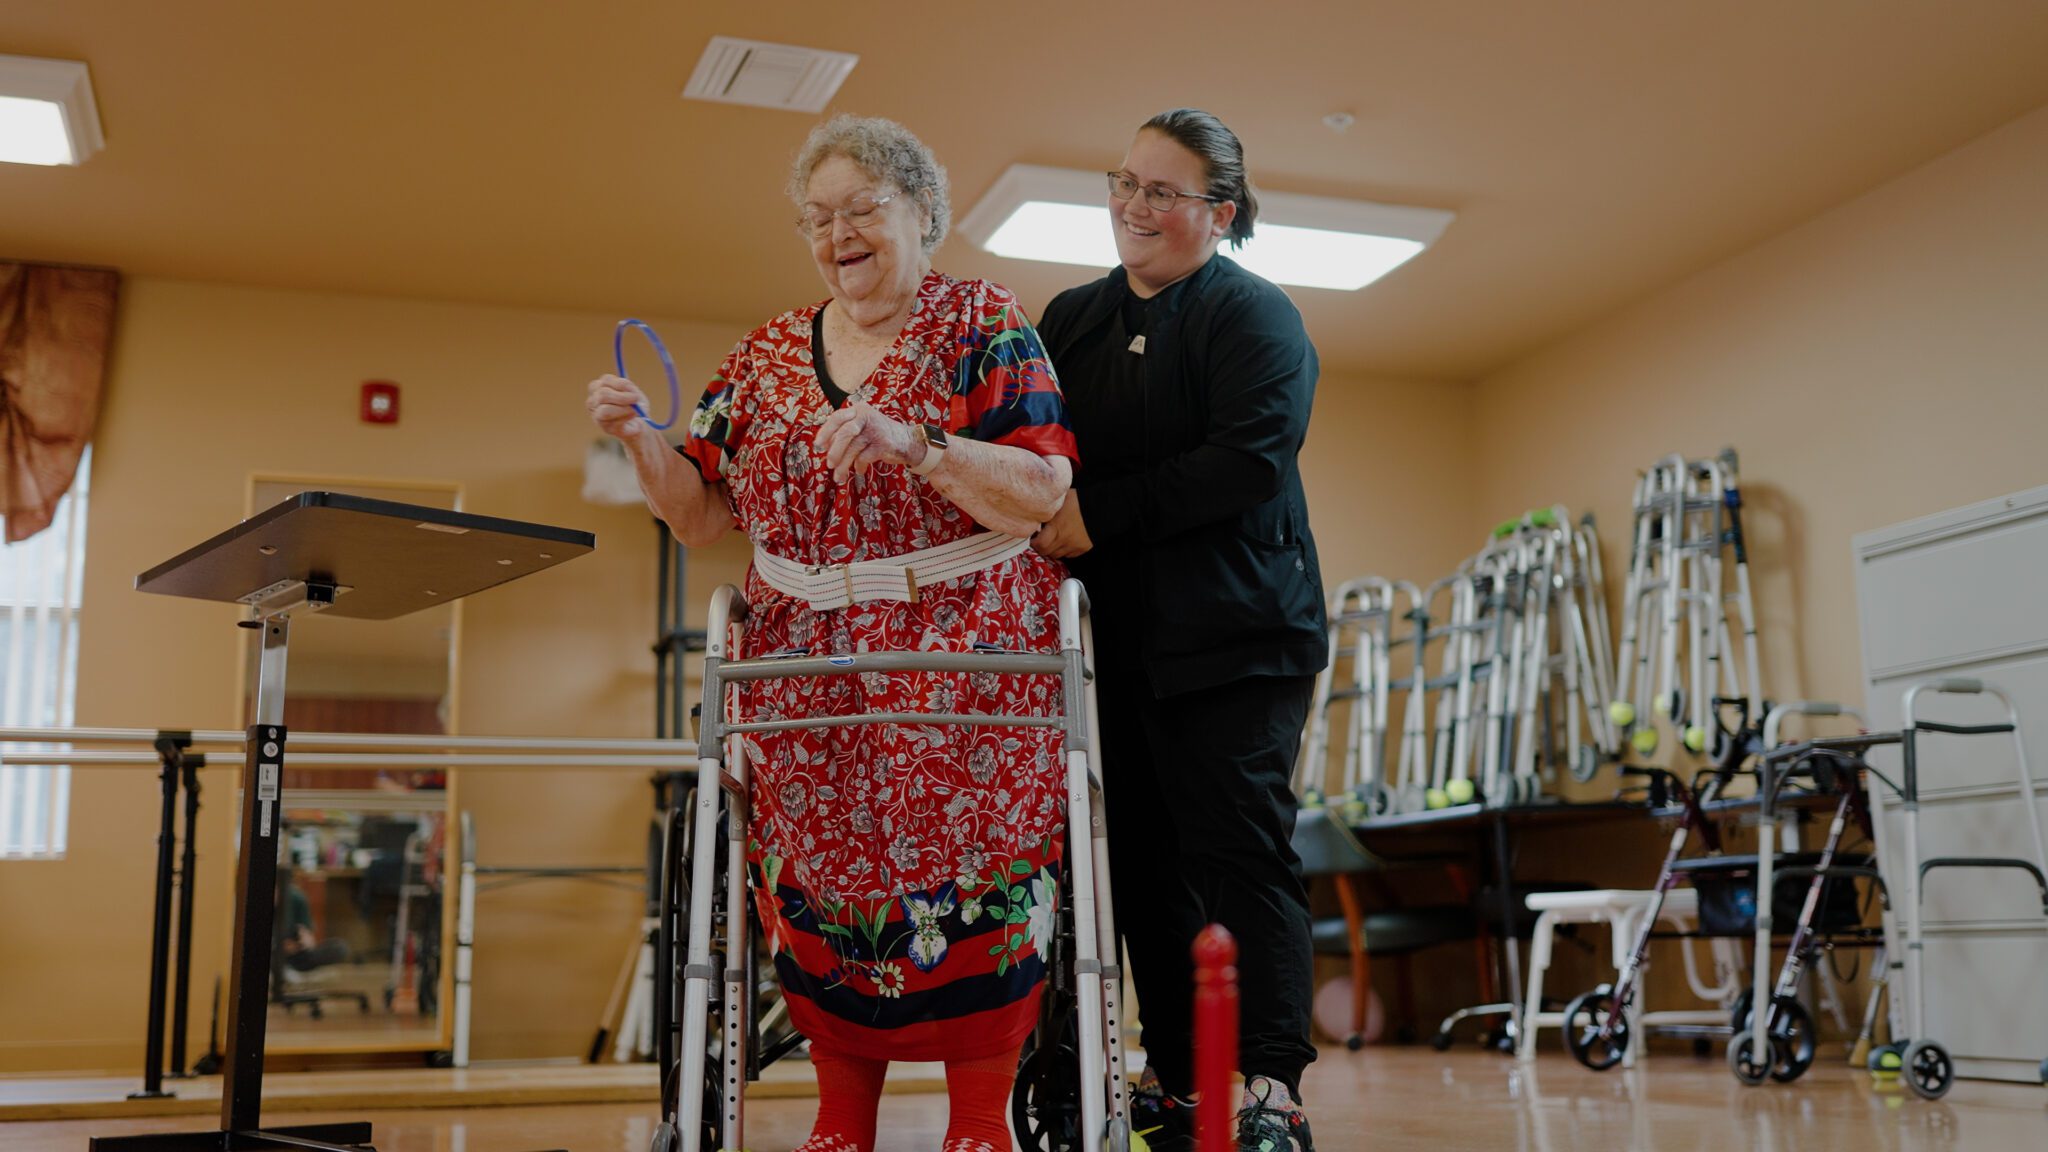
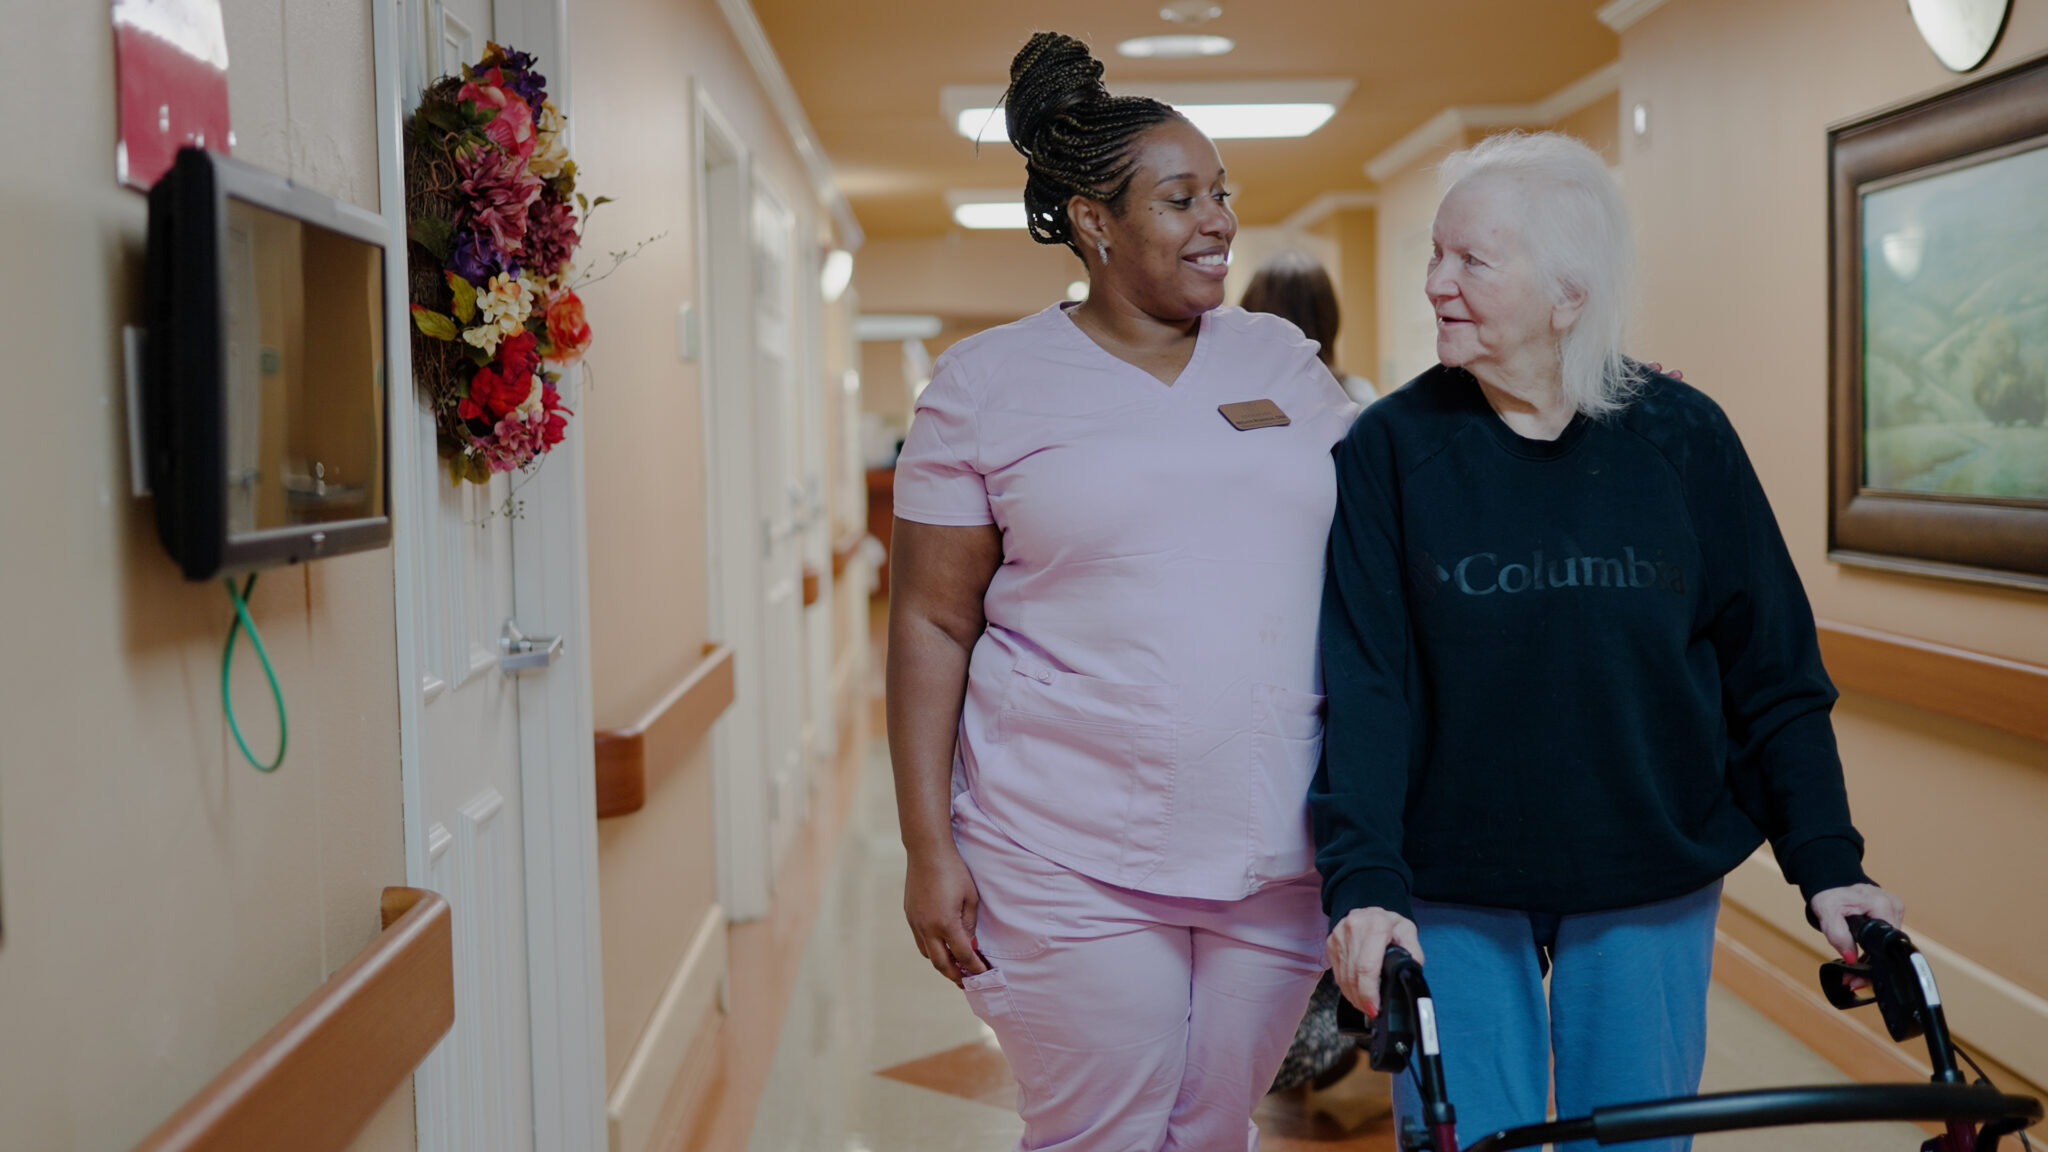
Yes — there are 14 photos of Edgewood Health & Rehab in the photo gallery on this page.

What is the address of Edgewood Health & Rehab?

Edgewood Health & Rehab is located at 205 Byram Parkway.

What is the phone number of Edgewood Health & Rehab?

(601) 362-5394 will put you in contact with the team at Edgewood Health & Rehab.

What county is Edgewood Health & Rehab located in?

Edgewood Health & Rehab is in Hinds County.

Guides for Better Senior Living

Care Cost Calculator: See Prices in Your Area

Nursing Home Data Explorer

Don’t Wait Too Long: 7 Red Flag Signs Your Parent Needs Assisted Living Now

The True Cost of Assisted Living in 2025 – And How Families Are Paying For It

Understanding Senior Living Costs: Pricing Models, Discounts & Financial Assistance

Explore Open Rooms
1 Contact details
2 What type of senior care service are you looking for?
3 What budget do you have in mind for senior care?
4 How soon do you need to find care?
5 Additional details

Thank you for your interest!

Our team will be in touch shortly to help with next steps.