Fir Lane Health & Rehabilitation Center

Nursing Home

Fir Lane Health & Rehabilitation Center

2430 N 13th St, Shelton, WA 98584 View Map
Nursing Home
icon
Care Cost Calculator: See Prices in Your Area Care Cost Calculator: See Prices in Your Area icon
Overview of Fir Lane Health & Rehabilitation Center

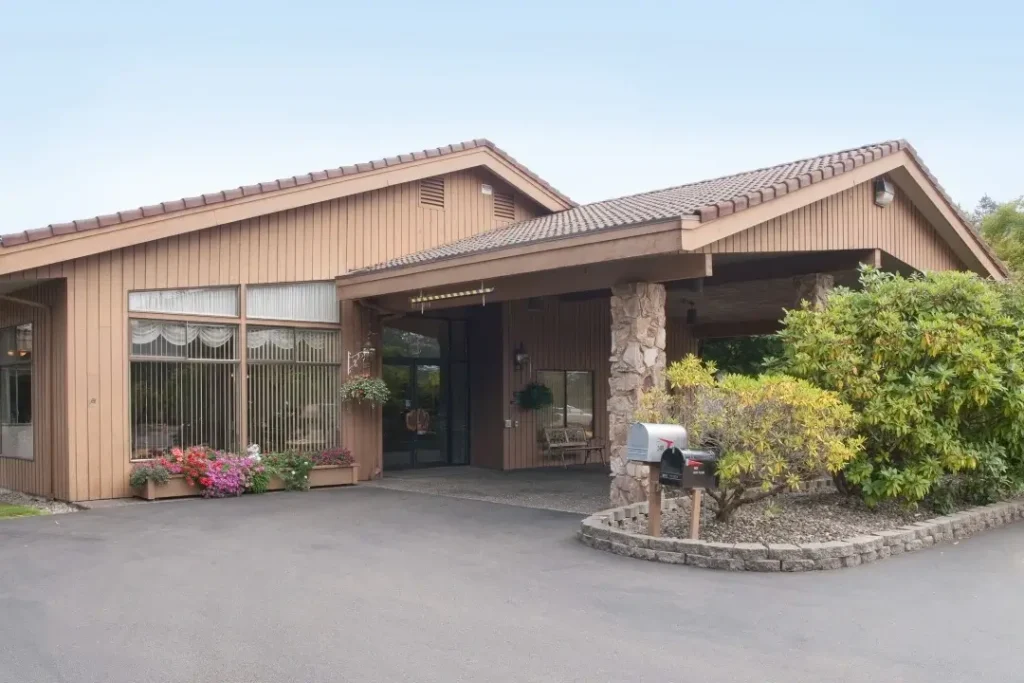
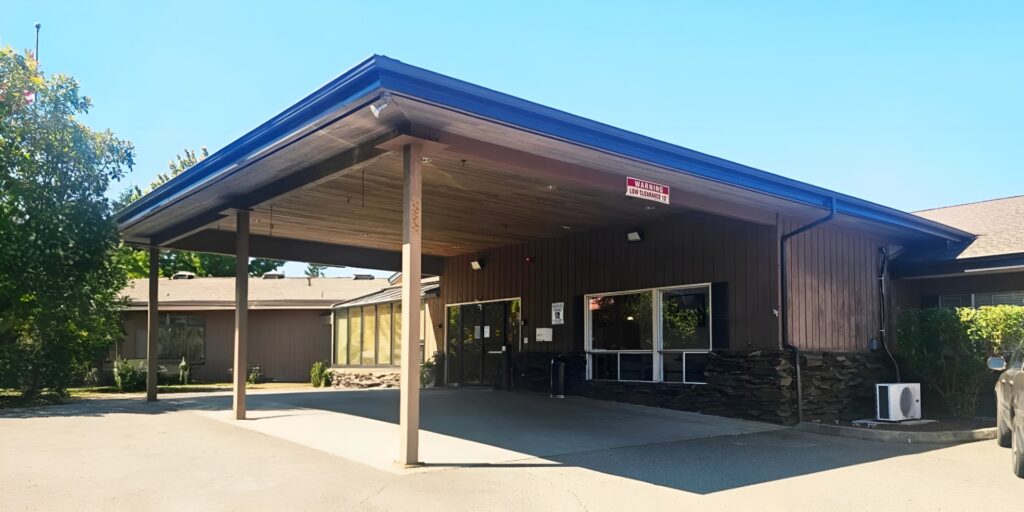
Fir Lane Health & Rehabilitation Center, operated by Caldera Care, is a leading provider of long-term skilled nursing care and short-term rehabilitation solutions, offering a full continuum of services and care focused around each individual in today’s ever-changing health care environment. The center, which has served Mason and the surrounding communities for over 25 years, is minutes away from historic downtown Shelton and conveniently located close to Mason General Hospital. Fir Lane Health & Rehabilitation Center is Medicare and Medicaid certified, ensuring that it meets the highest standards of care.

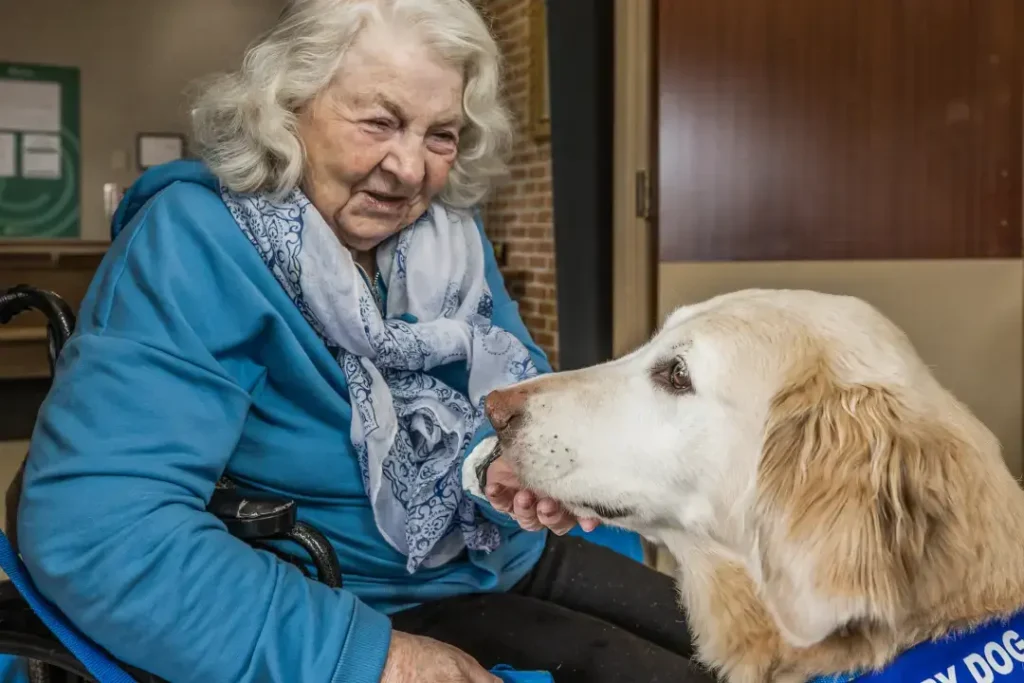
The 135-bed center offers a range of services, including physical therapy, speech therapy, nutritional support, occupational therapy, and wellness-focused activities. These services are designed to help residents regain their strength, mobility, and independence after an illness, injury, or surgery, while also providing ongoing care for those with chronic health conditions or disabilities. Fir Lane Health & Rehabilitation Center’s experienced staff deliver quality care while giving residents a serene, safe, and comfortable place to enjoy healing and rest.

Managed by Anne Loucks

Executive Director

Anne Loucks serves as the Executive Director at Fir Lane Health & Rehabilitation Center, bringing hands-on administration and leadership to the Shelton community. She oversees experienced staff and ensures quality care at the community, fostering a welcoming environment for residents and families.

Quality ratings

Measured by Centers for Medicare & Medicaid Services (CMS)

Overall rating Info Official CMS rating based on health inspections, staffing and quality measures.
1/5
Washington average: 3.2/5
Health Inspection Info Official CMS rating based on deficiencies found during state health inspections.
1/5
Washington average: 2.8/5
Staffing Info Official CMS rating based on nurse staffing hours per resident per day.
4/5
Washington average: 3.4/5
Quality Measures Info Official CMS rating based on clinical outcomes for residents.
2/5
Washington average: 3.9/5

Nursing care per resident

Info Average daily nursing hours per resident (adjusted for acuity). Higher values indicate more nursing time per resident.
4h 23m per day

This home provides 4% more nursing time per resident than the state average.

Washington average: 4h 13m per day

Staffing hours breakdown

Info Hours of care per resident per day, broken down by staff type. Data from CMS Medicare.
Staff type Facility State avg National avg
Registered Nurse (RN) Info Registered nurse hours per resident per day. 38m per day 53m per day 41m per day
LPN / LVN Info Licensed Practical Nurse / Licensed Vocational Nurse hours per resident per day. 58m per day 49m per day 52m per day
Nurse Aide Info Nurse aide hours per resident per day. 2h 39m per day 2h 41m per day 2h 21m per day
Total Nursing (Weekend) Info Total number of nurse staff hours per resident per day on weekends. 3h 43m per day 3h 47m per day 3h 26m per day
Physical Therapist Info Physical therapist staff hours per resident per day. 2m per day 5m per day 4m per day
RN (Weekend) Info Registered nurse hours per resident per day on weekends. 11m per day 38m per day 29m per day

Capacity and availability

Medium-capacity home

Offers a balance of services and community atmosphere.

Total beds 135

This home usually has availability

Lower occupancy suggests more openings may be available.

Lower demand than the Washington average
Occupancy rate 60%
Residents per day (avg) 83
Occupancy rate
60%
Residents per day (avg)
83

Who this home usually serves

TYPE OF STAY

Mostly short-term rehab stays

Most residents typically stay for a few weeks or months before returning home or moving on.

Might be optimal for
Short stays Recovery Medicare-covered care

Breakdown by payment type

Medicare

52% of new residents, usually for short-term rehab.

Typical stay 26 days

Private pay

36% of new residents, often for short stays.

Typical stay 1 - 2 months

Medicaid

12% of new residents, often for long-term daily care.

Typical stay 2 - 3 years

Finances and operations

Proprietary home
Corporation
Home revenue
$12.6M
Profit
$1.2M
Proprietary home Corporation
Home revenue
$12,584,857.00
Profit
$1,183,348.00
Payroll costs Info The portion of the home's budget spent on staff, including nurses, caregivers, and other employees who support care and operations.
$3.7M
29.7% of revenue
Other operating costs Info All remaining costs needed to run the home, such as food, utilities, building maintenance, supplies and administrative expenses.
$7.7M
Total costs $11.4M
Years in operation
8 years in operation
An established community with some operational experience and growing routines.
Walk Score
Walk Score: 23 / 100
Car-dependent. Most errands require a car, with limited nearby walkable options.
BBB Rating
BBB Rating: A+ (Not Accredited)
An independent rating from the Better Business Bureau based on factors such as complaint history, transparency, and business practices.
How BBB ratings work

About this community

Additional licensing details

CMS Certification Number: 505230

Staffing

Key information about the people who lead and staff this community.

Leadership

Contact: Ms. Donna Robinson, Executive Director

Care Services

Accepts Medicaid
Nursing Services
Rehabilitation Services
Memory Care
Skilled Nursing
Licensed Nurses/CNAs
Short-Term Rehab

Programs & Activities

Specific Programs
Secure memory care, Wound care, Long-term skilled nursing, Registered dietician/nutritional support, Short-term rehabilitation, Transportation to and from appointments, Speech therapy, IV therapy, Physical therapy, Enteral nutrition (tube feeding)

What does this home offer?

Building type icon
Building type icon

Building Type: Single-story

Fitness and recreation icon

Fitness and Recreation

Types of Care at Fir Lane Health & Rehabilitation Center

Skilled Nursing

Access & Eligibility

Ways to qualify for care at this community, including accepted programs and payment options.

Medicaid Accepted

This facility is certified for eligible Medicaid services.

Payment & Funding Options

Medicaid

Compare Nursing Homes around Bremerton

The information below is reported by the Washington Department of Social and Health Services, Residential Care Services.
Fir Lane Health & Rehabilitation Center
SNF

Nursing Homes 24/7 care needed

Shelton (Christmas Village)
135
No
A+
23
-
60.0%
$11,967,375.00
$3,742,253.00
31.3%
82.50
1/5
4.3853
1/5
4/5
2/5
3
79
4
-72%
+4%
-17%
Bremerton Trails Post Acute
SNF

Nursing Homes 24/7 care needed

Bremerton
125
No
-
62
-
74.7%
$13,912,593.00
$5,339,917.00
38.4%
81.40
1/5
4.3062
1/5
3/5
4/5
2
103
4
-67%
+2%
+3%
Bridgeview Care
SNF

Nursing Homes 24/7 care needed

Bremerton
-
No
-
22
-
74.7%
$13,912,593.00
$5,339,917.00
38.4%
81.40
1/5
4.3062
1/5
3/5
4/5
2
103
4
-67%
+2%
+3%
Emerald Bay Care
SNF

Nursing Homes 24/7 care needed

Bremerton
-
No
-
48
MASON, MONIQUE
73.3%
$10,827,119.00
$3,516,979.00
32.5%
64.30
1/5
3.9284
1/5
2/5
4/5
1
-
-
-
-7%
+1%

Places of interest near Fir Lane Health & Rehabilitation Center

Address 1.2 miles from city center — 0.38 miles to nearest hospital (Mason Health - Mason General Hospital)
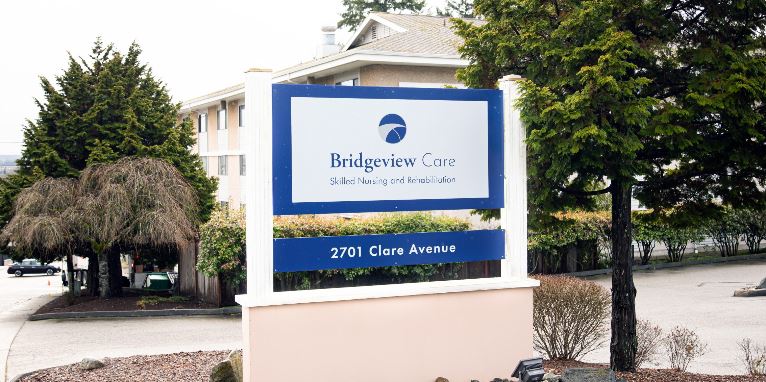
Address 2430 N 13th St, Shelton, WA 98584

Calculate Travel Distance to Fir Lane Health & Rehabilitation Center

Add your location

Address

Staffing Data

Source: CMS Payroll-Based Journal (Q2 2025)

203
Total Staff
143
Employees
60
Contractors
37,030
Total Hours (Quarter)
51
Avg Staff/Day
8
Avg Shift (hrs)
Nursing Staff Breakdown
Role Count Avg Shift (hrs) Uses Contractors?
Registered Nurse811.1 Yes
Licensed Practical Nurse379.4 Yes
Certified Nursing Assistant897.7 Yes
Staff by Category
Administration
3 staff
6hs shift avg
Nursing Staff
159 staff
8.3hs shift avg
Physicians & Practitioners
10 staff
8hs shift avg
Therapy Services
23 staff
5.3hs shift avg
Activities & Recreation
0 staff
0hs shift avg
Social Services
2 staff
2.7hs shift avg
Dietary Services
4 staff
7.6hs shift avg
Other Services
2 staff
7.6hs shift avg
Contractor Analysis
7.9%
of total hours from contractors
2,917 contractor hours this quarter
Certified Nursing Assistant: 41 Registered Nurse: 1 Licensed Practical Nurse: 15 Medical Director: 1 Occupational Therapy Assistant: 2
Role Employees Contractors Total Staff Total Hours Days Worked % of Days Avg Shift (hrs)
Certified Nursing Assistant48418914,75291100%7.7
Licensed Practical Nurse2215376,50891100%9.4
Nurse Aide in Training210214,67491100%7.9
Registered Nurse7182,46391100%11.1
Clinical Nurse Specialist8082,2237178%8
RN Director of Nursing4041,0066875%9.1
Other Dietary Services Staff2029899099%7.7
Speech Language Pathologist4048637582%7.1
Dietitian2026867380%7.4
Physical Therapy Aide6065998391%6.3
Mental Health Service Worker1014806167%7.9
Dental Services Staff1014245864%7.3
Occupational Therapy Aide3033885459%6.9
Administrator2023604549%8
Respiratory Therapy Technician4043035459%5.1
Physical Therapy Assistant4041496167%2
Nurse Practitioner2026489%8
Qualified Social Worker202431618%2.7
Occupational Therapy Assistant022332932%0.9
Medical Director011241921%1.3

Health Inspection History

Inspections
Total health inspections 16

Washington average 7.8


Last Health inspection on Aug 2025

Total health citations 79
Citations per inspection
4.94

Health citations are formal notices following inspections when they fail to comply with safety and care standards.

52 of 79 citations resulted from standard inspections; 26 of 79 resulted from complaint investigations; and 1 of 79 came from combined inspections (standard and complaint).

Breakdown of citation severity (last 3 years)
Critical Health citations More info 1
233% worse than Washington average

Washington average: 0.3


Serious Health citations More info 3
76% worse than Washington average

Washington average: 1.7

1 critical citation More info Washington average: 0.3

3 serious citations More info Washington average: 1.7

75 moderate citations More info Washington average: 46.3

0 minor citations More info Washington average: 0.5
Citations history (last 3 years)
Infection Control moderate citation Aug 21, 2025
Corrected

Pharmacy moderate citation Aug 21, 2025
Corrected

Resident Rights moderate citation Aug 21, 2025
Corrected

Abuse/Neglect moderate citation Jun 09, 2025
Corrected

Facility Characteristics

Source: CMS Long-Term Care Facility Characteristics (Data as of Jan 2026)

Ownership: For-Profit LLC
Part of: Caldera Care
Resident Census by Payment Source
76 Total Residents
Medicare 7 (9.2%)
Medicaid 63 (82.9%)
Private Pay/Other 6 (7.9%)
Programs & Services
Residents' Group
Family Engagement

Active councils help families stay involved in care decisions and facility operations.

Quality of care over time

These measures show how residents usually do over time at this home, based on health outcomes and preventive care.

High-risk clinical events score Info A composite score based on pressure ulcers, falls with injury, weight loss, walking ability decline, and activities of daily living decline. 11.9
19% worse than Washington average

Washington average: 10.0

Functional decline score Info A composite score based on activities of daily living decline, walking ability decline, and incontinence. 21.0
In line with Washington average

Washington average: 20.9

Long-stay resident measures
Need for Help with Daily Activities Increased Info Percent of long-stay residents whose need for help with daily activities has increased 17.7%
8% worse than Washington average

Washington average: 16.4%

Walking Ability Worsened Info Percent of long-stay residents whose ability to move independently worsened 18.8%
14% better than Washington average

Washington average: 21.8%

Low Risk Residents with Bowel/Bladder Incontinence Info Percent of low risk long-stay residents who lose control of their bowels or bladder 26.5%
9% worse than Washington average

Washington average: 24.3%

Falls with Major Injury Info Percent of long-stay residents experiencing one or more falls with major injury 2.6%
In line with Washington average

Washington average: 2.6%

High Risk Residents with Pressure Ulcers Info Percent of long-stay high risk residents with pressure ulcers 12.7%
158% worse than Washington average

Washington average: 4.9%

Urinary Tract Infection Info Percent of long-stay residents with a urinary tract infection 1.5%
12% better than Washington average

Washington average: 1.7%

Lost Too Much Weight Info Percent of long-stay residents who lose too much weight 7.8%
34% worse than Washington average

Washington average: 5.8%

Depressive Symptoms Info Percent of long-stay residents who have depressive symptoms 7.4%
54% better than Washington average

Washington average: 16.2%

Antipsychotic Use Info Percent of long-stay residents who received an antipsychotic medication 36.7%
153% worse than Washington average

Washington average: 14.5%

Pneumococcal Vaccine Info Percent of long-stay residents assessed and appropriately given the pneumococcal vaccine 92.1%
In line with Washington average

Washington average: 96.2%

Influenza Vaccine Info Percent of long-stay residents assessed and appropriately given the seasonal influenza vaccine 92.2%
In line with Washington average

Washington average: 93.8%

Hospitalizations per 1,000 days Info Number of hospitalizations per 1,000 long-stay resident days. 0.68
51% better than Washington average

Washington average: 1.38

ED visits per 1,000 days Info Number of outpatient emergency department visits per 1,000 long-stay resident days. 1.74
15% worse than Washington average

Washington average: 1.51

Short-stay resident measures
Pneumococcal Vaccine Info Percent of short-stay residents assessed and appropriately given the pneumococcal vaccine 68.7%
22% worse than Washington average

Washington average: 88.1%

Antipsychotic medication increase Info Percent of short-stay residents who newly received an antipsychotic medication 2.7%
91% worse than Washington average

Washington average: 1.4%

Influenza Vaccine Info Percent of short-stay residents assessed and appropriately given the seasonal influenza vaccine 51.5%
37% worse than Washington average

Washington average: 82.0%

Re-hospitalized after SNF stay Info Percentage of short-stay residents who were re-hospitalized after their nursing home admission. 24.8%
25% worse than Washington average

Washington average: 19.9%

Emergency department visits Info Percentage of short-stay residents who had an outpatient emergency department visit. 15.3%
16% worse than Washington average

Washington average: 13.2%

Falls with major injury Info Percentage of SNF residents who experience falls with major injury during their stay. 0.0%
100% better than Washington average

Washington average: 0.8%

Ability to care for self at discharge Info Percentage of residents at or above expected ability to care for themselves at discharge. 66.1%
23% better than Washington average

Washington average: 53.7%

Successful return to home or community Info Rate of successful return to home or community from a skilled nursing facility. 32.9%
35% worse than Washington average

Washington average: 50.6%

Penalties and fines

Federal penalties imposed by CMS for regulatory violations, including civil money penalties (fines) and denials of payment for new Medicare/Medicaid admissions.

Source: CMS Penalties Database (Data as of Jan 2026)

Total fines amount $139K
70% higher than Washington average

Washington average: $82K

Number of fines 3
62% more fines than Washington average

Washington average: 1.8

Payment Denials Info Serious action where Medicare and/or Medicaid temporarily stops payments for new residents until issues are fixed. 0
100% fewer payment denials than Washington average

Washington average: 0.3

Fines amount comparison
This facility $139K
Washington average $82K
Penalty History

Penalties are imposed by CMS for violations of federal nursing home regulations.

Civil Money Penalty Info Fines imposed for noncompliance, which can be assessed per day or per instance of violation. Feb 21, 2025
$75K
Civil Money Penalty Info Fines imposed for noncompliance, which can be assessed per day or per instance of violation. Nov 7, 2024
$46K
Civil Money Penalty Info Fines imposed for noncompliance, which can be assessed per day or per instance of violation. Apr 28, 2023
$17K

Last updated: Jan 2026

Guides for Better Senior Living

Care Cost Calculator: See Prices in Your Area

Nursing Home Data Explorer

Don’t Wait Too Long: 7 Red Flag Signs Your Parent Needs Assisted Living Now

The True Cost of Assisted Living in 2025 – And How Families Are Paying For It

Understanding Senior Living Costs: Pricing Models, Discounts & Financial Assistance

Financial Aid for Washington Seniors

Get financial aid guidance

Community Options Program Entry System (COPES)

WA Medicaid COPES

Age 65+ or disabled, Washington resident, Medicaid-eligible, nursing home-level care need.

~$2,829/month (300% FBR, individual).

$2,000 (individual), $3,000 (couple).

High demand in urban areas (e.g., Seattle).

Washington Family Caregiver Support Program

WA NFCSP

Caregiver of someone 60+ (or with dementia), Washington resident.

No strict limit; prioritizes low-income.

Not applicable.

High urban demand; rural outreach.

Community First Choice (CFC)

Washington Community First Choice

Age 65+ (or disabled 18+), WA resident, Medicaid-eligible, need help with 2+ ADLs/IADLs.

~$2,829/month; QIT optional.

$2,000 (individual), $3,000 (couple).

Broader than COPES; serves ~20,000; self-directed option.

Older Americans Act (OAA) Services

Washington OAA Services

Age 60+, WA resident; no income/asset limits.

None; donations encouraged.

Not assessed.

13 AAAs; includes Meals on Wheels; rural focus.

Medicare Savings Program (MSP)

Washington Medicare Savings Program

Age 65+ or disabled, WA resident, Medicare Part A/B.

~$2,510/month (QMB), ~$3,380/month (SLMB), ~$3,598/month (QI)—individual.

$9,430 (individual), $14,130 (couple).

Includes Extra Help for Part D; no waitlist.

Low-Income Home Energy Assistance Program (LIHEAP)

Washington LIHEAP

Age 60+ prioritized, WA resident, low-income household.

~$3,970/month (185% FPL).

Not assessed.

Covers gas, electric, wood; emergency aid available.

Senior Community Service Employment Program (SCSEP)

Washington SCSEP

Age 55+, unemployed, low-income, WA resident.

~$1,983/month (125% FPL).

Not specified.

Priority for veterans, rural residents; AARP partnership.

VA Aid and Attendance (A&A) and Housebound Benefits

Washington VA Aid and Attendance/Housebound

Age 65+ or disabled veteran/spouse, WA resident, wartime service, ADL help (A&A) or homebound.

Net income < ~$1,984/month (veteran with dependent, A&A); pension offsets income.

~$155,356 (net worth).

High veteran use; supports rural/urban needs.

Senior Citizens Property Tax Exemption

Washington Senior Property Tax Exemption

Age 61+ or disabled retiree, WA resident, homeowner, income-based.

~$45,000-$70,000/year (varies by county, e.g., King: $70,000).

Not assessed; home value cap varies (~$250,000-$400,000).

Saves ~$500-$1,500/year; offered statewide.

Senior Farmers’ Market Nutrition Program (SFMNP)

Washington SFMNP

Age 60+, WA resident, low-income.

~$2,322/month (185% FPL).

Not assessed.

Vouchers (~$80/season); serves ~20,000 via AAAs.

Who we are

Your Senior Care Partner, Every Step of the Way

We help families find affordable senior communities and unlock same day discounts, Medicaid, and Medicare options tailored to your needs.

Contact us Today