Fir Lane Health & Rehabilitation Center

Nursing Home in Bremerton

CMS overall rating Info The Overall CMS Rating is scored from 1 to 5 stars and combines results from health inspections, staffing levels, and quality measures. Health inspections carry the most weight. Staffing and quality scores can increase or decrease the final rating based on performance compared to state and national standards.

Overview of Fir Lane Health & Rehabilitation Center

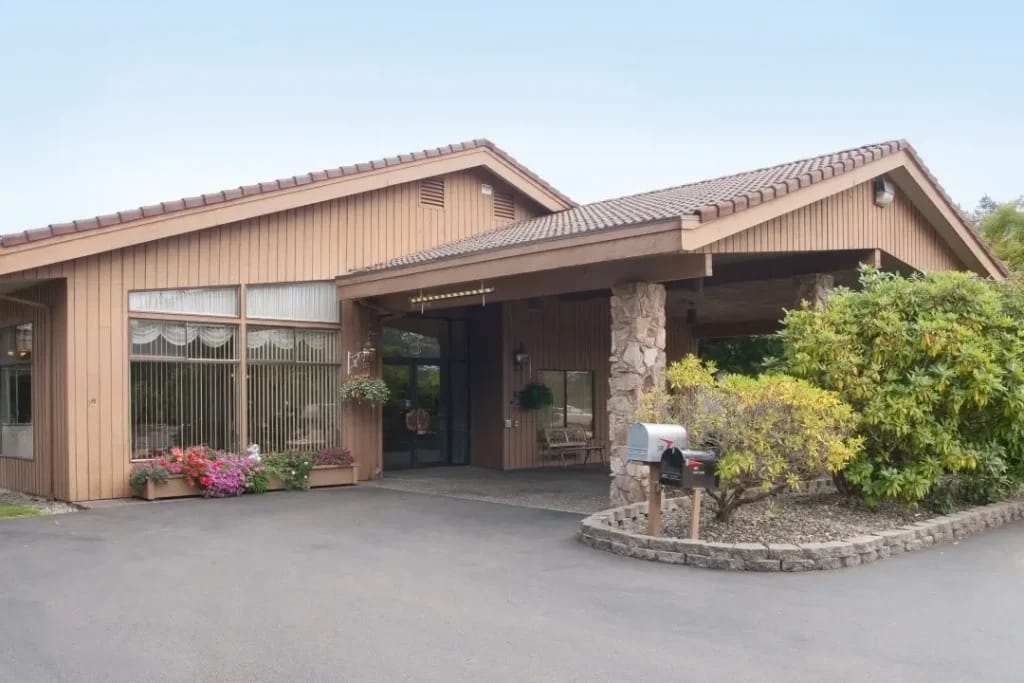
Fir Lane Health & Rehabilitation Center, operated by Caldera Care, is a leading provider of long-term skilled nursing care and short-term rehabilitation solutions, offering a full continuum of services and care focused around each individual in today’s ever-changing health care environment. The center, which has served Mason and the surrounding communities for over 25 years, is minutes away from historic downtown Shelton and conveniently located close to Mason General Hospital. Fir Lane Health & Rehabilitation Center is Medicare and Medicaid certified, ensuring that it meets the highest standards of care.

The 135-bed center offers a range of services, including physical therapy, speech therapy, nutritional support, occupational therapy, and wellness-focused activities. These services are designed to help residents regain their strength, mobility, and independence after an illness, injury, or surgery, while also providing ongoing care for those with chronic health conditions or disabilities. Fir Lane Health & Rehabilitation Center’s experienced staff deliver quality care while giving residents a serene, safe, and comfortable place to enjoy healing and rest.

Managed by Anne Loucks

Executive Director

Anne Loucks serves as the Executive Director at Fir Lane Health & Rehabilitation Center, bringing hands-on administration and leadership to the Shelton community. She oversees experienced staff and ensures quality care at the community, fostering a welcoming environment for residents and families.

Quality ratings

Measured by Centers for Medicare & Medicaid Services (CMS)

Overall rating Info The Overall CMS Rating combines results from health inspections, staffing levels and quality measures. Health inspections carry the most weight. Staffing and quality scores can increase or decrease the final rating based on performance compared to state and national standards.
1/5 ▼ 2.5 Washington average: 3.5/5
Health Inspection Info Based on the results of the facility's three most recent standard inspections and any complaint investigations. CMS reviews the number, scope, and severity of deficiencies, with more recent findings weighted more heavily.
1/5 ▼ 1.9 Washington average: 2.9/5
Staffing Info Measures average nursing staff hours per resident per day, including Registered Nurses (RNs) and total nursing staff. Ratings are adjusted based on the level of care residents require and are compared to state and national benchmarks.
4/5 ▲ 0.2 Washington average: 3.9/5
Quality Measures Info Based on clinical and physical health indicators reported to CMS, such as hospital readmissions, falls, pressure ulcers, and improvements in mobility. These measures reflect how well residents' health needs are being managed.
2/5 ▼ 2.1 Washington average: 4.1/5

Staffing hours breakdown

Info Daily nursing hours per resident by staff type, reported to CMS. Higher is generally better — compare this facility to state and national averages to see where staffing stands.

Hours per resident per day — compared to Washington state averages

Total nursing care / resident Info This home is ranked 23rd out of 66 homes in Washington.

Total adjusted nursing hours per resident per day, combining RN, LPN, and aide time. CMS adjusts this for case-mix so facilities can be fairly compared.
4h 23m per day
Rank #23 / 66Nurse hours — state benchmarkedThis home is ranked 23rd out of 66 homes in Washington.Shows adjusted nurse hours per resident per day benchmarked to the Washington average, with a ranking across 66 Washington SNFs. More hours mean more direct care. The national average is about 3.5 hrs; below 3.0 is a red flag.
This facility Washington avg (4h 22m per day)
vs Washington avg
+1%

4 of 6 metrics below state avg

Standout metric LPN / LVN is +18% above state avg
Staff typeHours / dayvs state avg
Registered Nurse (RN) Info RNs hold the highest nursing license and can assess residents, interpret test results, and direct care plans. More RN hours per day often signals stronger clinical oversight and faster response to health changes. 38m per day ▼ 28% State avg: 53m per day · National avg: 41m per day
LPN / LVN Info Licensed Practical Nurses (LPNs) or Licensed Vocational Nurses (LVNs) deliver routine hands-on care — medication administration, wound dressing, and monitoring vital signs. They work under RN supervision and make up a large share of daily bedside care. 58m per day ▲ 18% State avg: 49m per day · National avg: 52m per day
Nurse Aide Info Certified Nurse Aides (CNAs) provide the most direct day-to-day assistance: bathing, dressing, feeding, and mobility. Nurse aide hours are typically the largest staffing category and directly affect residents' quality of life. 2h 39m per day ■ Avg State avg: 2h 41m per day · National avg: 2h 21m per day
Total Nursing (Weekend) Info Combined nursing hours (RN + LPN + Nurse Aide) per resident per day on weekends. Staffing often drops on weekends — this figure reveals whether the facility maintains adequate coverage outside of weekday hours. 3h 40m per day ▼ 3% State avg: 3h 47m per day · National avg: 3h 26m per day
Physical Therapist Info Hours per resident per day provided by licensed Physical Therapists (PTs) or PT Assistants. PT services help residents recover mobility after injury or illness and are especially important for post-acute (short-stay) rehabilitation. 2m per day ▼ 60% State avg: 5m per day · National avg: 4m per day
RN (Weekend) Info Registered nurse hours specifically on weekends. Facilities sometimes reduce RN presence on Saturdays and Sundays — a low weekend RN figure compared to weekday hours can indicate reduced clinical oversight when most administrative staff are absent. 11m per day ▼ 71% State avg: 38m per day · National avg: 29m per day

Capacity and availability

This home usually has availability

Occupancy lower than 85% suggests more openings may be available.

Lower occupancy than the Washington average: 72.5%
Occupancy rate 60% Rank #60 / 69Occupancy rate — state benchmarkedThis home is ranked 60th out of 69 homes in Washington.Shows this facility's occupancy rate versus the Washington average, with its statewide rank out of 69. Higher occupancy signals strong local demand and financial stability.
Avg. Length of Stay 128 days
Occupancy rate
60% Rank #60 / 69Occupancy rate — state benchmarkedThis home is ranked 60th out of 69 homes in Washington.Shows this facility's occupancy rate versus the Washington average, with its statewide rank out of 69. Higher occupancy signals strong local demand and financial stability.
Avg. Length of Stay
128 days

Who this home usually serves

TYPE OF STAY

Mostly short-term rehab stays

Most residents typically stay for a few weeks or months before returning home or moving on.

Might be optimal for
Short stays Recovery Medicare-covered care

Breakdown by payment type

Medicare

52% of new residents, usually for short-term rehab.

Typical stay 26 days

Private pay

36% of new residents, often for short stays.

Typical stay 1 - 2 months

Medicaid

12% of new residents, often for long-term daily care.

Typical stay 2 - 3 years

Finances and operations

Privately-owned community
Operated by a business corporation.
Home revenue
$12.6M
Profit
$1.2M
Privately-owned community Operated by a business corporation.
Home revenue
$12.6M Rank #42 / 68Revenue — state benchmarkedThis home is ranked 42nd out of 68 homes in Washington.Shows this facility's annual revenue compared to the Washington SNF average. Higher revenue generally means more resources for staffing and capital — read alongside Payroll %.
Profit
$1.2M
Payroll costs Info The portion of the home's budget spent on staff, including nurses, caregivers, and other employees who support care and operations. Rank #56 / 68Payroll — state benchmarkedThis home is ranked 56th out of 68 homes in Washington.Shows total annual staff payroll benchmarked to the Washington average. Higher payroll investment relative to peers often signals better staffing and less reliance on cheaper contract labor.
$3.7M
29.7% of revenue Rank #59 / 68Payroll % — state benchmarkedThis home is ranked 59th out of 68 homes in Washington.Shows payroll as a percentage of revenue versus the Washington average. Well-run SNFs often land around 55–65%. Below 25% may signal understaffing or heavy agency use — read with Staffing ratings.
Other operating costs Info All remaining costs needed to run the home, such as food, utilities, building maintenance, supplies and administrative expenses.
$7.7M
Total costs $11.4M
Years in operation
8 years in operation
An established community with some operational experience and growing routines.
Walk Score
Walk Score: 23 / 100 Rank #48 / 59Walk Score — state benchmarkedThis home is ranked 48th out of 59 homes in Washington.Shows how walkable this facility's neighborhood is compared to the average Walk Score across Washington SNFs. Higher scores benefit residents, families, and staff.
Car-dependent. Most errands require a car, with limited nearby walkable options.
BBB Rating
BBB Rating: A+ (Not Accredited)
An independent rating from the Better Business Bureau based on factors such as complaint history, transparency, and business practices.
How BBB ratings work

About this community

License Details

CMS Certification Number505230

Staffing

Key information about the people who lead and staff this community.

Leadership

ContactMs. Donna Robinson, Executive Director

Payment & Insurance

1 service
Accept Medicaid

Therapy & Rehabilitation

2 services
Rehabilitation Services
Short-Term Rehab

Amenities & Lifestyle

Specific ProgramsSecure memory care, Wound care, Long-term skilled nursing, Registered dietician/nutritional support, Short-term rehabilitation, Transportation to and from appointments, Speech therapy, IV therapy, Physical therapy, Enteral nutrition (tube feeding)

What does this home offer?

Building type icon
Building type icon

Building Type: Single-story

Fitness and recreation icon

Fitness and Recreation

Types of Care at Fir Lane Health & Rehabilitation Center

Skilled Nursing

Contact Fir Lane Health & Rehabilitation Center

Access & Eligibility

Ways to qualify for care at this community, including accepted programs and payment options.

Medicaid Accepted

This facility is certified for eligible Medicaid services.

Payment & Funding Options

Medicaid

Inspection History

In Washington, the Department of Social and Health Services, Residential Care Services conducts unannounced inspections and issues reports on the quality of care in all licensed settings.

16 visits/inspections Info Inspections are mandatory, regular evaluations conducted by state health departments or regulatory agencies. They ensure the community provides safe, compliant care, covering areas like resident health, staff and management.

Washington average: 8 complaint visits

Washington average: 9 inspections

Latest inspection

Date August 21, 2025
Complaint Investigation

79 deficiencies

Deficiencies indicate regulatory issues. A higher number implies the facility had several areas requiring improvement.

Washington average: 31 deficiencies

Inspection Report Summary for Fir Lane Health & Rehabilitation Center

The most recent inspection on August 21, 2025, identified deficiencies related to failure to notify a resident’s representative of multiple falls, inaccurate documentation and reconciliation of controlled substances, and inadequate hand hygiene during medication administration. Earlier inspections showed a pattern of issues involving resident rights, medication management, care plan implementation, infection control, and safety, with multiple substantiated complaint investigations. Notable concerns included delayed abuse reporting, incomplete care plans, medication errors, environmental hazards leading to injuries, and insufficient supervision. Enforcement actions such as an Immediate Jeopardy were noted in December 2024 due to a resident burn injury, but the facility took corrective steps to remove the jeopardy. The inspection history indicates ongoing challenges with compliance, with some recurring themes but no clear overall improvement trend.

Health Inspection History

Inspections
Total health inspections 16

Washington average 7.8


Last Health inspection on Aug 2025

Total health citations
79 Rank #55 / 66Health citations — state benchmarkedThis home is ranked 55th out of 66 homes in Washington.Shows this facility's total health deficiency citations benchmarked to the Washington state average, with a ranking across all 66 WA SNFs. Lower citation counts earn a better rank.

Washington average 48.9

Citations per inspection
4.94

Washington average 6.92


Health citations are formal notices following inspections when they fail to comply with safety and care standards.

52 of 79 citations resulted from standard inspections; 26 of 79 resulted from complaint investigations; and 1 of 79 came from combined inspections (standard and complaint).

Breakdown of citation severity (last 3 years)
Critical Health citations More info
1 Rank #28 / 44Severe citations — state benchmarkedThis home is ranked 28th out of 44 homes in Washington.Shows citations where actual resident harm occurred, compared to the Washington average and ranked across 44 SNFs statewide. Even a single severe citation is significant — lower is always better.
233% worse than Washington average

Washington average: 0.3


Serious Health citations More info 3
76% worse than Washington average

Washington average: 1.7

1 critical citation More info Washington average: 0.3

3 serious citations More info Washington average: 1.7

75 moderate citations More info Washington average: 46.3

0 minor citations More info Washington average: 0.5
Citations history (last 3 years)
Infection Control moderate citation Info Issues related to preventing and controlling infections, including hygiene practices and safety protocols. Aug 21, 2025
Corrected

Pharmacy moderate citation Info Issues related to medication management, including how drugs are stored, administered, and monitored. Aug 21, 2025
Corrected

Resident Rights moderate citation Info Issues related to resident's rights, including dignity, privacy, and the ability to make decisions about their care. Aug 21, 2025
Corrected

Abuse/Neglect moderate citation Info Issues related to protecting resident's from harm, including abuse, neglect, or mistreatment. Jun 09, 2025
Corrected

Compare Nursing Homes around Bremerton The information below is reported by the Washington Department of Social and Health Services, Residential Care Services.

4 facilities compared · CMS & WA Dept. of Health data · Updated Apr 2026

Filter by care type
Fir Lane Health & Rehabilitation Center
NH

Nursing Home Licensed facility providing 24/7 skilled nursing care for residents with complex, ongoing medical needs. Staffed by RNs, LPNs, and CNAs. Inspected and star-rated annually by CMS. Accepts Medicare (short-term rehab) and Medicaid (long-term care).

Shelton (Christmas Village)135 60.0% -17%4.39 -72%+4%3794.9483A+ 23 -$12.6M$3.7M29.7%505230
Bremerton Trails Post Acute
NH

Nursing Home Licensed facility providing 24/7 skilled nursing care for residents with complex, ongoing medical needs. Staffed by RNs, LPNs, and CNAs. Inspected and star-rated annually by CMS. Accepts Medicare (short-term rehab) and Medicaid (long-term care).

Bremerton (Clare Avenue)125 74.7% +3%4.31 -67%+2%21034.5481- 62 -$14.7M$5.3M36.4%505123
Bridgeview Care
NH

Nursing Home Licensed facility providing 24/7 skilled nursing care for residents with complex, ongoing medical needs. Staffed by RNs, LPNs, and CNAs. Inspected and star-rated annually by CMS. Accepts Medicare (short-term rehab) and Medicaid (long-term care).

Bremerton- 74.7% +3%4.31 -67%+2%21034.5481- 22 -$14.7M$5.3M36.4%505123
Emerald Bay Care
NH

Nursing Home Licensed facility providing 24/7 skilled nursing care for residents with complex, ongoing medical needs. Staffed by RNs, LPNs, and CNAs. Inspected and star-rated annually by CMS. Accepts Medicare (short-term rehab) and Medicaid (long-term care).

Bremerton- 73.3% +1%3.93 --7%100.0064- 48 Mason, Monique$11.5M$3.5M30.7%505240

Financial Assistance for
Nursing Home in Washington

Get Financial aid guidance

Community Options Program Entry System (COPES)

WA Medicaid COPES

Age 65+ or disabled
General Washington resident, Medicaid-eligible, nursing home-level care need.
Income Limits (2025) ~$2,829/month 300% FBR, individual
Asset Limits $2,000 (individual), $3,000 (couple).
WA

High demand in urban areas (e.g., Seattle).

Benefits
Personal care (5-7 hours/day) Respite (240 hours/year) Adult day care ($70/day) Home modifications ($1,500 avg.)

Washington Family Caregiver Support Program

WA NFCSP

Age Caregiver of someone 60+ (or with dementia)
General Washington resident.
Income Limits No strict limit; prioritizes low-income.
Asset Limits Not applicable.
WA

High urban demand; rural outreach.

Benefits
In-home respite (4-6 hours/day) Adult day care (~$70/day) Short-term facility care (up to 5 days)

Community First Choice (CFC)

Washington Community First Choice

Age 65+ (or disabled 18+)
General WA resident, Medicaid-eligible, need help with 2+ ADLs/IADLs.
Income Limits (2025) ~$2,829/month; QIT optional.
Asset Limits $2,000 (individual), $3,000 (couple).
WA

Broader than COPES; serves ~20,000; self-directed option.

Benefits
Personal care (4-6 hours/day) Respite (~240 hours/year) Assistive devices Training Transportation

Older Americans Act (OAA) Services

Washington OAA Services

Age 60+
General WA resident; no income/asset limits.
Income Limits (2025) None; donations encouraged.
Asset Limits Not assessed.
WA

13 AAAs; includes Meals on Wheels; rural focus.

Benefits
Meals (~$5-$7/meal) Transportation Homemaker services (~4 hours/week) Respite (~5 days/year) Legal aid

Medicare Savings Program (MSP)

Washington Medicare Savings Program

Age 65+ or disabled
General WA resident, Medicare Part A/B.
Income Limits (2025) ~$2,510/month (QMB), ~$3,380/month (SLMB), ~$3,598/month (QI)—individual.
Asset Limits $9,430 (individual), $14,130 (couple).
WA

Includes Extra Help for Part D; no waitlist.

Benefits
Covers Part B premiums ($174.70/month) Deductibles ($240/year) Copays (~20%)

Low-Income Home Energy Assistance Program (LIHEAP)

Washington LIHEAP

Age 60+ prioritized
General WA resident, low-income household.
Income Limits (2025) ~$3,970/month 185% FPL
Asset Limits Not assessed.
WA

Covers gas, electric, wood; emergency aid available.

Benefits
Heating/cooling aid ($300-$1,000/season) Crisis aid ($500 max)

Senior Community Service Employment Program (SCSEP)

Washington SCSEP

Age 55+
General unemployed, low-income, WA resident.
Income Limits (2025) ~$1,983/month 125% FPL
Asset Limits Not specified.
WA

Priority for veterans, rural residents; AARP partnership.

Benefits
Paid training (~20 hours/week at ~$7.25/hour) Job placement

VA Aid and Attendance (A&A) and Housebound Benefits

Washington VA Aid and Attendance/Housebound

Age 65+ or disabled veteran/spouse
General WA resident, wartime service, ADL help (A&A) or homebound.
Income Limits (2025) Net income < ~$1,984/month (veteran with dependent, A&A); pension offsets income.
Asset Limits ~$155,356 net worth
WA

High veteran use; supports rural/urban needs.

Benefits
Cash (~$1,433-$2,642/month veteran, ~$951-$1,318 spouse) for care costs

Senior Citizens Property Tax Exemption

Washington Senior Property Tax Exemption

Age 61+ or disabled retiree
General WA resident, homeowner, income-based.
Income Limits (2025) ~$45,000-$70,000/year varies by county, e.g., King: $70,000
Asset Limits Not assessed; home value cap varies ~$250,000-$400,000
WA

Saves ~$500-$1,500/year; offered statewide.

Benefits
Tax exemption (~$500-$1,500/year depending on county)

Senior Farmers’ Market Nutrition Program (SFMNP)

Washington SFMNP

Age 60+
General WA resident, low-income.
Income Limits (2025) ~$2,322/month 185% FPL
Asset Limits Not assessed.
WA

Vouchers (~$80/season); serves ~20,000 via AAAs.

Benefits
Vouchers (~$80/season) for produce at farmers’ markets

Places of interest near Fir Lane Health & Rehabilitation Center

Address 1.2 miles from city center Info Estimated distance in miles from Shelton's city center to Fir Lane Health & Rehabilitation Center's address, calculated via Google Maps. — 0.38 miles to nearest hospital (Mason Health - Mason General Hospital)

Calculate Travel Distance to Fir Lane Health & Rehabilitation Center

Add your location

Address

Staffing Data (Q2 2025)

This data corresponds to Q2 2025 and is based on CMS Payroll-Based Journal.

Total staff 203
Employees 143
Contractors 60
Staff to resident ratio 2.67:1
44% better than Washington average

Washington average ratio: 1.85:1

Avg staff/day 51
Average shift 8 hours
0% compared with Washington average

Washington average: 8.1 hours

Total staff hours (quarter) 37,030
Nursing staff breakdown
Registered Nurse

Manages medical care and health needs.

Total count 8
Average shift length Info Average shift length. Calculated as total hours divided by days worked and average staff per day. 11.1 hours

This role is partially covered by contractors.

Licensed Practical Nurse

Assists with medical care and medications.

Total count 37
Average shift length Info Average shift length. Calculated as total hours divided by days worked and average staff per day. 9.4 hours

This role is partially covered by contractors.

Certified Nursing Assistant

Helps with daily care and mobility.

Total count 89
Average shift length Info Average shift length. Calculated as total hours divided by days worked and average staff per day. 7.7 hours

This role is partially covered by contractors.

Contractor staffing

Total hours from contractors

7.9%

2,917 contractor hours this quarter

Certified Nursing Assistant: 41 Licensed Practical Nurse: 15 Occupational Therapy Assistant: 2 Registered Nurse: 1 Medical Director: 1
Staff by category
Certified Nursing Assistant48418914,75291100%7.7
Licensed Practical Nurse2215376,50891100%9.4
Nurse Aide in Training210214,67491100%7.9
Registered Nurse7182,46391100%11.1
Clinical Nurse Specialist8082,2237178%8
RN Director of Nursing4041,0066875%9.1
Other Dietary Services Staff2029899099%7.7
Speech Language Pathologist4048637582%7.1
Dietitian2026867380%7.4
Physical Therapy Aide6065998391%6.3
Mental Health Service Worker1014806167%7.9
Dental Services Staff1014245864%7.3
Occupational Therapy Aide3033885459%6.9
Administrator2023604549%8
Respiratory Therapy Technician4043035459%5.1
Physical Therapy Assistant4041496167%2
Nurse Practitioner2026489%8
Qualified Social Worker202431618%2.7
Occupational Therapy Assistant022332932%0.9
Medical Director011241921%1.3
89 Certified Nursing Assistant
% of Days 100%
37 Licensed Practical Nurse
% of Days 100%
21 Nurse Aide in Training
% of Days 100%
8 Registered Nurse
% of Days 100%
8 Clinical Nurse Specialist
% of Days 78%
4 RN Director of Nursing
% of Days 75%
2 Other Dietary Services Staff
% of Days 99%
4 Speech Language Pathologist
% of Days 82%
2 Dietitian
% of Days 80%
6 Physical Therapy Aide
% of Days 91%
1 Mental Health Service Worker
% of Days 67%
1 Dental Services Staff
% of Days 64%
3 Occupational Therapy Aide
% of Days 59%
2 Administrator
% of Days 49%
4 Respiratory Therapy Technician
% of Days 59%
4 Physical Therapy Assistant
% of Days 67%
2 Nurse Practitioner
% of Days 9%
2 Qualified Social Worker
% of Days 18%
2 Occupational Therapy Assistant
% of Days 32%
1 Medical Director
% of Days 21%

Facility Characteristics

Source: CMS Long-Term Care Facility Characteristics (Data as of Jan 2026)

Total residents 76
Medicare
7
9.2% of residents
Medicaid
63
82.9% of residents
Private pay or other
6
7.9% of residents
Programs & Services
Residents Group

Residents meet regularly to discuss policies, care quality, and activities

Active Resident Council

Organized group of residents that meets regularly to discuss facility policies, quality of life, and activities.

Quality of care over time

These measures show how residents usually do over time at this home, based on health outcomes and preventive care.

High-risk clinical events score Info A composite score based on pressure ulcers, falls with injury, weight loss, walking ability decline, and activities of daily living decline. 11.9
19% worse than Washington average

Washington average: 10.0

Functional decline score Info A composite score based on activities of daily living decline, walking ability decline, and incontinence. 21.0
In line with Washington average

Washington average: 20.9

Long-stay resident measures
Significantly above average Washington avg: 3.6 Info CMS star rating based on long-stay quality measure performance. 5 stars = significantly above average, 1 star = significantly below average.
Need for Help with Daily Activities Increased Info Percent of long-stay residents whose need for help with daily activities has increased 17.7%
8% worse than Washington average

Washington average: 16.4%

Walking Ability Worsened Info Percent of long-stay residents whose ability to move independently worsened 18.8%
14% better than Washington average

Washington average: 21.8%

Low Risk Residents with Bowel/Bladder Incontinence Info Percent of low risk long-stay residents who lose control of their bowels or bladder 26.5%
9% worse than Washington average

Washington average: 24.3%

Falls with Major Injury Info Percent of long-stay residents experiencing one or more falls with major injury 2.6%
In line with Washington average

Washington average: 2.6%

High Risk Residents with Pressure Ulcers Info Percent of long-stay high risk residents with pressure ulcers 12.7%
158% worse than Washington average

Washington average: 4.9%

Urinary Tract Infection Info Percent of long-stay residents with a urinary tract infection 1.5%
12% better than Washington average

Washington average: 1.7%

Lost Too Much Weight Info Percent of long-stay residents who lose too much weight 7.8%
34% worse than Washington average

Washington average: 5.8%

Depressive Symptoms Info Percent of long-stay residents who have depressive symptoms 7.4%
54% better than Washington average

Washington average: 16.2%

Antipsychotic Use Info Percent of long-stay residents who received an antipsychotic medication 36.7%
153% worse than Washington average

Washington average: 14.5%

Pneumococcal Vaccine Info Percent of long-stay residents assessed and appropriately given the pneumococcal vaccine 92.1%
In line with Washington average

Washington average: 96.2%

Influenza Vaccine Info Percent of long-stay residents assessed and appropriately given the seasonal influenza vaccine 92.2%
In line with Washington average

Washington average: 93.8%

Hospitalizations per 1,000 days Info Number of hospitalizations per 1,000 long-stay resident days. 0.68
51% better than Washington average

Washington average: 1.38

ED visits per 1,000 days Info Number of outpatient emergency department visits per 1,000 long-stay resident days. 1.74
15% worse than Washington average

Washington average: 1.51

Short-stay resident measures
Significantly below average Washington avg: 3.6 Info CMS star rating based on short-stay quality measure performance. 5 stars = much above average, 1 star = much below average.
Pneumococcal Vaccine Info Percent of short-stay residents assessed and appropriately given the pneumococcal vaccine 68.7%
22% worse than Washington average

Washington average: 88.1%

Antipsychotic medication increase Info Percent of short-stay residents who newly received an antipsychotic medication 2.7%
91% worse than Washington average

Washington average: 1.4%

Influenza Vaccine Info Percent of short-stay residents assessed and appropriately given the seasonal influenza vaccine 51.5%
37% worse than Washington average

Washington average: 82.0%

Re-hospitalized after SNF stay Info Percentage of short-stay residents who were re-hospitalized after their nursing home admission. 24.8%
25% worse than Washington average

Washington average: 19.9%

Emergency department visits Info Percentage of short-stay residents who had an outpatient emergency department visit. 15.3%
16% worse than Washington average

Washington average: 13.2%

Falls with major injury Info Percentage of SNF residents who experience falls with major injury during their stay. 0.0%
100% better than Washington average

Washington average: 0.8%

Ability to care for self at discharge Info Percentage of residents at or above expected ability to care for themselves at discharge. 66.1%
23% better than Washington average

Washington average: 53.7%

Successful return to home or community Info Rate of successful return to home or community from a skilled nursing facility. 32.9%
35% worse than Washington average

Washington average: 50.6%

Penalties and fines

Federal penalties imposed by CMS for regulatory violations, including civil money penalties (fines) and denials of payment for new Medicare/Medicaid admissions.

Source: CMS Penalties Database (Data as of Jan 2026)

Total fines amount $139K
70% higher than Washington average

Washington average: $82K

Number of fines 3 Rank #31 / 40Federal fines — state benchmarkedThis home is ranked 31st out of 40 homes in Washington.Shows this facility's CMS fine count alongside the Washington average, and where it ranks among all 40 skilled nursing facilities in the state. Fewer fines mean a better rank.
62% more fines than Washington average

Washington average: 1.8

Payment Denials Info Serious action where Medicare and/or Medicaid temporarily stops payments for new residents until issues are fixed. 0
100% fewer payment denials than Washington average

Washington average: 0.3

Fines amount comparison
This facility $139K
Washington average $82K
Penalty History

Penalties are imposed by CMS for violations of federal nursing home regulations.

Civil Money Penalty Info Fines imposed for noncompliance, which can be assessed per day or per instance of violation. Feb 21, 2025
$75K
Civil Money Penalty Info Fines imposed for noncompliance, which can be assessed per day or per instance of violation. Nov 7, 2024
$46K
Civil Money Penalty Info Fines imposed for noncompliance, which can be assessed per day or per instance of violation. Apr 28, 2023
$17K

Last updated: Jan 2026

Guides for Better Senior Living

Care Cost Calculator: See Prices in Your Area

Nursing Home Data Explorer

Don’t Wait Too Long: 7 Red Flag Signs Your Parent Needs Assisted Living Now

The True Cost of Assisted Living in 2025 – And How Families Are Paying For It

Understanding Senior Living Costs: Pricing Models, Discounts & Financial Assistance

Explore Open Rooms
1 Contact details
2 What type of senior care service are you looking for?
3 What budget do you have in mind for senior care?
4 How soon do you need to find care?
5 Additional details

Thank you for your interest!

Our team will be in touch shortly to help with next steps.