


Total staff
124
Employees
112
Contractors
12
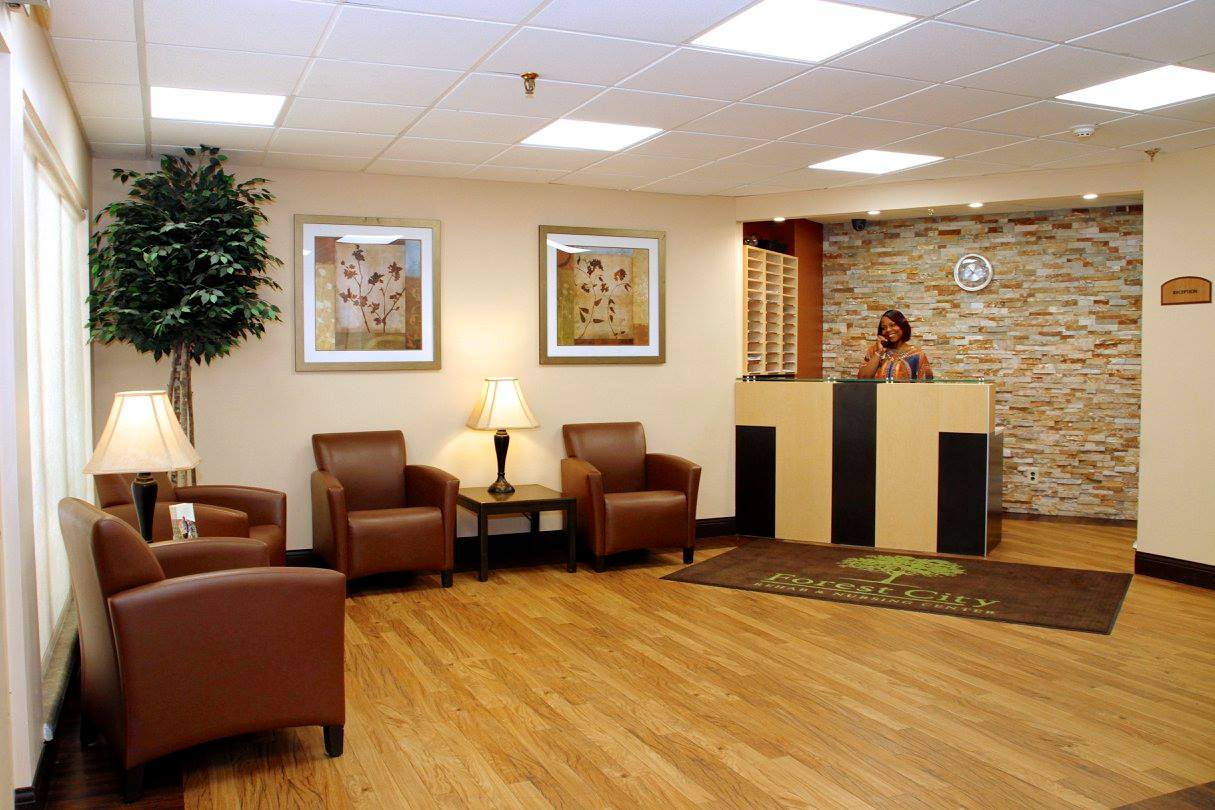
Within the Forest City Rehab and Nursing Center of Rockford, a compassionate team is committed to providing comprehensive support, available round the clock. Whether you seek respite care or embark on a short-term path to recovery, they stand ready to guide their residents with personalized care options tailored to their unique needs. With a capacity to accommodate 213 individuals, Forest City provides a secure and nurturing environment, meticulously crafted to promote well-being and enhance quality of life. Their commitment to excellence has earned them the esteemed accreditation of the Joint Commission on Accreditation of Healthcare Organizations.
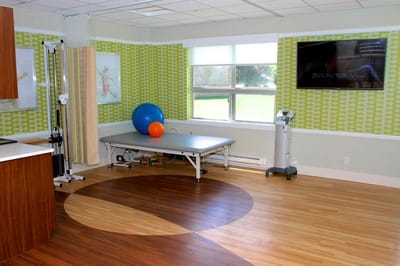
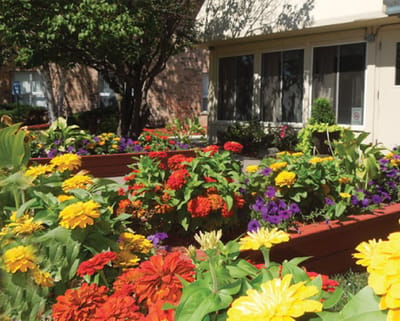
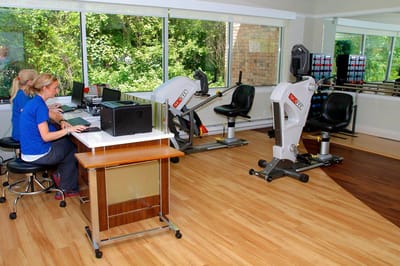
Alongside their expert medical services, they offer meticulous discharge planning and nutritional support, nurturing both body and spirit. Within their vibrant community, a tapestry of recreational activities also awaits, designed to inspire joy and foster meaningful connections among our cherished residents. As residents explore their picturesque gardens, the genuine smiles of their highly trained staff support seniors’ healing and help empower their resilience.
| Staff type | Hours / Day / Resident | vs state avg |
|---|---|---|
|
Registered Nurse (RN)
| 28m per day | ▼ 36% State avg: 44m per day · National avg: 41m per day |
|
LPN / LVN
| 30m per day | ▼ 20% State avg: 38m per day · National avg: 52m per day |
|
Nurse Aide
| 1h 31m per day | ▼ 29% State avg: 2h 8m per day · National avg: 2h 21m per day |
|
Weekend Total Nursing
| 2h 0m per day | ▼ 35% State avg: 3h 5m per day · National avg: 3h 26m per day |
|
Physical Therapist
| 2m per day | ▼ 32% State avg: 3m per day · National avg: 4m per day |
|
Weekend RN
| 20m per day | ▼ 40% State avg: 34m per day · National avg: 29m per day |
Reporting period: October 1 – December 31, 2025 (Q4 2025). Source: CMS Payroll-Based Journal report.
Manages medical care and health needs.
Assists with medical care and medications.
Helps with daily care and mobility.
Total hours from contractors
3,611 contractor hours this quarter
| Certified Nursing Assistant | 64 | 0 | 64 | 22,839 | 92 | 100% | 7.9 |
| Licensed Practical Nurse | 17 | 0 | 17 | 6,174 | 92 | 100% | 8.2 |
| Registered Nurse | 10 | 6 | 16 | 5,114 | 92 | 100% | 7.8 |
| Diagnostic X-ray Services Staff | 8 | 0 | 8 | 3,578 | 92 | 100% | 7.9 |
| Other Dietary Services Staff | 4 | 0 | 4 | 1,923 | 92 | 100% | 7.6 |
| Clinical Nurse Specialist | 3 | 0 | 3 | 1,430 | 68 | 74% | 7.8 |
| RN Director of Nursing | 3 | 0 | 3 | 1,424 | 78 | 85% | 7.7 |
| Respiratory Therapy Technician | 0 | 2 | 2 | 515 | 66 | 72% | 7.8 |
| Dietitian | 1 | 0 | 1 | 512 | 65 | 71% | 7.9 |
| Administrator | 1 | 0 | 1 | 504 | 63 | 68% | 8 |
| Nurse Practitioner | 1 | 0 | 1 | 484 | 61 | 66% | 7.9 |
| Physical Therapy Assistant | 0 | 1 | 1 | 257 | 55 | 60% | 4.7 |
| Qualified Social Worker | 0 | 1 | 1 | 222 | 39 | 42% | 5.7 |
| Physical Therapy Aide | 0 | 1 | 1 | 8 | 2 | 2% | 4 |
| Speech Language Pathologist | 0 | 1 | 1 | 1 | 1 | 1% | 1.3 |
Includes penalties issued in 2023-2025
Federal penalties imposed by CMS for regulatory violations, including civil money penalties (fines) and denials of payment for new Medicare/Medicaid admissions.
Source: CMS Penalties Database (Data as of Jan 2026)
Illinois average: $143K
Illinois average: 3.0
Illinois average: 1.1
Penalties are imposed by CMS for violations of federal nursing home regulations.
5 penalties in the past 3 years
Multiple penalties were reported in the last 3 years.
Last updated: Jan 2026
These measures show how residents usually do over time at this home, based on health outcomes and preventive care.
Illinois average: 9.7
Illinois average: 18.6
Illinois average: 15.5%
Illinois average: 18.4%
Illinois average: 21.6%
Illinois average: 3.4%
Illinois average: 5.3%
Illinois average: 1.8%
Illinois average: 6.5%
Illinois average: 48.1%
Illinois average: 89.2%
Illinois average: 91.6%
Illinois average: 2.05
Illinois average: 2.25
Illinois average: 68.3%
Illinois average: 2.3%
Illinois average: 63.0%
Illinois average: 26.2%
Illinois average: 14.0%
Illinois average: 0.8%
Illinois average: 53.7%
Quality measures are calculated from Minimum Data Set (MDS) assessments. For most measures, lower percentages indicate better care quality.
20% of new residents, usually for short-term rehab.
9% of new residents, often for short stays.
71% of new residents, often for long-term daily care.
Source: CMS Long-Term Care Facility Characteristics (Data as of Jan 2026)
Family members meet regularly to discuss policies, care quality, and activities
Organized group of family members that meets regularly to discuss facility policies, resident care, and activities.
Data sourced from CMS Long-Term Care Facility Characteristics quarterly report. Payer mix reflects the current resident census by primary payment source.
Historical financial and operational data for Forest City Rehab and Nursing Center from 2011–2023, based on CMS SNF Cost Reports.
Key figures below are for fiscal year ending in 12/2023.
Based on CMS SNF Cost Report for fiscal year ending in 12/2023.
No pets allowed
Building Type: Two-story
Most residents stay for extended periods and receive ongoing daily care.
Most new residents arrive under Medicaid (71% of admissions), and a typical Medicaid stay runs around 4 years.
Coverage residents most often arrive under.
Coverage residents most often leave under.
![]() 4.9 miles from city center
4.9 miles from city center
![]() Estimated distance in miles from Rockford's city center to Forest City Rehab and Nursing Center's address, calculated via Google Maps.
— 0.47 miles to nearest hospital (OSF Saint Anthony Medical Center)
Estimated distance in miles from Rockford's city center to Forest City Rehab and Nursing Center's address, calculated via Google Maps.
— 0.47 miles to nearest hospital (OSF Saint Anthony Medical Center)
Add your location
Info below is compiled from CMS reports & the IL Dept. of Public Health (IDPH), senior community websites & trusted data sources such as Walk Score & BBB.
Communities are listed from highest to lowest based on our ranking methodology.
| Amberwood Care Centre | NH HOS MC PC RC SNF | Rockford (North Rockton Avenue) | 135
Facility
135
IL AVG
85
Rank
#61 / 419 |
92.7%
Facility
92.7%
IL AVG
73
Rank
#21 / 157 | +27% | 2.61
Facility
2.61
IL AVG
3.10
Rank
#109 / 155 | -40% | -16% | $0
Facility
$0
IL AVG
$151.3k
Rank
#1 / 155 | 43
Facility
43
IL AVG
36.8
Rank
#108 / 155 | 3.1
Facility
3.1
IL AVG
3.7
Rank
#49 / 155 | - | 125 | - |
47
Facility
47
IL AVG
51
Rank
#356 / 648 | Todd Stern 2015 Trust | $12.8MFiscal year ending 12/2023
Facility
$12.8MFiscal year ending 12/2023
IL AVG
$12.2M
Rank
#85 / 154 | $6.8MFiscal year ending 12/2023
Facility
$6.8MFiscal year ending 12/2023
IL AVG
$4.8M
Rank
#82 / 154 | 53.2%Fiscal year ending 12/2023
Facility
53.2%Fiscal year ending 12/2023
IL AVG
44.3%
Rank
#71 / 154 | 145908 | ||||
| River Bluff Nursing Home | NH HOS MC PC SNF | Rockford (Ruby) | 304
Facility
304
IL AVG
85
Rank
#1 / 419 |
49.9%
Facility
49.9%
IL AVG
73
Rank
#141 / 157 | -32% | 4.13
Facility
4.13
IL AVG
3.10
Rank
#39 / 155 | -33% | +33% | $10.2k
Facility
$10.2k
IL AVG
$151.3k
Rank
#70 / 155 | 30
Facility
30
IL AVG
36.8
Rank
#73 / 155 | 3.0
Facility
3.0
IL AVG
3.7
Rank
#40 / 155 | 2 | 152 | - |
33
Facility
33
IL AVG
51
Rank
#470 / 648 | County Of Winnebago | $12.7MFiscal year ending 09/2023
Facility
$12.7MFiscal year ending 09/2023
IL AVG
$12.2M
Rank
#58 / 154 | $9.3MFiscal year ending 09/2023
Facility
$9.3MFiscal year ending 09/2023
IL AVG
$4.8M
Rank
#11 / 154 | 72.7%Fiscal year ending 09/2023
Facility
72.7%Fiscal year ending 09/2023
IL AVG
44.3%
Rank
#6 / 154 | 145771 | ||||
| Alden Park Strathmoor | NH HOS MC RC SNF | Rockford (Strathmoor Drive) | 189
Facility
189
IL AVG
85
Rank
#33 / 419 |
77.9%
Facility
77.9%
IL AVG
73
Rank
#76 / 157 | +7% | 2.48
Facility
2.48
IL AVG
3.10
Rank
#122 / 155 | +18% | -20% | $115.3k
Facility
$115.3k
IL AVG
$151.3k
Rank
#119 / 155 | 28
Facility
28
IL AVG
36.8
Rank
#65 / 155 | 3.5
Facility
3.5
IL AVG
3.7
Rank
#72 / 155 | 4 | 147 | - |
33
Facility
33
IL AVG
51
Rank
#470 / 648 | Nikolina Kuljanin | $14.9MFiscal year ending 12/2023
Facility
$14.9MFiscal year ending 12/2023
IL AVG
$12.2M
Rank
#78 / 154 | $6.9MFiscal year ending 12/2023
Facility
$6.9MFiscal year ending 12/2023
IL AVG
$4.8M
Rank
#85 / 154 | 46.5%Fiscal year ending 12/2023
Facility
46.5%Fiscal year ending 12/2023
IL AVG
44.3%
Rank
#82 / 154 | 145259 | ||||
| Citadel PA Peterson | NH HOS MC PC RC SNF | Rockford | 129
Facility
129
IL AVG
85
Rank
#68 / 419 |
96.1%
Facility
96.1%
IL AVG
73
Rank
#8 / 157 | +32% | 2.70
Facility
2.70
IL AVG
3.10
Rank
#98 / 155 | -24% | -13% | $21.2k
Facility
$21.2k
IL AVG
$151.3k
Rank
#80 / 155 | 63
Facility
63
IL AVG
36.8
Rank
#135 / 155 | 2.6
Facility
2.6
IL AVG
3.7
Rank
#25 / 155 | 4 | 124 | - |
31
Facility
31
IL AVG
51
Rank
#487 / 648 | - | $14.4MFiscal year ending 12/2023
Facility
$14.4MFiscal year ending 12/2023
IL AVG
$12.2M
Rank
#46 / 154 | $7.1MFiscal year ending 12/2023
Facility
$7.1MFiscal year ending 12/2023
IL AVG
$4.8M
Rank
#73 / 154 | 49.2%Fiscal year ending 12/2023
Facility
49.2%Fiscal year ending 12/2023
IL AVG
44.3%
Rank
#131 / 154 | 145751 | ||||
| Forest City Rehab and Nursing Center | NH HOS MC RC SNF | Rockford | 213
Facility
213
IL AVG
85
Rank
#22 / 419 |
76.9%
Facility
76.9%
IL AVG
73
Rank
#77 / 157 | +5% | 1.84
Facility
1.84
IL AVG
3.10
Rank
#150 / 155 | -9% | -41% | $192.9k
Facility
$192.9k
IL AVG
$151.3k
Rank
#136 / 155 | 70
Facility
70
IL AVG
36.8
Rank
#141 / 155 | 2.9
Facility
2.9
IL AVG
3.7
Rank
#39 / 155 | 7 | 164 | - |
61
Facility
61
IL AVG
51
Rank
#223 / 648 | Fredsign Holdings I LLC | $13.1MFiscal year ending 12/2023
Facility
$13.1MFiscal year ending 12/2023
IL AVG
$12.2M
Rank
#50 / 154 | $6.0MFiscal year ending 12/2023
Facility
$6.0MFiscal year ending 12/2023
IL AVG
$4.8M
Rank
#99 / 154 | 45.6%Fiscal year ending 12/2023
Facility
45.6%Fiscal year ending 12/2023
IL AVG
44.3%
Rank
#148 / 154 | 145937 |
Forest City Rehab and Nursing Center is located in Rockford, Illinois.
Here are the financial assistance programs available to residents in Illinois.
Forest City Rehab and Nursing Center has a walk score of 61. Moderately walkable. Some errands can be accomplished on foot, with a mix of nearby amenities.
Forest City Rehab and Nursing Center's occupancy is 79.2%.
No, Forest City Rehab and Nursing Center has a no-pet policy.
Forest City Rehab and Nursing Center is registered as a for-profit.
Yes — there are 4 photos of Forest City Rehab and Nursing Center in the photo gallery on this page.
Forest City Rehab and Nursing Center is located at 321 Arnold Ave, Rockford, IL 61108.
(815) 397-5531 will put you in contact with the team at Forest City Rehab and Nursing Center.
Care Cost Calculator: See Prices in Your Area
Nursing Home Data Explorer
Don’t Wait Too Long: 7 Red Flag Signs Your Parent Needs Assisted Living Now
The True Cost of Assisted Living in 2025 – And How Families Are Paying For It
Understanding Senior Living Costs: Pricing Models, Discounts & Financial Assistance


