Fort Vancouver Assisted Living
Nursing Home & Assisted Living · Washington, WA
CMS overall rating Info The Overall CMS Rating is scored from 1 to 5 stars and combines results from health inspections, staffing levels, and quality measures. Health inspections carry the most weight. Staffing and quality scores can increase or decrease the final rating based on performance compared to state and national standards.

Fort Vancouver Assisted Living

Nursing Home & Assisted Living · Washington, WA
CMS overall rating Info The Overall CMS Rating is scored from 1 to 5 stars and combines results from health inspections, staffing levels, and quality measures. Health inspections carry the most weight. Staffing and quality scores can increase or decrease the final rating based on performance compared to state and national standards.
Calculator: See prices in your area
Fort Vancouver Assisted Living accepts Medicare, Medicaid, and private pay.

Overview of Fort Vancouver Assisted Living

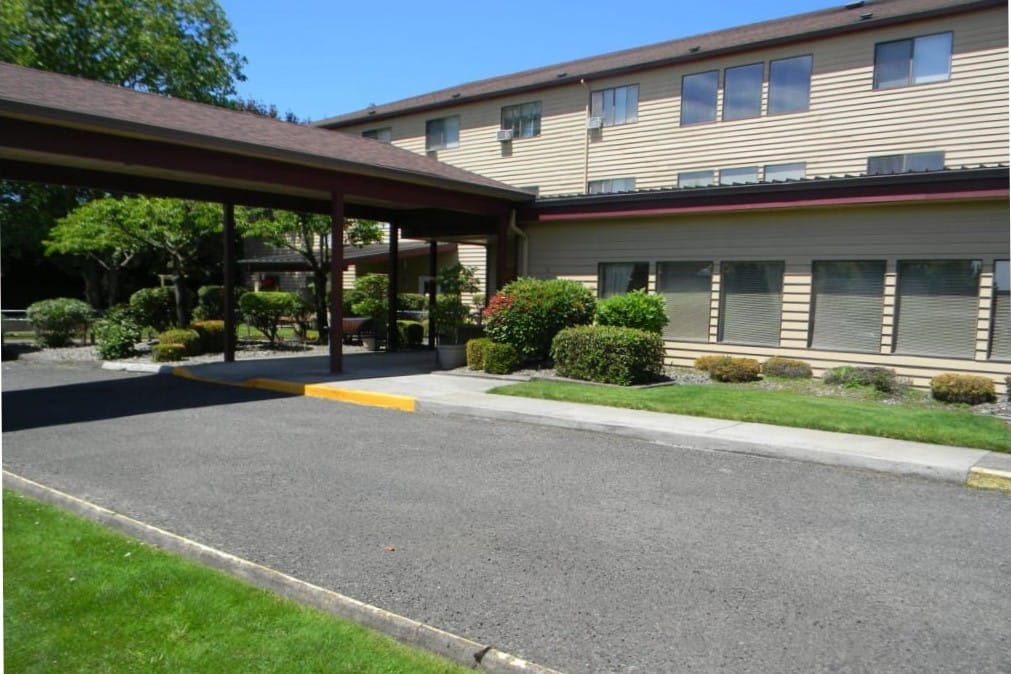
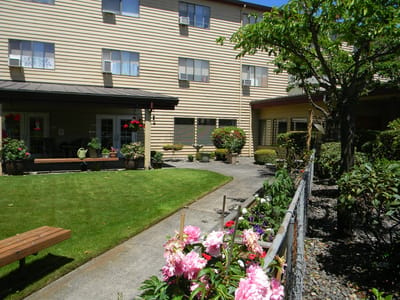
Set against the charming backdrop of Vancouver, WA, this distinguished community excels in providing a seamless blend of skilled nursing, rehabilitation therapy, and assisted living services. Fort Vancouver Assisted Living is dedicated to delivering compassionate, high-quality healthcare, focusing on enhancing the well-being and dignity of each individual through innovative care practices and personalized attention. Elegantly designed studio, one-bedroom, and two-bedroom apartments offer comfort and convenience, each tailored to meet diverse needs.

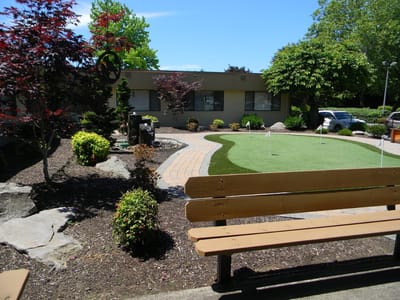
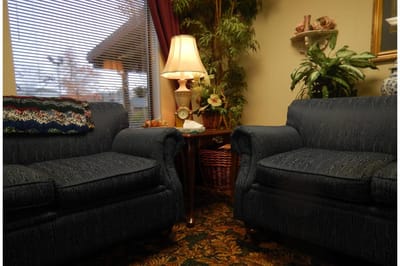
Here, residents are treated to healthy and delectable meal options while enjoying a rich array of activities that invigorate the body, mind, and spirit. From weekly field trips and on-site performers to visits from school children and therapy animals, the community buzzes with engaging events and lively games, including plenty of Bingo. Every moment is crafted to celebrate life and foster a vibrant, fulfilling experience for all.

Quality ratings

Measured by Centers for Medicare & Medicaid Services (CMS)

Overall rating Info The Overall CMS Rating combines results from health inspections, staffing levels and quality measures. Health inspections carry the most weight. Staffing and quality scores can increase or decrease the final rating based on performance compared to state and national standards.
▲ 44.5% Above WA avg. ▲ 44.5% Above WA avg.Click the badge to see the full State ranking.Click here to see the full State ranking.
Health Inspection Info Based on the results of the facility's three most recent standard inspections and any complaint investigations. CMS reviews the number, scope, and severity of deficiencies, with more recent findings weighted more heavily.
▲ 38.9% Above WA avg. ▲ 38.9% Above WA avg.Click the badge to see the full State ranking.Click here to see the full State ranking.
Staffing Info Measures average nursing staff hours per resident per day, including Registered Nurses (RNs) and total nursing staff. Ratings are adjusted based on the level of care residents require and are compared to state and national benchmarks.
▼ 48.1% Below WA avg. ▼ 48.1% Below WA avg.Click the badge to see the full State ranking.Click here to see the full State ranking.
Quality Measures Info Based on clinical and physical health indicators reported to CMS, such as hospital readmissions, falls, pressure ulcers, and improvements in mobility. These measures reflect how well residents' health needs are being managed.
▲ 22.5% Above WA avg. ▲ 22.5% Above WA avg.Click the badge to see the full State ranking.Click here to see the full State ranking.

Staffing hours breakdown

Info Daily nursing hours per resident by staff type, reported to CMS. Higher is generally better — compare this facility to state and national averages to see where staffing stands.

Hours per resident per day — compared to Washington state averages

Total nursing care / resident Info This home is ranked 67th out of 89 homes in Washington. Total adjusted nursing hours per resident per day, combining RN, LPN, and aide time. CMS adjusts this for case-mix so facilities can be fairly compared.
3h 43m per day
Rank #67 / 89Nurse hours — State benchmarkedThis home is ranked 67th out of 89 homes in Washington. Shows adjusted nurse hours per resident per day benchmarked to the Washington average, with a ranking across 89 Washington SNFs. More hours mean more direct care. The national average is about 3.5 hrs; below 3.0 is a red flag.Click the rank badge to see the full State ranking.Click here to see the full State ranking.
This facility Washington avg (4h 22m per day)
vs Washington avg
-15%
Staff typeHours / Day / Residentvs state avg
Weekend Total Nursing Info Combined nursing hours (RN + LPN + Nurse Aide) per resident per day on weekends. Staffing often drops on weekends — this figure reveals whether the facility maintains adequate coverage outside of weekday hours. 3h 28m per day

Types of Care at Fort Vancouver Assisted Living

Assisted Living

Capacity and availability

This home usually has availability

Occupancy lower than 85% suggests more openings may be available.

Lower occupancy than the Washington average: 72.5%
Occupancy rate 72.1% Rank #179 / 310Occupancy rate — State benchmarkedThis home is ranked 179th out of 310 homes in Washington. Shows this facility's occupancy rate versus the Washington average, with its Statewide rank out of 310. Higher occupancy signals strong local demand and financial stability.Click the rank badge to see the full State ranking.Click here to see the full State ranking.
Avg. Length of Stay 47 days
Occupancy rate
72.1% Rank #179 / 310Occupancy rate — State benchmarkedThis home is ranked 179th out of 310 homes in Washington. Shows this facility's occupancy rate versus the Washington average, with its Statewide rank out of 310. Higher occupancy signals strong local demand and financial stability.Click the rank badge to see the full State ranking.Click here to see the full State ranking.
Avg. Length of Stay
47 days
Years in operation
10 years in operation Rank #108 / 133Years in operation — State benchmarkedThis home is ranked 108th out of 133 homes in Washington. Shows how long this facility has been in operation compared to other Washington SNFs. Longer operating histories may benefit residents, families, and staff.Click the rank badge to see the full State ranking.Click here to see the full State ranking.
A community with a solid operating history and experience delivering ongoing care.
Walk Score
Walk Score: 51 / 100 Rank #320 / 628Walk Score — State benchmarkedThis home is ranked 320th out of 628 homes in Washington. Shows how walkable this facility's neighborhood is compared to the average Walk Score across Washington SNFs. Higher scores benefit residents, families, and staff.Click the rank badge to see the full State ranking.Click here to see the full State ranking.
Moderately walkable. Some errands can be accomplished on foot, with a mix of nearby amenities.

About this community

Staffing

Key information about the people who lead and staff this community.

Leadership

ContactMr. Michael Miller, Owner/Member

Therapy & Rehabilitation

2 services
Rehabilitation Services
Respite Care

Additional Services

1 service
Memory Support

Contact Fort Vancouver Assisted Living

Health Inspection History

Inspections since 2023
Total health inspections 5

Washington average 7.8


Last Health inspection on Apr 2025

Total health citations
24 Rank #12 / 91Health citations — State benchmarkedThis home is ranked 12th out of 91 homes in Washington. Shows this facility's total health deficiency citations benchmarked to the Washington State average, with a ranking across all 91 WA SNFs. Lower citation counts earn a better rank.Click the rank badge to see the full State ranking.Click here to see the full State ranking.

Washington average 48.9

Citations per inspection
4.8 Rank #23 / 91Citations per inspection — State benchmarkedThis home is ranked 23rd out of 91 homes in Washington. Shows average deficiency citations per CMS inspection for this facility versus the Washington mean across 91 SNFs with citation data. Lower is better.Click the rank badge to see the full State ranking.Click here to see the full State ranking.

Washington average 6.92


Health citations are formal notices following inspections when they fail to comply with safety and care standards.

21 of 24 citations resulted from standard inspections; 2 of 24 resulted from complaint investigations; and 1 of 24 came from combined inspections (standard and complaint).

Breakdown of citation severity (last 3 years)
Critical Health citations
1
233% worse than Washington average

Washington average: 0.3


Serious Health citations
0
100% better than Washington average

Washington average: 1.7

1 critical citation Washington average: 0.3

0 serious citations Washington average: 1.7

23 moderate citations Washington average: 46.3

0 minor citations Washington average: 0.5
Citations history (last 3 years)
Environmental moderate citation Apr 24, 2025
Corrected

Nutrition moderate citation Apr 24, 2025
Corrected

Pharmacy moderate citation Apr 24, 2025
Corrected

Quality of Care moderate citation Apr 24, 2025
Corrected

Staffing Data

Reporting period: October 1 – December 31, 2025 (Q4 2025). Source: CMS Payroll-Based Journal report.

Total staff 150
Employees 125
Contractors 25
Staff to resident ratio 2.03:1
9% better than Washington average
Washington average ratio: 1.86:1 Washington average ratio: 1.86:1See full Washington ranking
Avg staff/day 41
Average shift 8.7 hours
7% better than Washington average
Washington average: 8.1 hours Washington average shift: 8.1 hoursSee full Washington ranking
Total staff hours (quarter) 32,937

Nursing staff breakdown

Q4 2025 · Oct 1 – Dec 31 More info This data comes from the CMS Payroll-Based Journal report covering October 1 – December 31, 2025.
Registered Nurse

Manages medical care and health needs.

RN Staff 32
Average shift length Info Average shift length. Calculated as total hours divided by days worked and average staff per day. 9.5 hours

This role is partially covered by contractors.

Licensed Practical Nurse

Assists with medical care and medications.

LPN Staff 21
Average shift length Info Average shift length. Calculated as total hours divided by days worked and average staff per day. 9.3 hours

This role is partially covered by contractors.

Certified Nursing Assistant

Helps with daily care and mobility.

CNA Staff 58
Average shift length Info Average shift length. Calculated as total hours divided by days worked and average staff per day. 9.6 hours

This role is partially covered by contractors.

Contractor staffing

Q4 2025 · Oct 1 – Dec 31 More info This data comes from the CMS Payroll-Based Journal report covering October 1 – December 31, 2025.

Total hours from contractors

3.2%

1,045 contractor hours this quarter

Certified Nursing Assistant: 12 Registered Nurse: 8 Licensed Practical Nurse: 2 Medical Director: 1 Occupational Therapy Aide: 1 Occupational Therapy Assistant: 1

Staff by category

Q4 2025 · Oct 1 – Dec 31 More info This data comes from the CMS Payroll-Based Journal report covering October 1 – December 31, 2025.
Certified Nursing Assistant46125814,30792100%9.6
Registered Nurse248326,36592100%9.5
Licensed Practical Nurse192215,15892100%9.3
Physical Therapy Assistant100101,6948087%6.3
Speech Language Pathologist6061,0838087%6.2
Mental Health Service Worker1015556470%8.7
Nurse Practitioner1015126470%8
Clinical Nurse Specialist1014966166%8.1
Dental Services Staff1014605661%8.2
Dietitian1014506672%6.8
Qualified Social Worker3034296267%6.8
Nurse Aide in Training2024233639%11.7
Respiratory Therapy Technician7074187278%4.6
Administrator1013066470%4.8
Occupational Therapy Aide0111131314%8.7
Other Dietary Services Staff202941011%9.4
Occupational Therapy Assistant0114755%9.4
Medical Director01129910%3.2
58 Certified Nursing Assistant
% of Days 100%
32 Registered Nurse
% of Days 100%
21 Licensed Practical Nurse
% of Days 100%
10 Physical Therapy Assistant
% of Days 87%
6 Speech Language Pathologist
% of Days 87%
1 Mental Health Service Worker
% of Days 70%
1 Nurse Practitioner
% of Days 70%
1 Clinical Nurse Specialist
% of Days 66%
1 Dental Services Staff
% of Days 61%
1 Dietitian
% of Days 72%
3 Qualified Social Worker
% of Days 67%
2 Nurse Aide in Training
% of Days 39%
7 Respiratory Therapy Technician
% of Days 78%
1 Administrator
% of Days 70%
1 Occupational Therapy Aide
% of Days 14%
2 Other Dietary Services Staff
% of Days 11%
1 Occupational Therapy Assistant
% of Days 5%
1 Medical Director
% of Days 10%

Penalties and fines

Federal penalties imposed by CMS for regulatory violations, including civil money penalties (fines) and denials of payment for new Medicare/Medicaid admissions.

Source: CMS Penalties Database (Data as of Jan 2026)

Total fines amount $66K Rank #56 / 91Federal fines — State benchmarkedThis home is ranked 56th out of 91 homes in Washington. Shows this facility's cumulative CMS federal fine dollars versus the Washington average among facilities with fines, and where it ranks among 91 skilled nursing facilities in the pool. Lower total dollars mean a better rank.Click the rank badge to see the full State ranking.Click here to see the full State ranking.
19% lower than Washington average

Washington average: $82K

Number of fines 1
46% fewer fines than Washington average

Washington average: 1.8

Payment Denials Info Serious action where Medicare and/or Medicaid temporarily stops payments for new residents until issues are fixed. 0
100% fewer payment denials than Washington average

Washington average: 0.3

Fines amount comparison
This facility $66K
Washington average $82K

No penalties in the past 3 years

No civil money penalties or payment denials were reported in the last 3 years.

Quality of care over time

These measures show how residents usually do over time at this home, based on health outcomes and preventive care.

High-risk clinical events score Info A composite score based on pressure ulcers, falls with injury, weight loss, walking ability decline, and activities of daily living decline. 9.3
7% better than Washington average

Washington average: 10.0

Functional decline score Info A composite score based on activities of daily living decline, walking ability decline, and incontinence. 19.1
8% better than Washington average

Washington average: 20.9

Long-stay resident measures
Need for Help with Daily Activities Increased Info Percent of long-stay residents whose need for help with daily activities has increased 11.2%
32% better than Washington average

Washington average: 16.4%

Walking Ability Worsened Info Percent of long-stay residents whose ability to move independently worsened 26.4%
21% worse than Washington average

Washington average: 21.8%

Low Risk Residents with Bowel/Bladder Incontinence Info Percent of low risk long-stay residents who lose control of their bowels or bladder 19.7%
19% better than Washington average

Washington average: 24.3%

Falls with Major Injury Info Percent of long-stay residents experiencing one or more falls with major injury 3.5%
35% worse than Washington average

Washington average: 2.6%

High Risk Residents with Pressure Ulcers Info Percent of long-stay high risk residents with pressure ulcers 2.2%
56% better than Washington average

Washington average: 4.9%

Urinary Tract Infection Info Percent of long-stay residents with a urinary tract infection 3.0%
73% worse than Washington average

Washington average: 1.7%

Lost Too Much Weight Info Percent of long-stay residents who lose too much weight 3.1%
46% better than Washington average

Washington average: 5.8%

Depressive Symptoms Info Percent of long-stay residents who have depressive symptoms 6.2%
62% better than Washington average

Washington average: 16.2%

Antipsychotic Use Info Percent of long-stay residents who received an antipsychotic medication 18.7%
29% worse than Washington average

Washington average: 14.5%

Pneumococcal Vaccine Info Percent of long-stay residents assessed and appropriately given the pneumococcal vaccine 100.0%
In line with Washington average

Washington average: 96.2%

Influenza Vaccine Info Percent of long-stay residents assessed and appropriately given the seasonal influenza vaccine 96.3%
In line with Washington average

Washington average: 93.8%

Short-stay resident measures
Pneumococcal Vaccine Info Percent of short-stay residents assessed and appropriately given the pneumococcal vaccine 92.9%
5% better than Washington average

Washington average: 88.1%

Antipsychotic medication increase Info Percent of short-stay residents who newly received an antipsychotic medication 1.1%
20% better than Washington average

Washington average: 1.4%

Influenza Vaccine Info Percent of short-stay residents assessed and appropriately given the seasonal influenza vaccine 88.0%
7% better than Washington average

Washington average: 82.0%

Breakdown by payment type

Medicare

24% of new residents, usually for short-term rehab.

Typical stay 1 months

Private pay

52% of new residents, often for short stays.

Typical stay 26 days

Medicaid

23% of new residents, often for long-term daily care.

Typical stay 3 - 4 months

Facility Characteristics

Source: CMS Long-Term Care Facility Characteristics (Data as of Jan 2026)

Total residents 74
Medicare
23
31.1% of residents
Medicaid
45
60.8% of residents
Private pay or other
6
8.1% of residents
Programs & Services
Residents Group

Residents meet regularly to discuss policies, care quality, and activities

Active Resident Council

Organized group of residents that meets regularly to discuss facility policies, quality of life, and activities.

Finances and operations

Privately-owned community
Operated by a business corporation.
Home revenue
$13.3M
Operating loss
-$523.1K
Privately-owned community Operated by a business corporation.
Home revenue
$13.3M Rank #51 / 93Revenue — State benchmarkedThis home is ranked 51st out of 93 homes in Washington. Shows this facility's annual revenue compared to the Washington SNF average. Higher revenue generally means more resources for staffing and capital — read alongside Payroll %.Click the rank badge to see the full State ranking.Click here to see the full State ranking.
Operating loss
-$523.1K
Payroll costs Info The portion of the home's budget spent on staff, including nurses, caregivers, and other employees who support care and operations. Rank #45 / 93Payroll — State benchmarkedThis home is ranked 45th out of 93 homes in Washington. Shows total annual staff payroll benchmarked to the Washington average. Higher payroll investment relative to peers often signals better staffing and less reliance on cheaper contract labor.Click the rank badge to see the full State ranking.Click here to see the full State ranking.
$6.9M
52.2% of revenue Rank #34 / 93Payroll % — State benchmarkedThis home is ranked 34th out of 93 homes in Washington. Shows payroll as a percentage of revenue versus the Washington average. Well-run Washington SNFs typically land around 53–61% — the top third Statewide. Below 25% may signal understaffing or heavy agency use — read with Staffing ratings.Click the rank badge to see the full State ranking.Click here to see the full State ranking.
Other operating costs Info All remaining costs needed to run the home, such as food, utilities, building maintenance, supplies and administrative expenses.
$6.9M
Total costs $13.8M

What does this home offer?

Building type icon
Building type icon

Building Type: Single-story

Who this home usually serves

TYPE OF STAY

Mix of rehab and long-term care

This home supports both short-term rehab and long-term care, with residents staying for a wide range of durations.

Places of interest near Fort Vancouver Assisted Living

Address 4.6 miles from city center Info Estimated distance in miles from Vancouver's city center to Fort Vancouver Assisted Living's address, calculated via Google Maps.

Calculate Travel Distance to Fort Vancouver Assisted Living

Add your location

Address

Financial Assistance for
Nursing Home in Washington

Fort Vancouver Assisted Living is located in Vancouver, Washington.
Here are the financial assistance programs available to residents in Washington.

Get Financial aid guidance

Community Options Program Entry System (COPES)

WA Medicaid COPES

Age 65+ or disabled
General Washington resident, Medicaid-eligible, nursing home-level care need.
Income Limits (2025) ~$2,829/month 300% FBR, individual
Asset Limits $2,000 (individual), $3,000 (couple).
WA

High demand in urban areas (e.g., Seattle).

Benefits
Personal care (5-7 hours/day) Respite (240 hours/year) Adult day care ($70/day) Home modifications ($1,500 avg.)

Washington Family Caregiver Support Program

WA NFCSP

Age Caregiver of someone 60+ (or with dementia)
General Washington resident.
Income Limits No strict limit; prioritizes low-income.
Asset Limits Not applicable.
WA

High urban demand; rural outreach.

Benefits
In-home respite (4-6 hours/day) Adult day care (~$70/day) Short-term facility care (up to 5 days)

Community First Choice (CFC)

Washington Community First Choice

Age 65+ (or disabled 18+)
General WA resident, Medicaid-eligible, need help with 2+ ADLs/IADLs.
Income Limits (2025) ~$2,829/month; QIT optional.
Asset Limits $2,000 (individual), $3,000 (couple).
WA

Broader than COPES; serves ~20,000; self-directed option.

Benefits
Personal care (4-6 hours/day) Respite (~240 hours/year) Assistive devices Training Transportation

Older Americans Act (OAA) Services

Washington OAA Services

Age 60+
General WA resident; no income/asset limits.
Income Limits (2025) None; donations encouraged.
Asset Limits Not assessed.
WA

13 AAAs; includes Meals on Wheels; rural focus.

Benefits
Meals (~$5-$7/meal) Transportation Homemaker services (~4 hours/week) Respite (~5 days/year) Legal aid

Medicare Savings Program (MSP)

Washington Medicare Savings Program

Age 65+ or disabled
General WA resident, Medicare Part A/B.
Income Limits (2025) ~$2,510/month (QMB), ~$3,380/month (SLMB), ~$3,598/month (QI)—individual.
Asset Limits $9,430 (individual), $14,130 (couple).
WA

Includes Extra Help for Part D; no waitlist.

Benefits
Covers Part B premiums ($174.70/month) Deductibles ($240/year) Copays (~20%)

VA Aid and Attendance (A&A) and Housebound Benefits

Washington VA Aid and Attendance/Housebound

Age 65+ or disabled veteran/spouse
General WA resident, wartime service, ADL help (A&A) or homebound.
Income Limits (2025) Net income < ~$1,984/month (veteran with dependent, A&A); pension offsets income.
Asset Limits ~$155,356 net worth
WA

High veteran use; supports rural/urban needs.

Benefits
Cash (~$1,433-$2,642/month veteran, ~$951-$1,318 spouse) for care costs

Senior Citizens Property Tax Exemption

Washington Senior Property Tax Exemption

Age 61+ or disabled retiree
General WA resident, homeowner, income-based.
Income Limits (2025) ~$45,000-$70,000/year varies by county, e.g., King: $70,000
Asset Limits Not assessed; home value cap varies ~$250,000-$400,000
WA

Saves ~$500-$1,500/year; offered statewide.

Benefits
Tax exemption (~$500-$1,500/year depending on county)

Senior Farmers’ Market Nutrition Program (SFMNP)

Washington SFMNP

Age 60+
General WA resident, low-income.
Income Limits (2025) ~$2,322/month 185% FPL
Asset Limits Not assessed.
WA

Vouchers (~$80/season); serves ~20,000 via AAAs.

Benefits
Vouchers (~$80/season) for produce at farmers’ markets

Frequently Asked Questions about Fort Vancouver Assisted Living

What neighborhood is Fort Vancouver Assisted Living in?

Fort Vancouver Assisted Living is in the North Garrison Heights neighborhood of Vancouver.

Is Fort Vancouver Assisted Living in a walkable area?

Fort Vancouver Assisted Living has a walk score of 51. Moderately walkable. Some errands can be accomplished on foot, with a mix of nearby amenities.

What is the address of Fort Vancouver Assisted Living?

Fort Vancouver Assisted Living is located at 8422 NE 8th Way, Vancouver, WA 98664, United States.

What is the phone number of Fort Vancouver Assisted Living?

(360) 256-2980 will put you in contact with the team at Fort Vancouver Assisted Living.

Is Fort Vancouver Assisted Living Medicare or Medicaid certified?

Yes — Fort Vancouver Assisted Living is a CMS-certified provider of Medicare and Medicaid.

Guides for Better Senior Living

Care Cost Calculator: See Prices in Your Area

Nursing Home Data Explorer

Don’t Wait Too Long: 7 Red Flag Signs Your Parent Needs Assisted Living Now

The True Cost of Assisted Living in 2025 – And How Families Are Paying For It

Understanding Senior Living Costs: Pricing Models, Discounts & Financial Assistance

Explore Open Rooms
1 Contact details
2 What type of senior care service are you looking for?
3 What budget do you have in mind for senior care?
4 How soon do you need to find care?
5 Additional details

Thank you for your interest!

Our team will be in touch shortly to help with next steps.