Freedom Plaza
Nursing Home, Assisted Living, Independent Living, Memory Care & Respite Care · Sun City Center, FL
CMS overall rating Info CMS (the Centers for Medicare & Medicaid Services) is the federal agency that rates nursing home quality. Its Overall Rating runs from 1 to 5 stars, combining health inspections, staffing, and quality measures, with inspections weighted most heavily.

Freedom Plaza

Nursing Home, Assisted Living, Independent Living, Memory Care & Respite Care · Sun City Center, FL
CMS overall rating Info CMS (the Centers for Medicare & Medicaid Services) is the federal agency that rates nursing home quality. Its Overall Rating runs from 1 to 5 stars, combining health inspections, staffing, and quality measures, with inspections weighted most heavily.
Calculator: See prices in your area
Freedom Plaza accepts Medicare, Medicaid, and private pay.

Overview of Freedom Plaza

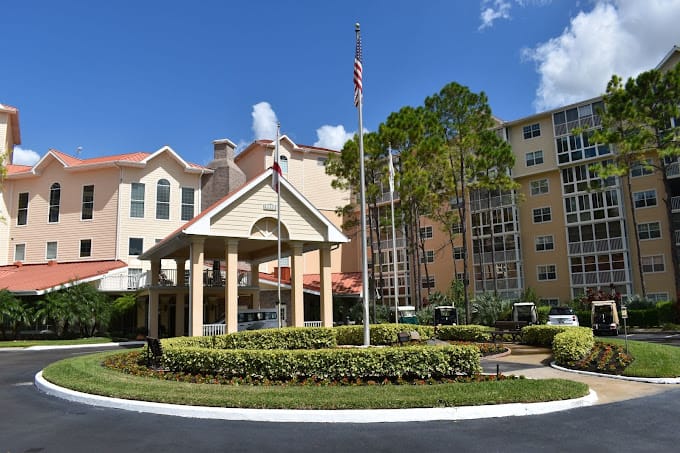
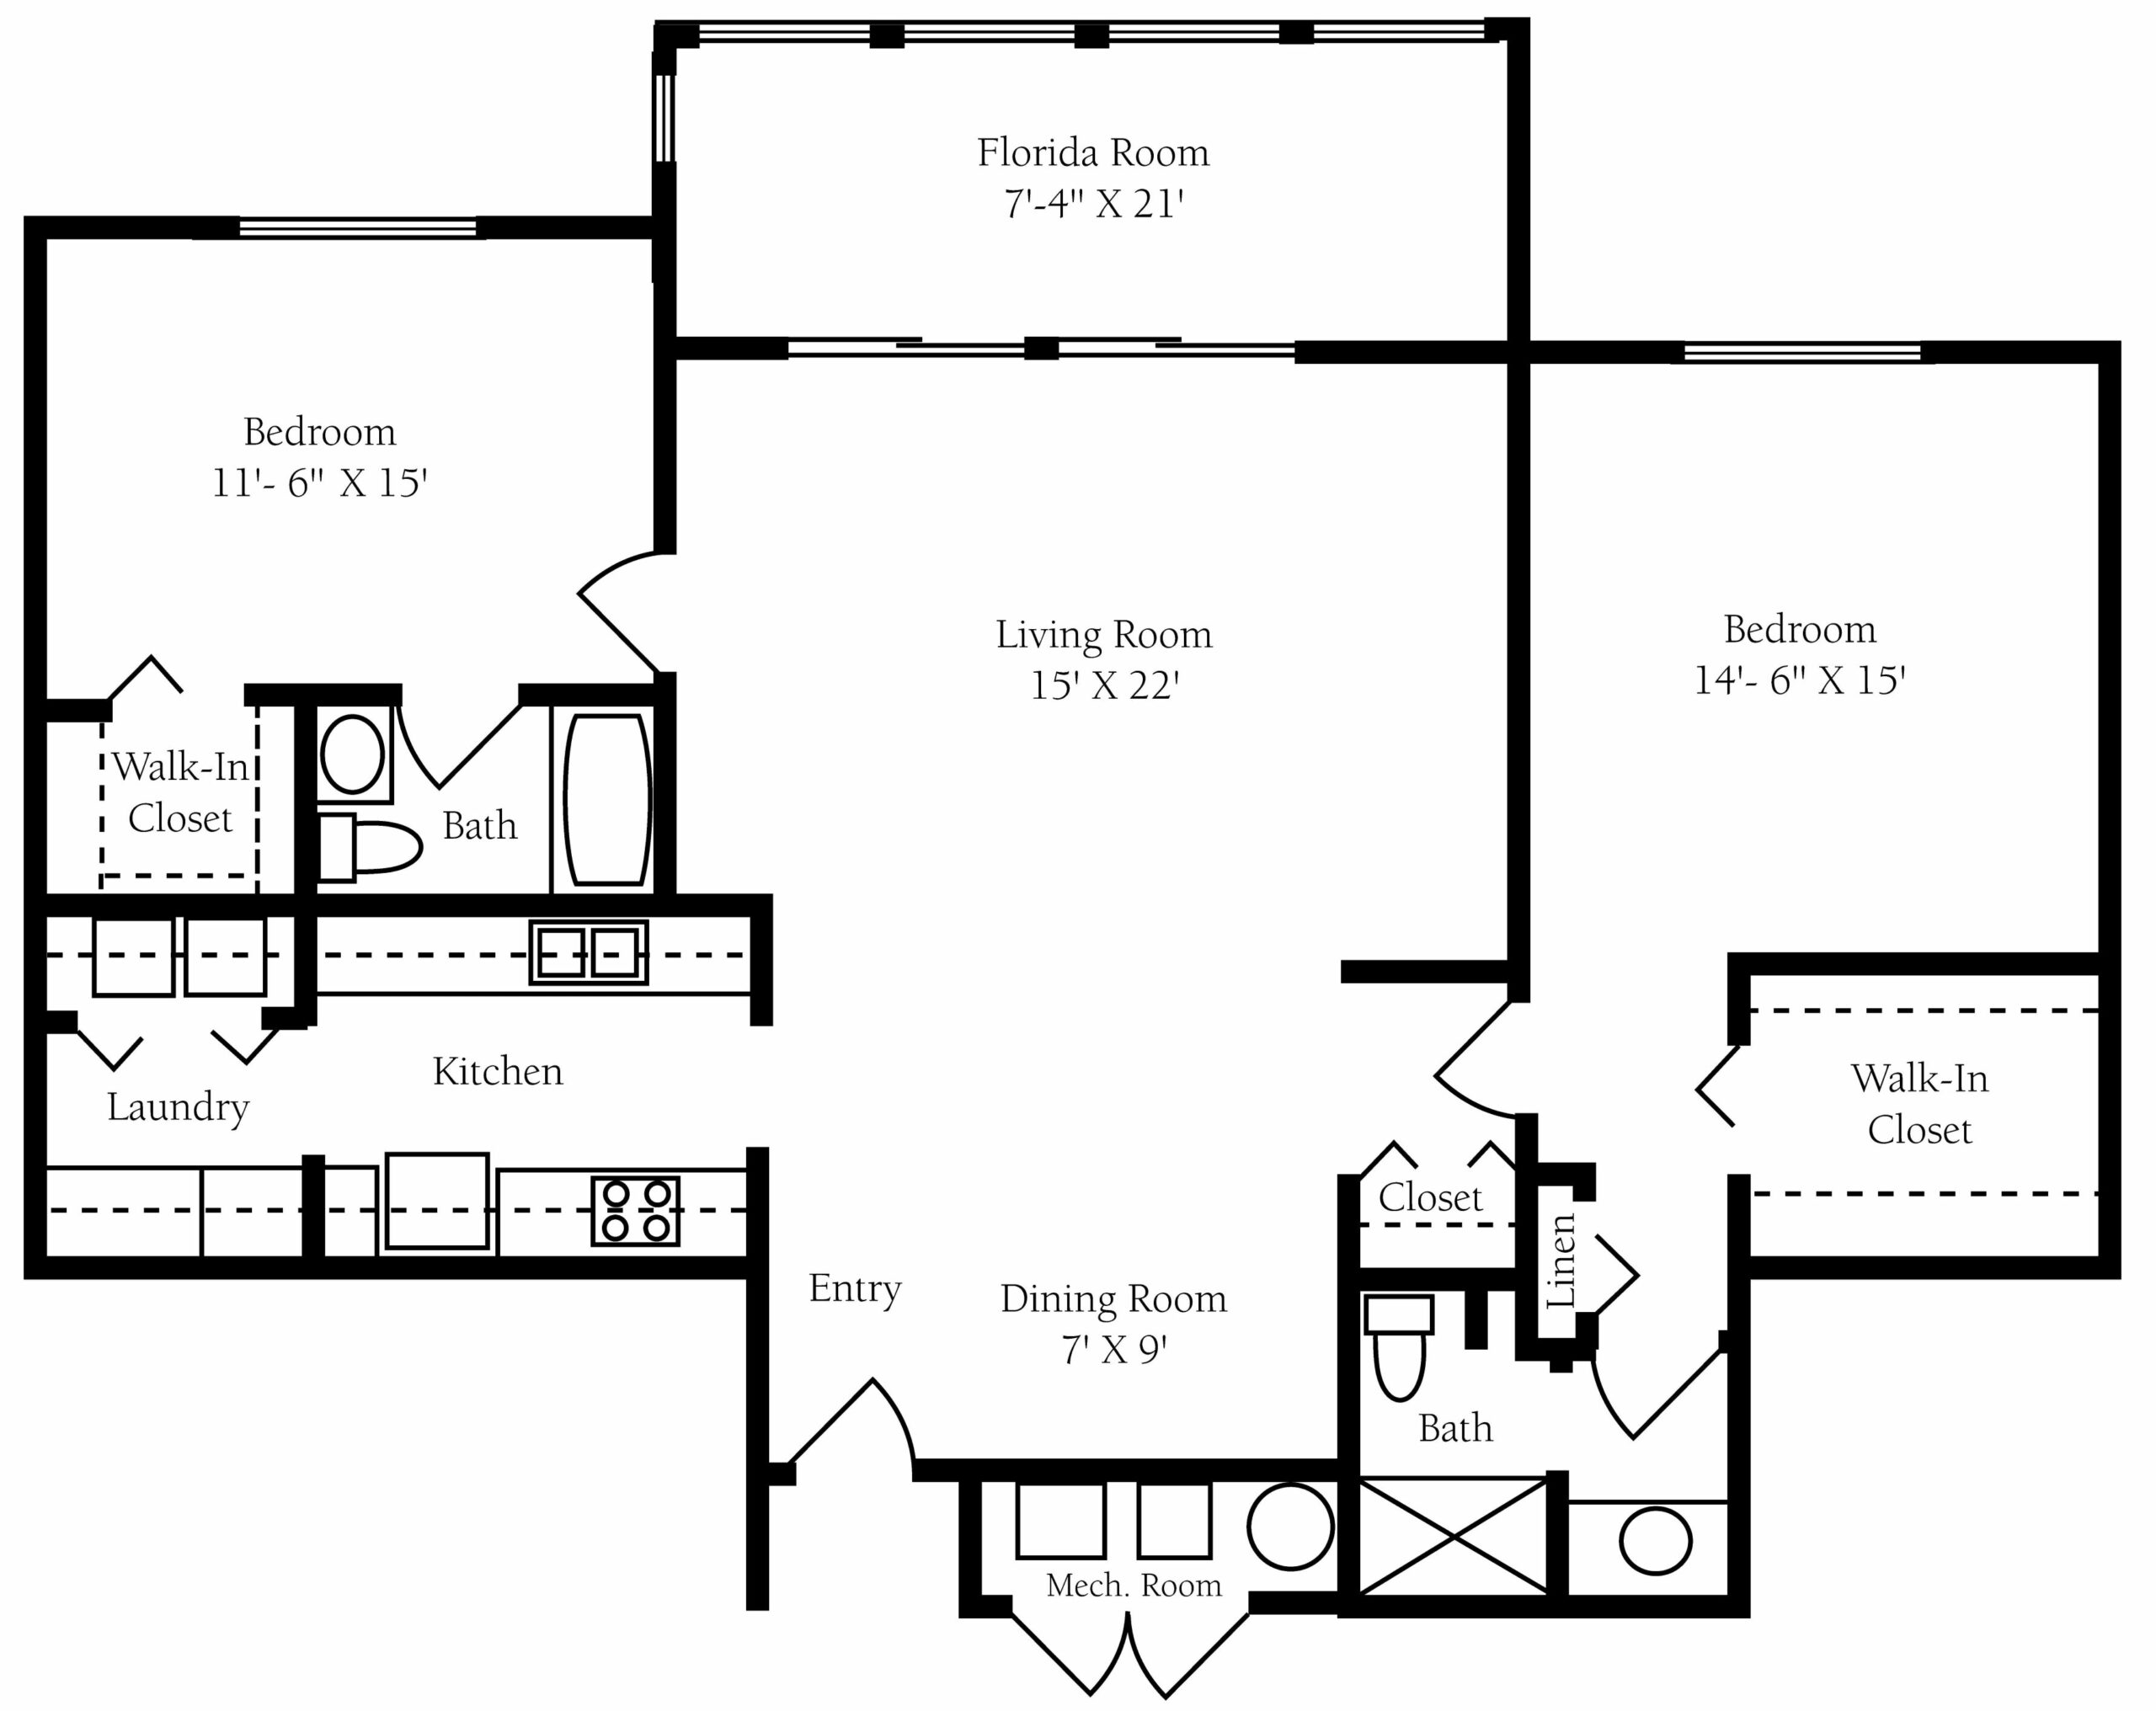
Located in Hillsborough County, Sun City Center, FL, Freedom Plaza is a multi-awarded senior living community that offers premiere assisted living, independent living, memory care, skilled nursing, and rehabilitation. The community offers an array of spacious, beautifully designed apartments with fully equipped kitchen, open-concept dining and living room area, ample closet space, and a private glass window-enclosed lanai. Residents enjoy 24/7 security, emergency response system, and a maintenance-free lifestyle with most of the chores handled by a dedicated team.

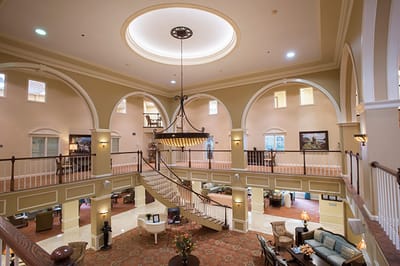
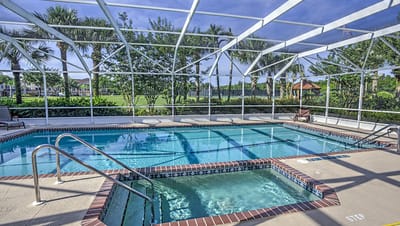
The community removes the distraction of everyday chores so residents can focus on living their lives to the fullest and engage in various activities and events that enrich their well-being. Residents can choose to participate in group fitness, including yoga and water fitness, and lifelong learning opportunities, such as arts and crafts. A wide array of indoor and outdoor amenities, such as a heated indoor pool, auditorium with dance floor, full-service salon and spa, 18-hole executive golf course and putting green, and tennis courts, provide ample opportunities for leisure and entertainment.

Quality ratings

Measured by Centers for Medicare & Medicaid Services (CMS)

Overall rating Info The Overall CMS Rating combines results from health inspections, staffing levels and quality measures. Health inspections carry the most weight. Staffing and quality scores can increase or decrease the final rating based on performance compared to state and national standards.
▼ 5.5% Below FL avg. ▼ 5.5% Below FL avg.FL average: 3.2Click the badge to see the full State ranking.Click here to see the full State ranking.
Health Inspection Info Based on the results of the facility's three most recent standard inspections and any complaint investigations. CMS reviews the number, scope, and severity of deficiencies, with more recent findings weighted more heavily.
▼ 28.9% Below FL avg. ▼ 28.9% Below FL avg.FL average: 2.8Click the badge to see the full State ranking.Click here to see the full State ranking.
Staffing Info Measures average nursing staff hours per resident per day, including Registered Nurses (RNs) and total nursing staff. Ratings are adjusted based on the level of care residents require and are compared to state and national benchmarks.
▲ 47.8% Above FL avg. ▲ 47.8% Above FL avg.FL average: 3.4Click the badge to see the full State ranking.Click here to see the full State ranking.
Quality Measures Info Based on clinical and physical health indicators reported to CMS, such as hospital readmissions, falls, pressure ulcers, and improvements in mobility. These measures reflect how well residents' health needs are being managed.
▼ 1.4% Below FL avg. ▼ 1.4% Below FL avg.FL average: 4.1Click the badge to see the full State ranking.Click here to see the full State ranking.

Staffing hours breakdown

Info Daily nursing hours per resident by staff type, reported to CMS. Higher is generally better — compare this facility to state and national averages to see where staffing stands.

Hours per resident per day — compared to Florida state averages

Total nursing care / resident Info This home is ranked 38th out of 253 homes in Florida for nurse hours. Total adjusted nursing hours per resident per day, combining RN, LPN, and aide time. CMS adjusts this for case-mix so facilities can be fairly compared.
4h 51m per day
Rank #38 / 253Nurse hours — State benchmarkedThis home is ranked 38th out of 253 homes in Florida. Shows adjusted nurse hours per resident per day benchmarked to the Florida average, with a ranking across 253 Florida facilities. More hours mean more direct care. The national average is about 3.5 hrs; below 3.0 is a red flag.Rankings are based only on facilities in Florida that report data for that category. Facilities without available data are excluded from the ranking.Click the rank badge to see the full State ranking.Click here to see the full State ranking.
This facility Florida avg (4h 2m per day)
vs Florida avg
+20%

0 of 6 metrics below state avg

Standout metric Physical Therapist is +49% above state avg
Staff typeHours / Day / Residentvs state avg
Registered Nurse (RN) Info RNs hold the highest nursing license and can assess residents, interpret test results, and direct care plans. More RN hours per day often signals stronger clinical oversight and faster response to health changes. 59m per day ▲ 34% State avg: 44m per day · National avg: 41m per day
LPN / LVN Info Licensed Practical Nurses (LPNs) or Licensed Vocational Nurses (LVNs) deliver routine hands-on care — medication administration, wound dressing, and monitoring vital signs. They work under RN supervision and make up a large share of daily bedside care. 1h 5m per day ▲ 37% State avg: 47m per day · National avg: 52m per day
Nurse Aide Info Certified Nurse Aides (CNAs) provide the most direct day-to-day assistance: bathing, dressing, feeding, and mobility. Nurse aide hours are typically the largest staffing category and directly affect residents' quality of life. 3h 3m per day ▲ 31% State avg: 2h 20m per day · National avg: 2h 20m per day
Weekend Total Nursing Info Combined nursing hours (RN + LPN + Nurse Aide) per resident per day on weekends. Staffing often drops on weekends — this figure reveals whether the facility maintains adequate coverage outside of weekday hours. 4h 36m per day ▲ 30% State avg: 3h 32m per day · National avg: 3h 27m per day
Physical Therapist Info Hours per resident per day provided by licensed Physical Therapists (PTs) or PT Assistants. PT services help residents recover mobility after injury or illness and are especially important for post-acute (short-stay) rehabilitation. 9m per day ▲ 49% State avg: 6m per day · National avg: 4m per day
Weekend RN Info Registered nurse hours specifically on weekends. Facilities sometimes reduce RN presence on Saturdays and Sundays — a low weekend RN figure compared to weekday hours can indicate reduced clinical oversight when most administrative staff are absent. 37m per day ▲ 17% State avg: 32m per day · National avg: 29m per day

Capacity and availability

This home usually has limited availability

Higher occupancy than the Florida average: 84.3%
Occupancy rate
90.2% Rank #114 / 258Occupancy rate — State benchmarkedThis home is ranked 114th out of 258 homes in Florida. Shows this facility's occupancy rate versus the Florida average, with its Statewide rank out of 258. Higher occupancy signals strong local demand and financial stability.Rankings are based only on facilities in Florida that report data for that category. Facilities without available data are excluded from the ranking.Click the rank badge to see the full State ranking.Click here to see the full State ranking.
Avg. Length of Stay
38 days
Bed community size
113-bed community Rank #367 / 1074Bed count — State benchmarkedThis home is ranked 367th out of 1074 homes in Florida. Shows this facility's certified or reported bed count compared to other Florida facilities. Larger communities may offer more amenities, programs, and on-site services for residents and families.Rankings are based only on facilities in Florida that report data for that category. Facilities without available data are excluded from the ranking.Click the rank badge to see the full State ranking.Click here to see the full State ranking.
A larger shared setting that may offer more common spaces and organized community services.
Walk Score
Walk Score: 8 / 100 Rank #1301 / 1486Walk Score — State benchmarkedThis home is ranked 1301st out of 1486 homes in Florida. Shows how walkable this facility's neighborhood is compared to the average Walk Score across Florida facilities. Higher scores benefit residents, families, and staff.Rankings are based only on facilities in Florida that report data for that category. Facilities without available data are excluded from the ranking.Click the rank badge to see the full State ranking.Click here to see the full State ranking.
Car-dependent. Most errands require a car, with limited nearby walkable options.

About this community

License Details

Accreditations2024 a Best Continuing Care Retirement Community by U.S. News & World Report

Therapy & Rehabilitation

1 service
Rehabilitation Services

Amenities & Lifestyle

Volunteer Program

Contact Freedom Plaza

Staffing Data

Reporting period: October 1 – December 31, 2025 (Q4 2025). Source: CMS Payroll-Based Journal report.

Total staff 177
Employees 147
Contractors 30
Staff to resident ratio 1.75 : 1
19% more staff per resident than Florida average
Florida average ratio: 1.47 : 1 Florida average ratio: 1.47 : 1See full Florida ranking
Avg staff/day 76
Average shift 7.5 hours
5% worse than Florida average
Florida average: 7.9 hours Florida average shift: 7.9 hoursSee full Florida ranking
Total staff hours (quarter) 52,458

Nursing staff breakdown

Q4 2025 · Oct 1 – Dec 31 More info This data comes from the CMS Payroll-Based Journal report covering October 1 – December 31, 2025.
Registered Nurse

Manages medical care and health needs.

RN Staff Info All 16 RN Staff are full-time employees. No contractors work on this role. 16
Average shift length Info Average shift length. Calculated as total hours divided by days worked and average staff per day. 7.5 hours
Licensed Practical Nurse

Assists with medical care and medications.

LPN Staff Info All 27 LPN Staff are full-time employees. No contractors work on this role. 27
Average shift length Info Average shift length. Calculated as total hours divided by days worked and average staff per day. 7.7 hours
Certified Nursing Assistant

Helps with daily care and mobility.

CNA Staff Info All 77 CNA Staff are full-time employees. No contractors work on this role. 77
Average shift length Info Average shift length. Calculated as total hours divided by days worked and average staff per day. 7.7 hours

Contractor staffing

Q4 2025 · Oct 1 – Dec 31 More info This data comes from the CMS Payroll-Based Journal report covering October 1 – December 31, 2025.

Total hours from contractors

12.9%

6,760 contractor hours this quarter

Physical Therapy Assistant: 8 Speech Language Pathologist: 6 Respiratory Therapy Technician: 5 Qualified Social Worker: 5 Physical Therapy Aide: 2 Occupational Therapy Assistant: 1 Administrator: 1 Diagnostic X-ray Services Staff: 1 Medical Director: 1

Staff by category

Q4 2025 · Oct 1 – Dec 31 More info This data comes from the CMS Payroll-Based Journal report covering October 1 – December 31, 2025.
Certified Nursing Assistant7707725,48392100%7.7
Licensed Practical Nurse270278,50492100%7.7
Clinical Nurse Specialist150154,55192100%8.2
Registered Nurse160163,16392100%7.5
Physical Therapy Assistant0882,2747784%6.6
Other Dietary Services Staff6061,76492100%7.4
Speech Language Pathologist0661,6348087%6.6
Respiratory Therapy Technician0551,1827986%6.9
Dental Services Staff3031,0286672%7.9
Physical Therapy Aide0228226571%7.1
RN Director of Nursing1014966267%8
Nurse Practitioner1014485661%8
Qualified Social Worker0554186267%6.7
Administrator0113684650%8
Occupational Therapy Aide1012615257%5
Occupational Therapy Assistant011465762%0.8
Diagnostic X-ray Services Staff011111112%1
Medical Director011633%2
77 Certified Nursing Assistant
% of Days 100%
27 Licensed Practical Nurse
% of Days 100%
15 Clinical Nurse Specialist
% of Days 100%
16 Registered Nurse
% of Days 100%
8 Physical Therapy Assistant
% of Days 84%
6 Other Dietary Services Staff
% of Days 100%
6 Speech Language Pathologist
% of Days 87%
5 Respiratory Therapy Technician
% of Days 86%
3 Dental Services Staff
% of Days 72%
2 Physical Therapy Aide
% of Days 71%
1 RN Director of Nursing
% of Days 67%
1 Nurse Practitioner
% of Days 61%
5 Qualified Social Worker
% of Days 67%
1 Administrator
% of Days 50%
1 Occupational Therapy Aide
% of Days 57%
1 Occupational Therapy Assistant
% of Days 62%
1 Diagnostic X-ray Services Staff
% of Days 12%
1 Medical Director
% of Days 3%

Penalties and fines

Federal penalties imposed by CMS for regulatory violations, including civil money penalties (fines) and denials of payment for new Medicare/Medicaid admissions.

Source: CMS Penalties Database

No penalties in the past 3 years

No civil money penalties or payment denials were reported in the last 3 years.

Quality of care over time

These measures show how residents usually do over time at this home, based on health outcomes and preventive care.

High-risk clinical events score Info A composite score based on pressure ulcers, falls with injury, weight loss, walking ability decline, and activities of daily living decline. 15.0
102% worse than Florida average

Florida average: 7.4

Functional decline score Info A composite score based on activities of daily living decline, walking ability decline, and incontinence. 29.4
138% worse than Florida average

Florida average: 12.4

Long-stay resident measures
Need for Help with Daily Activities Increased Info Percent of long-stay residents whose need for help with daily activities has increased 23.9%
128% worse than Florida average

Florida average: 10.5%

Walking Ability Worsened Info Percent of long-stay residents whose ability to move independently worsened 32.1%
148% worse than Florida average

Florida average: 12.9%

Low Risk Residents with Bowel/Bladder Incontinence Info Percent of low risk long-stay residents who lose control of their bowels or bladder 32.3%
139% worse than Florida average

Florida average: 13.5%

Falls with Major Injury Info Percent of long-stay residents experiencing one or more falls with major injury 3.1%
19% worse than Florida average

Florida average: 2.6%

High Risk Residents with Pressure Ulcers Info Percent of long-stay high risk residents with pressure ulcers 8.9%
66% worse than Florida average

Florida average: 5.4%

Urinary Tract Infection Info Percent of long-stay residents with a urinary tract infection 4.9%
457% worse than Florida average

Florida average: 0.9%

Lost Too Much Weight Info Percent of long-stay residents who lose too much weight 6.9%
16% worse than Florida average

Florida average: 6.0%

Depressive Symptoms Info Percent of long-stay residents who have depressive symptoms 2.1%
37% better than Florida average

Florida average: 3.3%

Antipsychotic Use Info Percent of long-stay residents who received an antipsychotic medication 5.3%
34% better than Florida average

Florida average: 8.0%

Pneumococcal Vaccine Info Percent of long-stay residents assessed and appropriately given the pneumococcal vaccine 99.5%
In line with Florida average

Florida average: 97.7%

Influenza Vaccine Info Percent of long-stay residents assessed and appropriately given the seasonal influenza vaccine 100.0%
In line with Florida average

Florida average: 99.2%

Short-stay resident measures
Pneumococcal Vaccine Info Percent of short-stay residents assessed and appropriately given the pneumococcal vaccine 99.1%
5% better than Florida average

Florida average: 94.0%

Antipsychotic medication increase Info Percent of short-stay residents who newly received an antipsychotic medication 0.4%
76% better than Florida average

Florida average: 1.5%

Influenza Vaccine Info Percent of short-stay residents assessed and appropriately given the seasonal influenza vaccine 94.2%
In line with Florida average

Florida average: 94.7%

Breakdown by payment type

Medicare

35% of new residents, usually for short-term rehab.

Typical stay 26 days

Private pay

61% of new residents, often for short stays.

Typical stay 3 - 4 months

Medicaid

3% of new residents, often for long-term daily care.

Typical stay 1 years

Facility Characteristics

Source: CMS Long-Term Care Facility Characteristics (Data as of Jan 2026)

Total residents 101
Medicare
29
28.7% of residents
Medicaid
13
12.9% of residents
Private pay or other
59
58.4% of residents
Programs & Services
Residents Group

Residents meet regularly to discuss policies, care quality, and activities

Family Member Group

Family members meet regularly to discuss policies, care quality, and activities

CCRC

Part of a Continuing Care Retirement Community offering multiple care levels

Active Family Council

Organized group of family members that meets regularly to discuss facility policies, resident care, and activities.

Active Resident Council

Organized group of residents that meets regularly to discuss facility policies, quality of life, and activities.

Finances and operations

Based on CMS SNF Cost Report for fiscal year ending in 12/2023.

For-profit
Operated by a single business entity.
Net patient revenue Info Net patient revenue — what the home actually collects for resident care, after contractual allowances, bad debt and discounts are subtracted from its gross charges (CMS cost report, Worksheet G-3). It covers resident care only; money the home earns from other sources is shown separately as "Other income."
$18.4M
Net patient income Info Net patient income: net patient revenue minus the home's total operating expenses. A positive figure means it earns more from resident care than it spends to deliver it; a negative figure means the opposite. It excludes non-operating "other income."
-$31.4M
For-profit Operated by a single business entity.
Net patient revenue Info Net patient revenue — what the home actually collects for resident care, after contractual allowances, bad debt and discounts are subtracted from its gross charges (CMS cost report, Worksheet G-3). It covers resident care only; money the home earns from other sources is shown separately as "Other income."
$18.4M Rank #6 / 257Revenue — State benchmarkedThis home is ranked 6th out of 257 homes in Florida. Shows this facility's annual revenue compared to the Florida average. Higher revenue generally means more resources for staffing and capital — read alongside Payroll %.Rankings are based only on facilities in Florida that report data for that category. Facilities without available data are excluded from the ranking.Click the rank badge to see the full State ranking.Click here to see the full State ranking.
Net patient income Info Net patient income: net patient revenue minus the home's total operating expenses. A positive figure means it earns more from resident care than it spends to deliver it; a negative figure means the opposite. It excludes non-operating "other income."
-$31.4M
Other income Info Money the home earns outside of resident care — such as investments, grants, rentals and other non-operating sources (CMS cost report, Worksheet G-3). It is tracked separately from net patient revenue: it is not part of that figure, and it is not included in net patient income.
$33.8M
Payroll costs Info Staff salaries plus wage-related costs — benefits such as payroll taxes, health insurance and retirement — from the home's own accounting records (CMS cost report, Worksheet A). Contract or agency labor is counted separately, under other operating costs. Rank #7 / 257Payroll — State benchmarkedThis home is ranked 7th out of 257 homes in Florida. Shows total annual staff payroll benchmarked to the Florida average. Higher payroll investment relative to peers often signals better staffing and less reliance on cheaper contract labor.Rankings are based only on facilities in Florida that report data for that category. Facilities without available data are excluded from the ranking.Click the rank badge to see the full State ranking.Click here to see the full State ranking.
$19.4M 105.3% of net patient revenue Info Payroll as a share of revenue: staff salaries and wage-related benefits divided by net patient revenue. A higher figure means more of each revenue dollar goes to staff pay. Rank #212 / 257Payroll % — State benchmarkedThis home is ranked 212th out of 257 homes in Florida. Shows payroll as a percentage of revenue versus the Florida average. Well-run Florida facilities typically land around 49–56% — the top third Statewide. Below 25% may signal understaffing or heavy agency use — read with Staffing ratings.Rankings are based only on facilities in Florida that report data for that category. Facilities without available data are excluded from the ranking.Click the rank badge to see the full State ranking.Click here to see the full State ranking.
Other operating costs Info Everything it costs to run the home apart from payroll — food, utilities, supplies, maintenance, contract labor and administration. Calculated as total operating expense minus payroll (staff salaries and wage-related benefits).
$30.4M
Total costs Info The home's total operating expense for the year — all the costs of running it, salaries included (CMS cost report, Worksheet G-3).
$49.8M

What does this home offer?

Pets allowed icon
Pets allowed icon

Pets Allowed

Housing options icon

Housing Options: Studio / 1 Bed / 2 Bed

Building type icon
Building type icon

Building Type: Mid-rise

Transportation services icon

Transportation Services

Fitness and recreation icon

Fitness and Recreation

Who this home usually serves

TYPE OF STAY

Primarily short stays

Residents typically stay for brief periods, with frequent admissions and discharges throughout the year.

Most new residents arrive under private pay (61% of admissions), and a typical private pay stay runs around 3 - 4 months.

Admissions
923 total

Coverage residents most often arrive under.

Medicare 35%
Private pay 61%
Medicaid 3%
Discharges
1,011 total

Coverage residents most often leave under.

Medicare 30%
Private pay 61%
Medicaid 9%

Living Spaces & Floor Plans for Freedom Plaza

Places of interest near Freedom Plaza

Address 1.0 miles from city center Info Estimated distance in miles from Sun City Center's city center to Freedom Plaza's address, calculated via Google Maps.

Calculate Travel Distance to Freedom Plaza

Add your location

Address

Compare Nursing Homes around Hillsborough County

The information below is reported by the Florida Agency for Health Care Administration (AHCA).

3 facilities compared · CMS & FL Dept. of Health data

Sun Towers Retirement Community
NH
AL
IL
MC
RC
Sun City Center
286
Facility 286
FL AVG 89
Rank #6 / 1074
94.2%
Facility 94.2%
FL AVG 84.3%
Rank #39 / 258
+12%
3.76
Facility 3.76
FL AVG 4.04
Rank #145 / 253
-35%-7%
$0
Facility $0
FL AVG $78.9k
Rank #1 / 258
88
Facility 88
FL AVG 83
Rank #383 / 876
11
Facility 11
FL AVG 19.7
Rank #53 / 252
3.7
Facility 3.7
FL AVG 4.5
Rank #94 / 252
-126A+
54
Facility 54
FL AVG 40
Rank #448 / 1486
Sak Jr. LLC
$19.7M
Facility $19.7M
FL AVG $15.7M
Rank #73 / 257
$12.0M
Facility $12.0M
FL AVG $6.1M
Rank #46 / 257
60.7%
Facility 60.7%
FL AVG 39.8%
Rank #81 / 257
105319
Tampa Lakes Health And Rehabilitation Center
NH
HC
MC
PC
RC
Lutz (North Tampa)
179
Facility 179
FL AVG 89
Rank #78 / 1074
37.4%
Facility 37.4%
FL AVG 84.3%
Rank #252 / 258
-56%
3.50
Facility 3.50
FL AVG 4.04
Rank #216 / 253
-19%-13%
$0
Facility $0
FL AVG $78.9k
Rank #1 / 258
-
16
Facility 16
FL AVG 19.7
Rank #107 / 252
2.7
Facility 2.7
FL AVG 4.5
Rank #39 / 252
-67A+
19
Facility 19
FL AVG 40
Rank #1109 / 1486
-
$22.0M
Facility $22.0M
FL AVG $15.7M
Rank #47 / 257
$10.9M
Facility $10.9M
FL AVG $6.1M
Rank #51 / 257
49.8%
Facility 49.8%
FL AVG 39.8%
Rank #167 / 257
106112
Freedom Plaza
NH
AL
IL
MC
RC
Sun City Center (Arbors At Freedom Plaza)
113
Facility 113
FL AVG 89
Rank #367 / 1074
90.2%
Facility 90.2%
FL AVG 84.3%
Rank #114 / 258
+7%
4.84
Facility 4.84
FL AVG 4.04
Rank #38 / 253
-25%+20%
$0
Facility $0
FL AVG $78.9k
Rank #1 / 258
-
19
Facility 19
FL AVG 19.7
Rank #135 / 252
6.3
Facility 6.3
FL AVG 4.5
Rank #206 / 252
-91-
8
Facility 8
FL AVG 40
Rank #1301 / 1486
Christopher Grella
$18.4M
Facility $18.4M
FL AVG $15.7M
Rank #6 / 257
$19.4M
Facility $19.4M
FL AVG $6.1M
Rank #7 / 257
105.3%
Facility 105.3%
FL AVG 39.8%
Rank #212 / 257
105866

Financial Assistance for
Nursing Home in Florida

Freedom Plaza is located in Sun City Center, Florida.
Here are the financial assistance programs available to residents in Florida.

Get Financial aid guidance

Long-Term Care Waiver

Florida Medicaid LTC Waiver

Age 65+ or 21+ disabled
General Florida resident, Medicaid- eligible, nursing home-level care need.
Income Limits (2025) ~$2,829/month 300% FBR, individual
Asset Limits $2,000 (individual), $3,000 (couple).
FL

High demand; waitlists common.

Benefits
In-home care (6-8 hours/day) Assisted living Respite (240 hours/year) Case management

Community Care for the Elderly (CCE)

Florida CCE

Age 60+
General Florida resident, at risk of nursing home.
Income Limits ~$2,000/month varies
Asset Limits $5,000 individual
FL

Limited funding; regional variation.

Benefits
Homemaker services (3-5 hours/week) Adult day care (~$60/day) Respite (up to 10 days/year)

Home Care for the Elderly (HCE)

Florida Home Care for the Elderly

Age 60+
General Florida resident, at risk of nursing home placement; caregiver must be approved.
Income Limits (2025) ~$2,829/month individual, aligned with Medicaid thresholds
Asset Limits ~$2,000 (individual); varies by case manager discretion.
FL

Limited funding (~3,500 served annually); prioritizes low-income frail seniors.

Benefits
Basic subsidy (~$160/month) for housing/medical costs; special subsidies for supplies/services (e.g., incontinence supplies, ~$50-$200/month)

Program of All-Inclusive Care for the Elderly (PACE)

Florida Medicaid PACE

Age 55+
General Florida resident, nursing home-level care need, safe with PACE support.
Income Limits (2025) ~$2,829/month 300% FBR
Asset Limits $2,000 (individual), $3,000 (couple).
FL

Limited to specific counties (e.g., Hillsborough, Miami-Dade); ~10 sites statewide.

Benefits
Personal care (5-7 hours/day) Medical care Meals Transportation Therapy

Optional State Supplementation (OSS)

Florida Optional State Supplementation

Age 65+ or disabled
General Florida resident, living in approved facility, receiving SSI or low-income.
Income Limits (2025) ~$1,004/month individual, including SSI
Asset Limits $2,000 (individual), $3,000 (couple).
FL

Limited to specific facility types; ~$78.40/month max supplement.

Benefits
Cash payment (~$78.40/month) for room/board or personal needs in facilities

Frequently Asked Questions about Freedom Plaza

What neighborhood is Freedom Plaza in?

Freedom Plaza is in the Arbors at Freedom Plaza neighborhood.

Is Freedom Plaza in a walkable area?

Freedom Plaza has a walk score of 8. Car-dependent. Most errands require a car, with limited nearby walkable options.

What is the occupancy rate at Freedom Plaza?

Freedom Plaza's occupancy is 90.2%.

Does Freedom Plaza operate as a for-profit or non-profit?

Freedom Plaza is registered as a for-profit.

Are there photos of Freedom Plaza?

Yes — there are 3 photos of Freedom Plaza in the photo gallery on this page.

What is the address of Freedom Plaza?

Freedom Plaza is located at 1010 American Eagle Blvd, Sun City Center, FL 33573.

What is the phone number of Freedom Plaza?

(813) 633-4340 will put you in contact with the team at Freedom Plaza.

Guides for Better Senior Living

Care Cost Calculator: See Prices in Your Area

Nursing Home Data Explorer

Don’t Wait Too Long: 7 Red Flag Signs Your Parent Needs Assisted Living Now

The True Cost of Assisted Living in 2025 – And How Families Are Paying For It

Understanding Senior Living Costs: Pricing Models, Discounts & Financial Assistance