Total health inspections
10
Indiana average 6
Last Health inspection on Mar 2025

We arrange tours, appointments, and even moving support so you don’t have to
Thank you for your interest!
Our team will be in touch shortly to help with next steps.
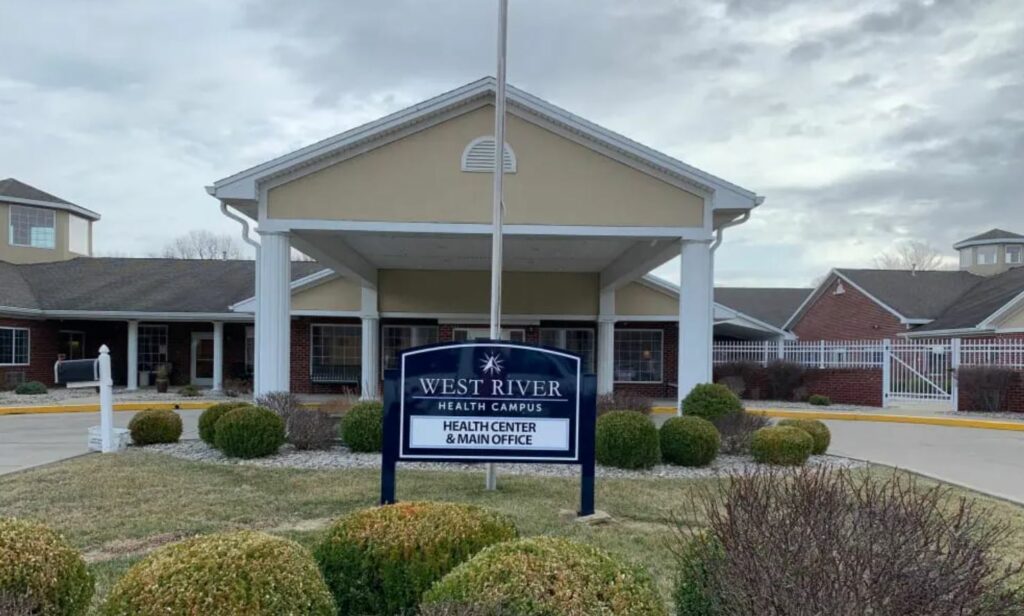
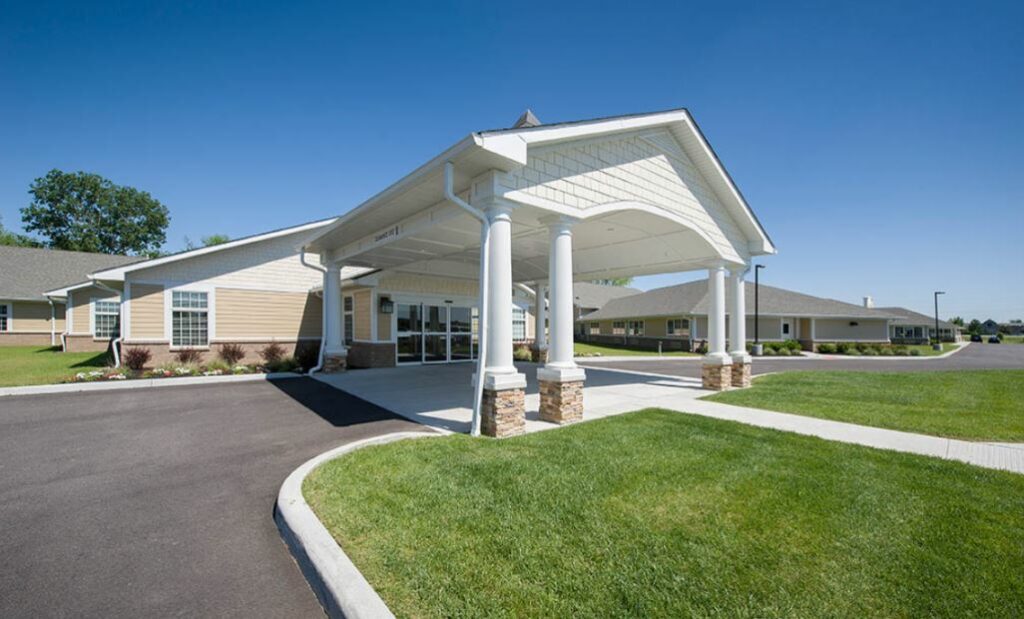
Golden Living Center Woodbridge is an exceptional senior living community offering a diverse range of options including specialized memory care and skilled nursing services. For those seeking memory care, this center stands as a beacon of understanding and support. Every corner of the facility has been purposefully crafted to provide a secure and nurturing haven for individuals with memory loss.
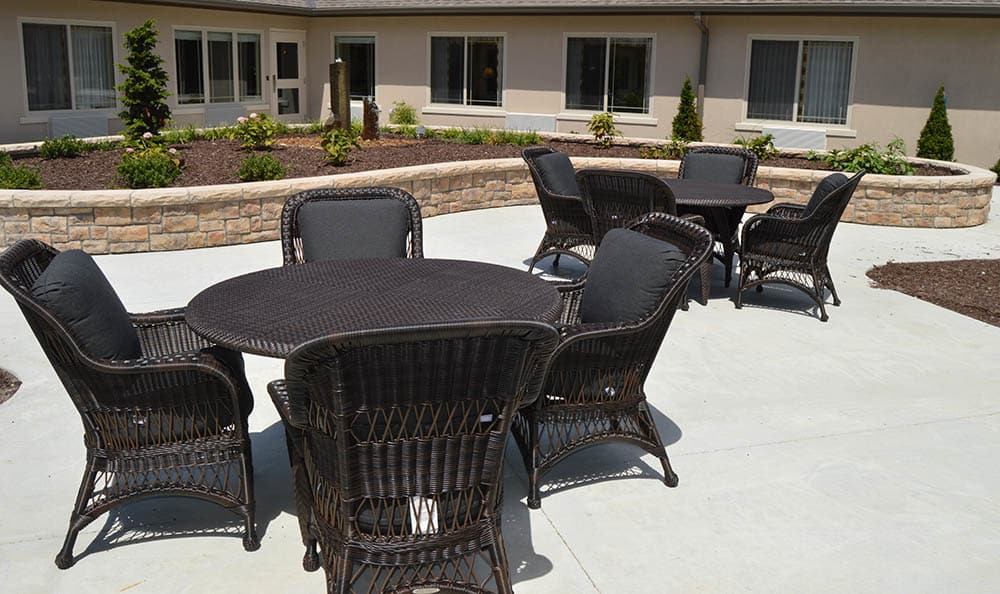
Accessibility is a cornerstone at Golden Living Center Woodbridge. With thoughtfully designed spaces that cater to wheelchair users and inviting indoor and outdoor common areas, residents are treated to an environment that seamlessly blends comfort with the beauty of nature. It’s a place where cherished memories are made, laughter echoes through the halls, and meaningful connections are formed.
May offer a more intimate, personalized care environment.
Lower occupancy suggests more openings may be available.
Most residents stay for extended periods and receive ongoing daily care.
23% of new residents, usually for short-term rehab.
24% of new residents, often for short stays.
53% of new residents, often for long-term daily care.
Indiana average 6
Last Health inspection on Mar 2025
Indiana average 25
Indiana average 4.12
Health citations are formal notices following inspections when they fail to comply with safety and care standards.
33 of 42 citations resulted from standard inspections; and 9 of 42 resulted from complaint investigations.
Indiana average: 0.2
Indiana average: 0.6
Data sourced from CMS Health Deficiencies reports. Citation severity codes range from A (least serious) to L (most serious). Immediate Jeopardy (J-L) citations indicate situations where the facility's noncompliance has placed residents at risk of death or serious harm.
Assisted Living A licensed, long-term care setting for seniors or individuals with disabilities who need help with daily activities — like bathing, dressing, and medication management — but not 24-hour skilled nursing. Offers housing, meals, and around-the-clock support while aiming to maximize resident independence.
Memory Care Secured, specialized care for people living with Alzheimer's or dementia. Staff trained in cognitive impairment, with higher staff-to-resident ratios and an environment designed to reduce confusion and wandering risk.
Nursing Home Licensed facility providing 24/7 skilled nursing care for residents with complex, ongoing medical needs. Staffed by RNs, LPNs, and CNAs. Inspected and star-rated annually by CMS. Accepts Medicare (short-term rehab) and Medicaid (long-term care).
Assisted Living A licensed, long-term care setting for seniors or individuals with disabilities who need help with daily activities — like bathing, dressing, and medication management — but not 24-hour skilled nursing. Offers housing, meals, and around-the-clock support while aiming to maximize resident independence.
Independent Living Lifestyle-focused communities for older adults offering dining, activities, and transportation with minimal personal care. Best for active, independent seniors who want community without medical support.
Memory Care Secured, specialized care for people living with Alzheimer's or dementia. Staff trained in cognitive impairment, with higher staff-to-resident ratios and an environment designed to reduce confusion and wandering risk.
Nursing Home Licensed facility providing 24/7 skilled nursing care for residents with complex, ongoing medical needs. Staffed by RNs, LPNs, and CNAs. Inspected and star-rated annually by CMS. Accepts Medicare (short-term rehab) and Medicaid (long-term care).
Assisted Living A licensed, long-term care setting for seniors or individuals with disabilities who need help with daily activities — like bathing, dressing, and medication management — but not 24-hour skilled nursing. Offers housing, meals, and around-the-clock support while aiming to maximize resident independence.
Memory Care Secured, specialized care for people living with Alzheimer's or dementia. Staff trained in cognitive impairment, with higher staff-to-resident ratios and an environment designed to reduce confusion and wandering risk.
Memory Care Secured, specialized care for people living with Alzheimer's or dementia. Staff trained in cognitive impairment, with higher staff-to-resident ratios and an environment designed to reduce confusion and wandering risk.
Respite Care Short-term temporary care — days to weeks — to give family caregivers a break. Full care provided during the stay. Often used after hospitalization or to trial a facility before a permanent placement decision.
![]() 1.1 miles from city center — 0.27 miles to nearest hospital (Deaconess Resource Center)
1.1 miles from city center — 0.27 miles to nearest hospital (Deaconess Resource Center)
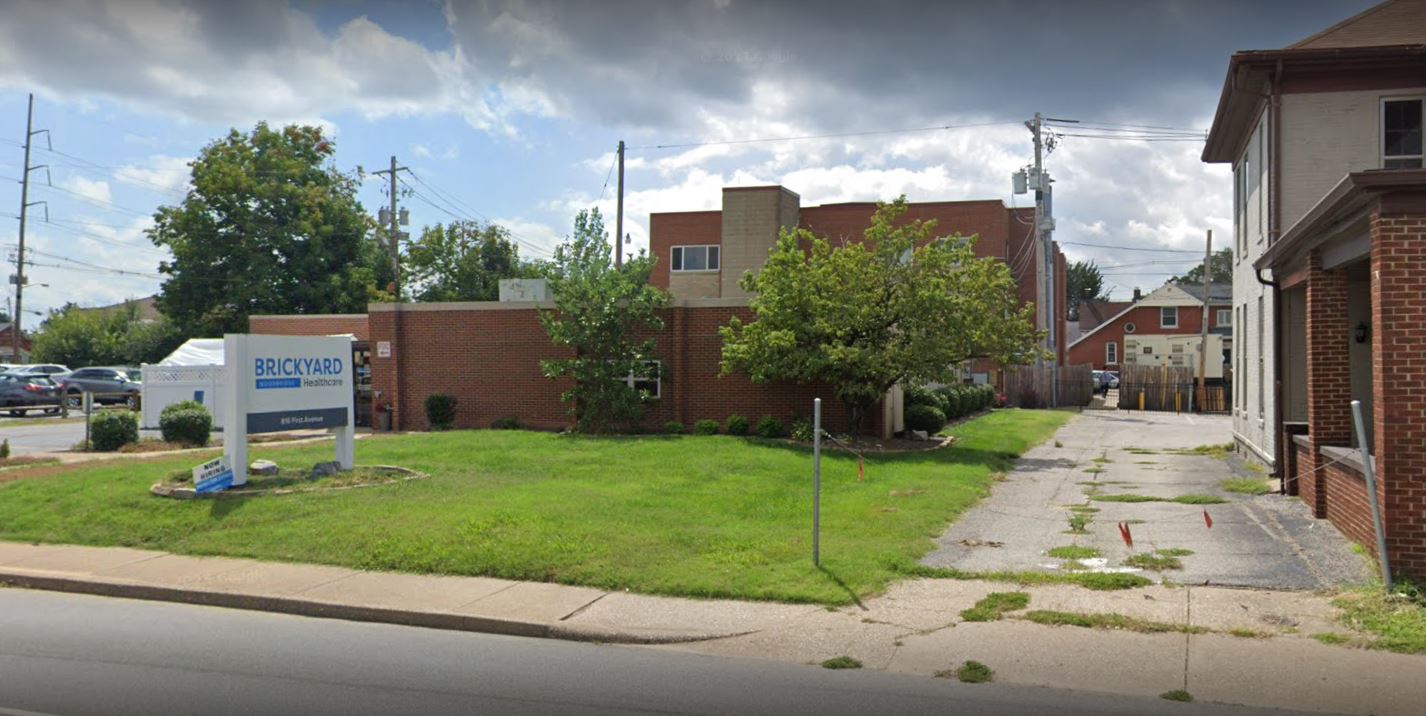
![]() 816 N First Ave, Evansville, IN 47710
816 N First Ave, Evansville, IN 47710
Add your location
This data corresponds to Q2 2025 and is based on CMS Payroll-Based Journal.
Indiana average ratio: 0.00:1
Indiana average: 7.7 hours
Manages medical care and health needs.
No contractors work on this role.
Assists with medical care and medications.
No contractors work on this role.
Helps with daily care and mobility.
This role is partially covered by contractors.
Total hours from contractors
3,389 contractor hours this quarter
| Certified Nursing Assistant | 30 | 1 | 31 | 8,104 | 91 | 100% | 8.8 |
| Medication Aide/Technician | 13 | 0 | 13 | 3,513 | 91 | 100% | 9.5 |
| Licensed Practical Nurse | 7 | 0 | 7 | 2,887 | 91 | 100% | 8.6 |
| Registered Nurse | 10 | 0 | 10 | 1,770 | 91 | 100% | 10.2 |
| Other Dietary Services Staff | 4 | 0 | 4 | 943 | 87 | 96% | 7 |
| Physical Therapy Assistant | 0 | 3 | 3 | 920 | 75 | 82% | 7.3 |
| Clinical Nurse Specialist | 3 | 2 | 5 | 786 | 63 | 69% | 7.9 |
| Dental Services Staff | 3 | 1 | 4 | 587 | 63 | 69% | 8 |
| Physical Therapy Aide | 0 | 3 | 3 | 515 | 58 | 64% | 6.4 |
| Administrator | 1 | 0 | 1 | 504 | 63 | 69% | 8 |
| Nurse Practitioner | 2 | 0 | 2 | 472 | 55 | 60% | 8 |
| Dietitian | 1 | 0 | 1 | 452 | 63 | 69% | 7.2 |
| Speech Language Pathologist | 0 | 3 | 3 | 411 | 59 | 65% | 5.9 |
| Respiratory Therapy Technician | 0 | 4 | 4 | 371 | 54 | 59% | 6.7 |
| Qualified Social Worker | 0 | 2 | 2 | 253 | 51 | 56% | 5 |
| Nurse Aide in Training | 2 | 0 | 2 | 141 | 16 | 18% | 8.8 |
| Occupational Therapy Aide | 1 | 1 | 2 | 117 | 55 | 60% | 1.8 |
| Medical Director | 0 | 1 | 1 | 35 | 11 | 12% | 3.2 |
| Occupational Therapy Assistant | 0 | 2 | 2 | 20 | 5 | 5% | 3.9 |
| RN Director of Nursing | 0 | 1 | 1 | 16 | 2 | 2% | 8 |
Source: CMS Long-Term Care Facility Characteristics (Data as of Jan 2026)
Residents meet regularly to discuss policies, care quality, and activities
Organized group of residents that meets regularly to discuss facility policies, quality of life, and activities.
Data sourced from CMS Long-Term Care Facility Characteristics quarterly report. Payer mix reflects the current resident census by primary payment source.
These measures show how residents usually do over time at this home, based on health outcomes and preventive care.
Indiana average: 8.0
Indiana average: 17.1
Indiana average: 12.0%
Indiana average: 14.4%
Indiana average: 24.6%
Indiana average: 3.9%
Indiana average: 4.4%
Indiana average: 1.2%
Indiana average: 5.7%
Indiana average: 24.1%
Indiana average: 12.4%
Indiana average: 93.7%
Indiana average: 95.4%
Indiana average: 81.7%
Indiana average: 1.4%
Indiana average: 79.0%
Quality measures are calculated from Minimum Data Set (MDS) assessments. For most measures, lower percentages indicate better care quality.
Historical financial and operational data for Golden Living Center Woodbridge based on CMS SNF Cost Reports.
Loading trend charts...
Care Cost Calculator: See Prices in Your Area
Nursing Home Data Explorer
Don’t Wait Too Long: 7 Red Flag Signs Your Parent Needs Assisted Living Now
The True Cost of Assisted Living in 2025 – And How Families Are Paying For It
Understanding Senior Living Costs: Pricing Models, Discounts & Financial Assistance

Touring a community? Use this expert-backed checklist to stay organized, ask the right questions, and find the perfect fit.
We'll send you a PDF version of the touring checklist.