


Hospitalizations per 1,000 days
 Number of hospitalizations per 1,000 long-stay resident days.
2.11
Number of hospitalizations per 1,000 long-stay resident days.
2.11
Indiana average: 1.60
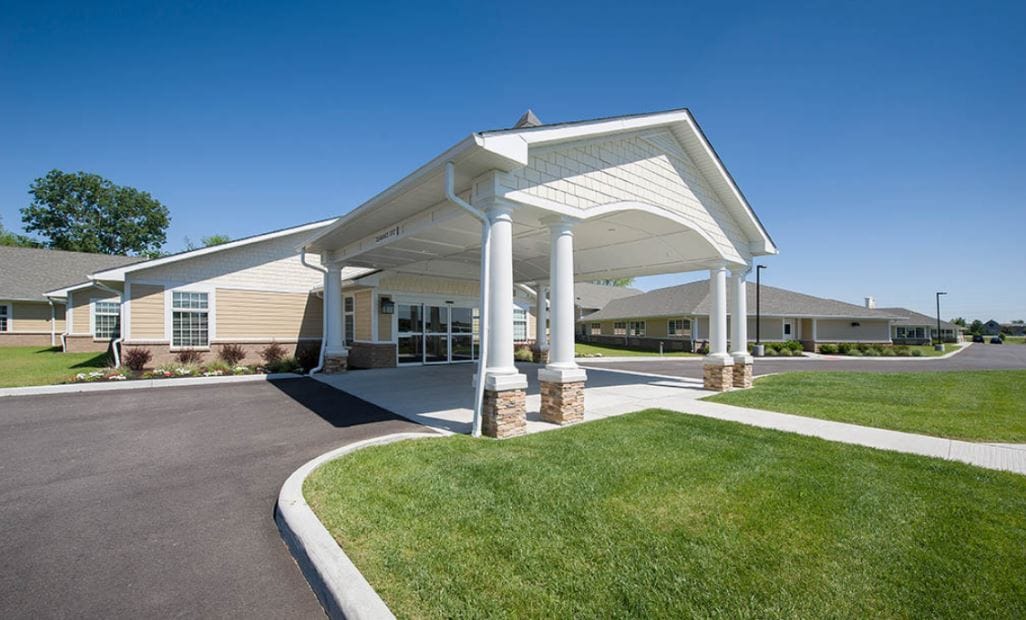
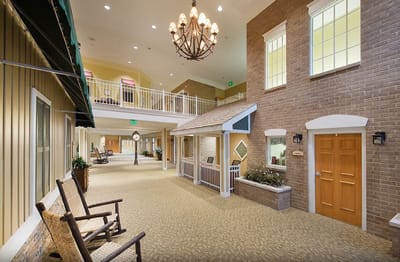
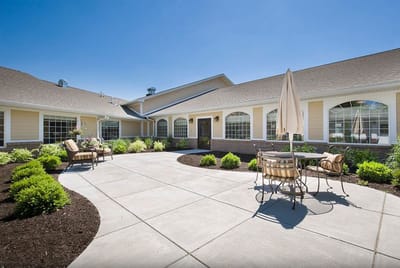
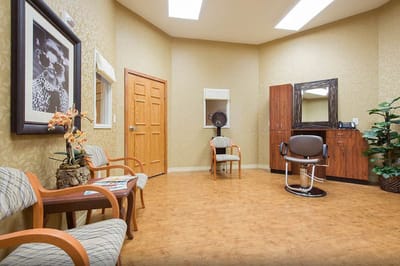
The Village at Hamilton Pointe is an independent living, assisted living, memory care, and rehabilitation community. Residents get seamless access to amenities and services that help to simplify their lives. Management and staff of the community understand that each resident is unique and has different needs, which is why they provide a program that personalizes care that is tailored to fit the needs of each individual.
The Village at Hamilton Pointe is the premier senior living home in Evansville because of its unparalleled level of service. Residents receive a range of services and access to amenities such as housekeeping, therapy, ADLs, mobility assistance, specialized programs, delicious meals served at the dining area, scheduled outings, and recreational activities in common areas are all offered.
| Staff type | Hours / Day / Resident | vs state avg |
|---|---|---|
|
Registered Nurse (RN)
| 36m per day | ▼ 10% State avg: 40m per day · National avg: 41m per day |
|
LPN / LVN
| 36m per day | ▼ 22% State avg: 46m per day · National avg: 52m per day |
|
Nurse Aide
| 2h 33m per day | ▲ 12% State avg: 2h 16m per day · National avg: 2h 21m per day |
|
Weekend Total Nursing
| 3h 14m per day | ■ Avg State avg: 3h 14m per day · National avg: 3h 26m per day |
|
Physical Therapist
| 4m per day | ■ Avg State avg: 4m per day · National avg: 4m per day |
|
Weekend RN
| 17m per day | ▼ 37% State avg: 27m per day · National avg: 29m per day |
These measures show how residents usually do over time at this home, based on health outcomes and preventive care.
Indiana average: 1.60
Indiana average: 1.48
Indiana average: 22.4%
Indiana average: 10.5%
Indiana average: 0.8%
Indiana average: 53.7%
Indiana average: 50.6%
Quality measures are calculated from Minimum Data Set (MDS) assessments. For most measures, lower percentages indicate better care quality.
Pets Allowed
![]() 3.3 miles from city center
3.3 miles from city center
![]() Estimated distance in miles from Newburgh's city center to The Village at Hamilton Pointe's address, calculated via Google Maps.
— 0.33 miles to nearest hospital (Deaconess Gateway Hospital)
Estimated distance in miles from Newburgh's city center to The Village at Hamilton Pointe's address, calculated via Google Maps.
— 0.33 miles to nearest hospital (Deaconess Gateway Hospital)
Add your location
The information below is reported by the Indiana Department of Health, Division of Long Term Care.
| North River Health Campus | NH ADC AL IL MC SNF | Evansville (East Baseline Road) | 95
Facility
95
IN AVG
116
Rank
#268 / 435 |
50.5%
Facility
50.5%
IN AVG
65.4
Rank
#338 / 425 | -23% | 3.66
Facility
3.66
IN AVG
3.44
Rank
#72 / 290 | +63% | +7% | $0
Facility
$0
IN AVG
$31.4k
Rank
#1 / 292 | 91
Facility
91
IN AVG
83
Rank
#71 / 392 | 10
Facility
10
IN AVG
25.0
Rank
#41 / 292 | 3.3
Facility
3.3
IN AVG
4.1
Rank
#108 / 292 | - | 48 | A+ |
11
Facility
11
IN AVG
37
Rank
#456 / 587 | Thomas Cook | $10.8MFiscal year ending 12/2023
Facility
$10.8MFiscal year ending 12/2023
IN AVG
$10.7M
Rank
#136 / 294 | $5.8MFiscal year ending 12/2023
Facility
$5.8MFiscal year ending 12/2023
IN AVG
$4.2M
Rank
#103 / 294 | 53.6%Fiscal year ending 12/2023
Facility
53.6%Fiscal year ending 12/2023
IN AVG
42%
Rank
#104 / 294 | 155854 | ||||
| River Pointe Health Campus | NH AL RC SNF | Evansville (Galaxy Drive) | 124
Facility
124
IN AVG
116
Rank
#157 / 435 |
46.8%
Facility
46.8%
IN AVG
65.4
Rank
#362 / 425 | -28% | 4.28
Facility
4.28
IN AVG
3.44
Rank
#33 / 290 | -8% | +24% | $0
Facility
$0
IN AVG
$31.4k
Rank
#1 / 292 | 75
Facility
75
IN AVG
83
Rank
#264 / 392 | 19
Facility
19
IN AVG
25.0
Rank
#118 / 292 | 3.8
Facility
3.8
IN AVG
4.1
Rank
#136 / 292 | 1 | 58 | A+ |
52
Facility
52
IN AVG
37
Rank
#199 / 587 | Randall Thompson | $11.6MFiscal year ending 12/2023
Facility
$11.6MFiscal year ending 12/2023
IN AVG
$10.7M
Rank
#110 / 294 | $6.1MFiscal year ending 12/2023
Facility
$6.1MFiscal year ending 12/2023
IN AVG
$4.2M
Rank
#93 / 294 | 52.6%Fiscal year ending 12/2023
Facility
52.6%Fiscal year ending 12/2023
IN AVG
42%
Rank
#129 / 294 | 155723 | ||||
| Cypress Grove Rehabilitation Center | NH HOS MC PC RC SNF | Newburgh | 90
Facility
90
IN AVG
116
Rank
#285 / 435 |
88.9%
Facility
88.9%
IN AVG
65.4
Rank
#38 / 425 | +36% | 3.02
Facility
3.02
IN AVG
3.44
Rank
#213 / 290 | +23% | -12% | $0
Facility
$0
IN AVG
$31.4k
Rank
#1 / 292 | 83
Facility
83
IN AVG
83
Rank
#154 / 392 | 15
Facility
15
IN AVG
25.0
Rank
#77 / 292 | 3.0
Facility
3.0
IN AVG
4.1
Rank
#82 / 292 | - | 80 | A+ |
56
Facility
56
IN AVG
37
Rank
#172 / 587 | Brandon Burns | $10.3MFiscal year ending 12/2023
Facility
$10.3MFiscal year ending 12/2023
IN AVG
$10.7M
Rank
#157 / 294 | $5.5MFiscal year ending 12/2023
Facility
$5.5MFiscal year ending 12/2023
IN AVG
$4.2M
Rank
#137 / 294 | 53.8%Fiscal year ending 12/2023
Facility
53.8%Fiscal year ending 12/2023
IN AVG
42%
Rank
#123 / 294 | 155273 | ||||
| West River Health Campus | NH ADC AL MC RC SNF | Evansville (Westside) | 131
Facility
131
IN AVG
116
Rank
#138 / 435 |
74.0%
Facility
74.0%
IN AVG
65.4
Rank
#155 / 425 | +13% | 4.56
Facility
4.56
IN AVG
3.44
Rank
#27 / 290 | -1% | +33% | $18.7k
Facility
$18.7k
IN AVG
$31.4k
Rank
#265 / 292 | 73
Facility
73
IN AVG
83
Rank
#292 / 392 | 17
Facility
17
IN AVG
25.0
Rank
#105 / 292 | 2.1
Facility
2.1
IN AVG
4.1
Rank
#34 / 292 | 2 | 97 | A+ |
2
Facility
2
IN AVG
37
Rank
#546 / 587 | Carla Baker | $10.1MFiscal year ending 12/2023
Facility
$10.1MFiscal year ending 12/2023
IN AVG
$10.7M
Rank
#153 / 294 | $5.4MFiscal year ending 12/2023
Facility
$5.4MFiscal year ending 12/2023
IN AVG
$4.2M
Rank
#125 / 294 | 53.1%Fiscal year ending 12/2023
Facility
53.1%Fiscal year ending 12/2023
IN AVG
42%
Rank
#109 / 294 | 155785 |
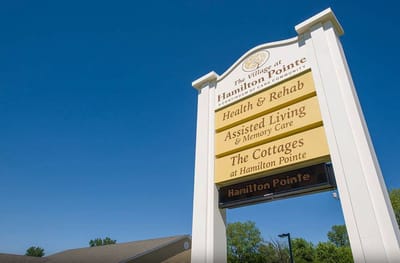
The Village at Hamilton Pointe is located in Newburgh, Indiana.
Here are the financial assistance programs available to residents in Indiana.
The Village at Hamilton Pointe has a walk score of 16. Car-dependent. Most errands require a car, with limited nearby walkable options.
Yes — there are 5 photos of The Village at Hamilton Pointe in the photo gallery on this page.
The Village at Hamilton Pointe is located at 3800 Eli Pl, Newburgh, IN 47630.
(812) 867-2680 will put you in contact with the team at The Village at Hamilton Pointe.
The Village at Hamilton Pointe is not currently listed as a CMS-certified provider of Medicare or Medicaid.
Care Cost Calculator: See Prices in Your Area
Nursing Home Data Explorer
Don’t Wait Too Long: 7 Red Flag Signs Your Parent Needs Assisted Living Now
The True Cost of Assisted Living in 2025 – And How Families Are Paying For It
Understanding Senior Living Costs: Pricing Models, Discounts & Financial Assistance


